Int. J. Electrochem. Sci., 7 (2012) 2448 - 2454
International Journal of
ELECTROCHEMICAL
SCIENCE
www.electrochemsci.org
Short Communication
Effect of Zn-Substitution on the Mechanical, Thermal and
Conductivity of AgI rich AgI–ZnI
2Solid Solutions
Ng Meng Nee, Mohd Rafie Johan*
Nanomaterials Engineering Research Group, Advanced Materials Research Laboratory, Department of Mechanical Engineering, University of Malaya, Lembah Pantai 50603, Kuala Lumpur, Malaysia
*
E-mail: [email protected]
Received: 19 November 2011 / Accepted: 2 February 2012 / Published: 1 March 2012
The composition of silver iodide rich solid solutions (x)AgI – (1-x)ZnI2 (0.5≤ x ≤1) were prepared
using mechano-chemical technique. Addition of ZnI2 content reduces the degree of crystallinity of
samples. Sample with 70% AgI shows the most amorphous structure. From the DSC curve, the glass transition temperature (Tg) of 70% AgI is 80.91ºC. The increasing ZnI2 content decreases the Tg of
AgI-ZnI2 system. 70% of AgI exhibited the highest conductivity at room temperature, which is 1.913 ×
10-4S/cm. The flexural modulus and ultimate flexural strength for 70% AgI are 0.069MPa and 0.058MPa respectively. Sample with 70% of AgI was used for battery fabrication. Open circuit voltage and the internal resistance obtained are 0.654V and 4.4Ω respectively.
Keywords: Silver iodide; Zinc iodide; Ionic conductivity; Open circuit voltage; Internal resistance
1. INTRODUCTION
Silver ion conducting solid electrolytes have attracted widespread interest due to their possible applications in solid state electrochemical devices [1-2]. The majority of these solids have been prepared with silver iodide (AgI) as the host compound. AgI is well known materials as an ionic conductor (Ag+) at ambient temperature. It undergoes a first order structural phase transition (wurtzite (β)/ zincblende (γ)/ body centered cubic (α) phase) at 147°C to a highly dynamic superionic state, with an extremely high ionic conductivity (σ~ 0.1 - 1.0Ωcm-1
chemical substitution on AgI provides further insight into the complexities of the phase transition thus helps arriving at a mechanism governing the ion transport within the crystal lattice [4]. Chemical substitution has been used extensively to modify either the magnitude of ionic conductivity or the transition temperature separating superionic and covalent phases in various solid electrolytes. In the present investigation, we seek to determine the effect of zinc substitution on the ionic conductivity, mechanical properties and phase transition behavior of (x)AgI-(1-x)ZnI2 (0≤x≤1) system. As far as AgI
is concerned, addition is zinc, the performance of solid state batteries with zinc as cathode active material is also described.
2. EXPERIMENTAL
AgI was prepared by the chemical reaction of silver nitrate (AgNO3) and potassium iodide (KI)
as starting material. They were weighted and dissolved in 1000 ml of distilled water to produce the co-precipitation of AgI. The AgI was then washed with distilled water and dried in oven at 50ºC for 1 day. The AgI was then mixed with ZnI2 powder thoroughly using ball mill at different composition. The
mixed powder was pressed at 25 tons to form pellets. Structural characterization was performed using a Siemen D500 X-ray diffractometer. The ionic conductivity was measured using Hioki 3531 Z Hi-Tester impedance spectroscopy in the frequency range of 50Hz to 1MHz. The thermograms of the samples were obtained using Metler DSC 820 at a heating rate of 10°Cmin-1
. The mechanical properties were measured using three point bending flexural test.
3. RESULTS AND DISCUSSION
[image:2.596.215.378.547.688.2]3.1 X-Ray Diffraction (DSC) Analysis
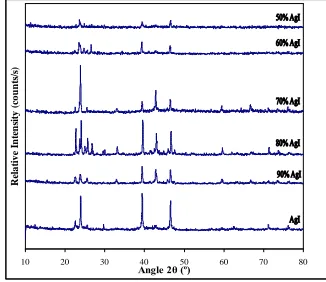
Fig. 1 shows the powder XRD patterns of the as-prepared samples.
10 20 30 40 50 60 70 80
Angle 2θ (º)
R
el
a
ti
v
e
In
te
n
si
ty
(
co
u
n
ts
/s
)
The patterns consist of three prominent Bragg peaks at 24 º, 39 º and 47 º which indicate the crystalline nature of AgI. As ZnI2 was added into AgI, there are new peaks appear at angle of 22 º, 26
[image:3.596.97.497.182.319.2]º, 33 º and 43 º which varies greatly from the pure AgI.
Table 1. Compositions of AgI-ZnI2 system with electrical conductivity, ultimate flexural strength and
flexural modulus
Sample Composition σ (Scm-1) Ultimate Flexural Strength (MPa)
Flexural Modulus (MPa)
1 AgI 4.970 × 10⁻⁶ 0.036 0.105
2 0.9 AgI-0.1 ZnI2 1.525 × 10⁻⁴ 0.036 0.061
3 0.8 AgI-0.2 ZnI2 1.318 × 10⁻⁴ 0.047 0.045
4 0.7 AgI-0.3 ZnI2 1.913 × 10⁻⁴ 0.058 0.069
5 0.6 AgI-0.4 ZnI2 4.010 × 10⁻⁵ 0.040 0.079
6 0.5 AgI-0.5 ZnI2 1.331 × 10⁻⁴ 0.054 0.098
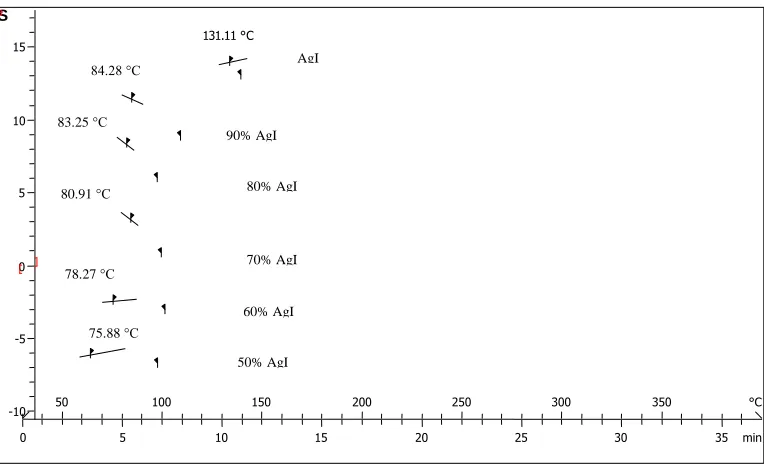
3.2 Differential Scanning Calorimeter (DSC) Analysis
Figure 2. DSC curve for silver rich AgI-ZnI2 system at various compositions
The variation intensities of the peaks for different compound were observed. The amorphous hump observed indicated the increased of amorphous character in the compound. These suggest that part of AgI was remained salt-free while other was salt-contained. As a result, it transformed into the amorphous phase and hence displays less crystallinity [5]. XRD pattern at various compositions shows
-10 -5 0 5 10 15 min °C
50 100 150 200 250 300 350
0 5 10 15 20 25 30 35
S
e
Onset 131.11 °C
AgI mW -10 -5 0 5 10 15 min °C
50 100 150 200 250 300 350
0 5 10 15 20 25 30 35
^exo
STARe SW 9.01
DEMO Versi on
AgI
Onset 78.37 °C
90% AgI mW -10 -5 0 5 10 15 min °C
50 100 150 200 250 300 350
0 5 10 15 20 25 30 35
^exo
STARe SW 9.01
DEMO Versi on
90% AgI
Onset 80.91 °C
70% AgI mW -10 0 10 20 min °C
50 100 150 200 250 300 350
0 5 10 15 20 25 30 35
^exo
STARe SW 9.01
DEMO Versi on
80% AgI
Onset 78.27 °C
60% AgI mW 0 5 10 15 20 25 min °C
50 100 150 200 250 300 350
0 5 10 15 20 25 30 35
^exo
STARe SW 9.01
DEMO Versi on
84.28 °C
83.25 °C
70% AgI
Onset 80.91 °C
70% AgI mW -10 0 10 20 min °C
50 100 150 200 250 300 350
0 5 10 15 20 25 30 35
^exo
STARe SW 9.01
DEMO Versi on
80.91 °C
78.27 °C
Onset 75.88 °C
50% AgI mW 0 10 20 30 40 min °C
50 100 150 200 250 300 350
0 5 10 15 20 25 30 35
^exo
STARe SW 9.01
DEMO Versi on
75.88 °C
60% AgI
[image:3.596.108.490.378.613.2]
the disappearance and nucleation of new peaks with the addition of ZnI2. These indicate of the
complexation of AgI and ZnI2. The added ZnI2 distrupted the crystalline structure of AgI and converts
it into a more amorphous phase. Thus, it reduces the degree of crystallinity with randomly distributed stacking faults [6].
Fig. 2 shows a decrease of glass transition temperature, Tp with the increases of ZnI2 content.
The sample becoming unstable and lead to the phase transition. The pure AgI undergo phase transformation at the temperature of 131ºC with the addition of ZnI2. This was well explained by the
presence of amorphous phase in the XRD results due to the increasing of ZnI2 content [8].
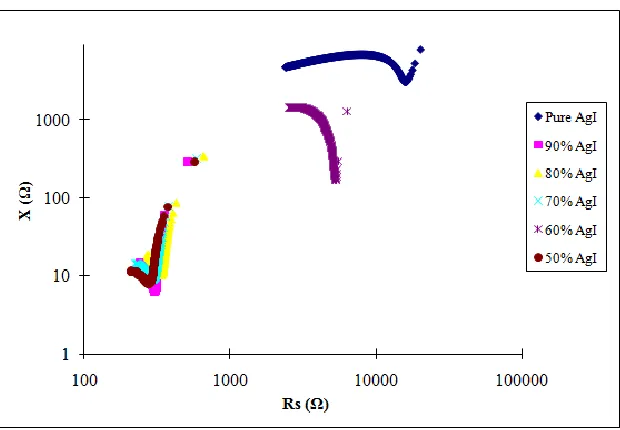
[image:4.596.144.454.266.481.2]3.3 Electrical Conductivity Analysis
Figure 3. The cole-cole plot for silver rich AgI-ZnI2 system at various compositions
From Table 1 the conductivity varies randomly with the increasing of ZnI2 content. This is due
to the change of ionic mobility in the presence of Zn ions in the host material. Composition with 70% wt of AgI exhibits the highest conductivity that is 1.913 × 10⁻⁴ S/cm while the pure AgI is the lowest. It shows that the addition of ZnI2 content contributed to the enhancement of ionic conductivity by
electrode/sample interface. Table 2 shows the temperature dependence of the ionic conductivity for the sample with the composition 0.7AgI-0.3ZnI2.
Table 2. Temperature dependent of conductivity for sample with 0.7 AgI-0.3 ZnI2
Sample Temperature (ºC) Conductivity (S/cm)
1 25 1.913 × 10⁻⁴
2 50 6.985 × 10⁻⁴
3 70 1.060 × 10⁻³
4 90 1.190 × 10⁻⁵
5 110 4.902 × 10⁻⁶
6 130 1.285 × 10⁻⁶
Table 2 shows that the ionic conductivity increases from 25ºC to 70ºC and decreases at 90ºC. As the temperature increases, the silver salts get dissociated which resulted in increases of Ag+ concentration. The decreases of conductivity are due to the short range ordered clusters embedded in a highly conductive disordered medium. As the temperature was further increased, formation of clusters will blocked the pathways for ions migration. As a results the mobility of ion will be decreased [7-8].
3.4 Flexural Analysis
From Table 1, sample with 70% of AgI exhibit the highest ultimate flexural strength, which is 0.058MPa while both pure and 90% of AgI have the smallest one, which is 0.036MPa. Besides, pure AgI shows the highest flexural modulus which is 0.105MPa while 80% of AgI exhibit the lowest flexural modulus which is 0.045MPa. There is a correlation between high conductivity and high mechanical properties which occurred at 70% AgI.
3.5 Open Circuit Voltage (OCV)
The OCV for the cell fabricated from the 0.7AgI-0.3ZnI2 electrolyte using zinc as the active
material is 0.654V. This is very close to the thermodynamic value related to the AgI formation that is 0.690V at room temperature [9].
3.6 Internal Resistance
Fig. 4 shows the voltage-current character of 0.7AgI-0.3ZnI2. Hence, the internal resistance of
a seemingly good battery because the available energy cannot be delivered in the required manner and remains in the battery. Interaction of iodine with the Ag+ ions at room temperature may lead to the formation of β phase AgI. This β phase AgI can increase the cell’s internal resistance [10].
0.600 0.620 0.640 0.660
0 0.002 0.004 0.006 0.008 0.01
Current (A)
V
ol
tag
e (
V
[image:6.596.119.476.139.338.2])
Figure 4. Voltage-current characteristics of 0.7AgI-0.3ZnI2 battery
4. CONCLUSION
The ionic conductivity of the sample is related to the crystalline structure where the most amorphous sample (70% AgI) shows the highest conductivity of 1.913 × 10⁻⁴
S/cm. The addition of ZnI2 content into AgI has improves the ionic conductivity significantly. The effect of phase transition
and degree of cystallinity are investigated by XRD and DSC analysis. The most amorphous phase occurs at 70% AgI and the Tg obtained is 80.91ºC. 70% AgI shows the highest ultimate flexural
strength, which is 0.058MPa. The temperature dependence conductivity was performed at sample 70% AgI, the result show that conductivity rises from room temperature to 70ºC and decrease from 90ºC to 130ºC. Battery was fabricated using 70% AgI. The open circuit voltage and internal resistance were determined, which is 0.654V and 4.4Ω, respectively.
References
1. B. V. R. Chowdari, Q. G. Liu and L. Q. Chen, World Scientific (1990).
2. B. V. R. Chowdari, S. Chandra, S. Singh and P. C. Srirastava, World Scientific, (1990). 3. S. Chandra, Superionic Solids, (1981).
5. M. H. Nordin, Z. A. Rahman, M. R. Johan, S. Anandan, and A. K. Arof, IFMBE Proceedings 15, (2007) 144.
6. P. S. Kumar, P. Balayab, P. S. Goyalb and C. S. Sunandana, Journal of Physics and chemistry of Solids 64, (2002) 961.
7. H. K. Farizul, S. A. Aishah, D. Suhardy, A. S. Saiful and M. N. Salleh, Proceedings of the 1st International Conference on Natural Resources Engineering & Technology. (2006) 262-273. 8. R. C. Agrawal, M. L. Verma, R. K. Gupta, R. Kumar and R. M. Chandola, Journal of Ionics 8
(2002) 426.
9. B. Scrosati and G. Pistoia, Journal of Applied Electrochemistry 4 (1974) 201. 10.A.K. Arof, Thesis, University of Malaya, Kuala Lumpur (2006).