ORIGINAL ARTICLE
Effect of water-based sol gel method on structural,
thermal and conductivity properties of
LiNO
3
–Al
2
O
3
composite solid electrolytes
M. Sulaiman
*, A.A. Rahman, N.S. Mohamed
Centre for Foundation Studies in Science, University of Malaya, 50603 Kuala Lumpur, Malaysia
Received 19 July 2013; accepted 23 April 2015 Available online 4 May 2015
KEYWORDS
Composite material; Conductivity; Lithium nitrate; Alumina composite
Abstract Composite solid electrolytes in the system (1x)LiNO3–xAl2O3, withx= 0.0–0.5 were
prepared by sol gel method. No organic solvents but water was used as medium for the sol prepa-ration. The obtained materials were characterized by X-ray diffraction, differential scanning calorimetry, scanning electron microscopy, Fourier transform infrared spectroscopy and impedance spectroscopy. Structural analysis evidenced amorphous phase of LiNO3in all composite samples.
Traces of crystalline LiAl5O8 and LiAlO2 were also present in the composite samples with
x= 0.3–0.5, as indicated by the X-ray diffractograms. The thermal analysis showed that the sam-ples were in a stable phase between48C –100C and120C –220C. The conductivity values of the composites were in the range of 103S cm1at room temperature to 180C. Our study demonstrates that water is suitable for the preparation of the composite solid electrolytes.
ª2015 The Authors. Production and hosting by Elsevier B.V. on behalf of King Saud University. This is an open access article under the CC BY-NC-ND license (http://creativecommons.org/licenses/by-nc-nd/4.0/).
1. Introduction
The fast development and extensive application of electronic products, especially in automotive use and portable electron-ics require safe solid-state secondary batteries with high energy (Tarascon and Armand, 2001; Minami et al., 2005). For instance, lithium ion solid-state batteries are current power sources of choice due to their light weight, high
voltage and high value of energy content and have con-tributed to the manufacture of countless electronic products (Scrosati and Garche, 2010). Solid-state batteries have both solid electrodes and electrolytes with good ion conductors for high power density. Solid electrolytes can be crystalline– polycrystalline, glassy-amorphous, composite and polymeric (Agrawal and Gupta, 1999). Composite solid electrolytes started to draw interest since the observation of enhanced ionic conductivity byLiang, 1973. Since then, both physical and chemical properties of composite solid electrolytes have been studied and the presence of number of surfaces and defect formation at free surfaces and interfaces in composites are main factor of conductivity enhancement (Uvarov and Vanek, 2000; Yaroslavtsev, 2009; Sulaiman et al., 2011, 2012). Uvarov observed that their structure could be either epitaxial crystalline or amorphous (Uvarov and Vanek, * Corresponding author. Tel.: +603 79675918.
E-mail address:[email protected](M. Sulaiman). Peer review under responsibility of King Saud University.
Production and hosting by Elsevier
King Saud University
Arabian Journal of Chemistry
www.ksu.edu.sa www.sciencedirect.com
http://dx.doi.org/10.1016/j.arabjc.2015.04.031
2000). In 1979, Wagner et al. (Jow and Wagner, 1979) reported that conductivity enhancement in a binary system MX-Al2O3was associated with high concentration of defects
in the ionic salts, MX containing mobile ions, M+. Strong surface interaction of ionic salts with oxide leads to the spreading of MX over the surface of oxide and at adequately high oxide dispersity and concentration, the whole volume of the ionic salt turns into either a surface disordered state or an amorphous phase (Uvarov, 2000, 2011). These phenomena have been ascertained in our previous work on composite solid electrolytes in the system (1x)LiNO3–xAl2O3 with
x= 0.0–0.5 based on ethanol sol gel method (Sulaiman et al., 2012). In this method, higher ionic conductivity values in the order of 103S cm1 at room temperature were obtained compared to the conductivity values around 105S cm1 (at 70C) for the same composite system pre-pared using mechanical milling (Uvarov et al., 1996a; Sulaiman et al., 2012). Here, we report the preparation of composite solid electrolytes in the system (1x)LiNO3–
xAl2O3using water-based sol gel technique instead of ethanol
based sol–gel and investigate their structural, thermal and conductivity properties. Structural characterizations were car-ried out by X-ray diffraction (XRD), differential scanning calorimetry (DSC), scanning electron microscopy (SEM) and Fourier transform infrared spectroscopy (FTIR). The conductivity study was determined by alternating current (AC) impedance measurements. Our study demonstrates for the first time that deionized water which is both environmen-tal friendly and economical, is suitable for the preparation of (1x)LiNO3–xAl2O3 with x= 0.0–0.5 composite solid
elec-trolytes with high conductivity at room temperature.
2. Experimental
Composite solid electrolytes in the system (1x)LiNO3–
xAl2O3 with x =0.1–0.5 mol were synthesized by sol gel
method. LiNO3 (purity >99.0%, Fluka) and Al2O3 (purity
>99.7%, Sigma Aldrich) were used as purchased without further purification. First, LiNO3was dissolved in deionized
water and Al2O3 was then added to the solution. The
solu-tion was continuously stirred at 40C for 20 min. Consequently, to the solution was added citric acid and the mixture was heated at 80C on a hot plate with continuous stirring until the formation of a wet gel. The wet gel was then fully dried in oven at 220C. The final product obtained was fluffy and brown. Structural characterizations for XRD, FTIR and SEM were performed on a D8 Advanced-Bruker X-ray Diffractometer with Cu Ka radiation, a Perkin Elmer RX1 spectrometer and INCA Energy 200 (Oxford Ins.), respectively. The thermal properties of the samples were mea-sured on a Mettler Toledo DSC 822 with continuous heating at a rate of 10C min1. For conductivity studies, pellets were made by pressing the composite powders at a pressure of 6–8 tones cm2. The diameters of the pellets were 13 mm and their thicknesses were about 1.1 mm. The pellets were then sandwiched between two electrodes of a sample holder. Conductivities were measured by impedance spectroscopy on Solatron 1260 impedance analyzer at room temperature to 200C. An ac amplitude of 100 mV in the frequency range of 101–107Hz was used.
3. Results and discussion
3.1. XRD analysis
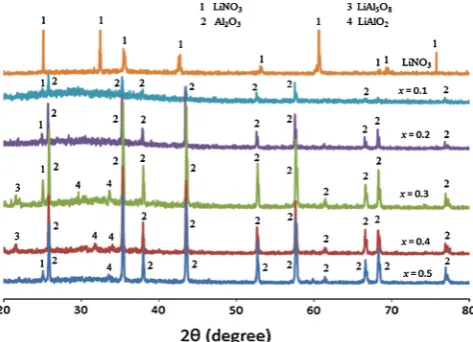
Fig. 1shows XRD spectra for the pure LiNO3and composite
samples of (1x)LiNO3–xAl2O3. The diffraction peaks at 2h
of 25.7, 35.3, 37.8, 43.5, 52.6, 59.4, 61.4, 66.5, 68.6
and 76.9observed in the spectra of composite samples with
x =0.1–0.5 were attributed to Al2O3. Only one peak of very
low intensity of LiNO3appeared at 2h25for all composite
samples, except in sample withx =0.4. The absence of some LiNO3peaks in the XRD spectra corresponds to the existence
of either crystalline and amorphous phases of LiNO3 or a
mesophase phase (Uvarov, 2011). At x =0.4, the crystalline LiNO3 was fully transformed into amorphous state. At the
same time, weak reflection appeared at 2h22in the spectra of the samples withx =0.3–0.4 and was assigned to crystalline LiAl5O8. Atx =0.3–0.5, the diffraction peaks appeared at 2h
29, 32 and 34 and were ascribed to LiAlO2. The
XRD spectra for composite samples withx =0.3–0.5 showed that chemical reactions took place between LiNO3and Al2O3
during the sol gel preparation to produce traces of crystalline LiAl5O8and LiAlO2(lithium aluminates). The transformation
of the interaction in the composite samples can be represented by the following route (Sulaiman et al., 2012; Oksuzomer et al., 2004; Valenzuela et al., 2001):
Lithium nitrateþalumina!amorphousþLiAl5O8
þLiAlO2
In earlier work, the LiAl5O8 phase was not detected
(Sulaiman et al., 2012). This can be explained by the high degree of solubility of LiNO3in water than that in ethanol.
3.2. DSC analysis
DSC curves of the composite (1x) LiNO3–xAl2O3 samples
are shown Fig. 2. An endothermic peak was observed at 100C and was attributed to dehydration. A stable phase for the composite system (x= 0.1–0.5) appeared between
[image:2.595.312.549.527.698.2]120C and 200C. An endothermic peak around 220C
was attributed to the decomposition of citric acid. Another endothermic peak at 252C was attributed to the melting of LiNO3(Tm) (Ribeiro et al., 2001). There was no melting point
of crystalline LiNO3 found in the composite sample with
x <0.5. This phenomenon could be attributed to the phase change of crystalline LiNO3 to amorphous and mesophase
phases that occurred due to the application of heat closed to the melting point of pure LiNO3 during the preparation of
the samples (Uvarov, 2011). At this state, the long-range and rigid ordering of crystalline LiNO3 breaks down to a less
ordered state, thereby promoting the Li+ion mobility in the composites. The exothermic peaks at 290C – 350C in all composite samples were related to the thermal decomposi-tion of LiNO3 and the formation of lithium aluminates
(Chatterjee and Naskar, 2003; Oksuzomer et al., 2004). There was no exothermic curve of the formation of lithium aluminates found for composite sample withx= 0.1.
3.3. FTIR analysis
FTIR spectra of LiNO3(x= 0.0) and composite samples with
x= 0.1–0.5 in the wavenumber range 1500–500 cm1are pre-sentedFig. 3(a). The very strong absorption band in the spec-tra of pure LiNO3 at 1384 cm1 and the medium bands at
1051 cm1 and 827 cm1 were ascribed to the asymmetric stretching mode, symmetric stretching mode and out of plane deformation mode of NO3ions, respectively (Chatterjee et al.,
1998, 2002; Kamiya et al., 1991; Nakamoto, 1978; Tamura et al., 2004; Gaphurov and Aliev, 1999). These characteristic bands of nitrate groups appeared at 1389–1402 and 825–827 cm1in all spectra of the composite samples demon-strating that LiNO3phase was present in all of the composite
samples (x= 0.1–0.5).
As can be seen inFig. 3(b), there was a small asymmetric distortion in the contour of symmetric stretching mode band of NO3 for the composite sample with x= 0.4. The
band-width of the vibration band became broader and the position was slightly shifted to 1050 cm1. The contour band of the symmetric stretching mode was inconspicuous for composite samples withx= 0.1, 0.2, 0.3 and 0.5. This effect was due to the heating of the sample up to a temperature 30C below the melting point of pure LiNO3 allowing the formation of
fully amorphous phase of LiNO3 (Uvarov, 2011).Gaphurov
et al. (2002) reported that the distortion was related to the
orientation disordered anions of NO3 anions in the LiNO3
crystal lattice. A similar observation was reported in RbNO3–Al2O3nanocomposite, where the position of
absorp-tion peaks in a disordered state was observed at lower wavenumber and broadened (Uvarov et al., 1996b).
The complex structure of asymmetric stretching mode band at 1389 cm1 of the spectra of composite samples with
x= 0.3–0.5 was attributed to interaction between nitrates and alumina particles. As discussed in Section3.1, traces of crystalline LiAl5O8and LiAlO2were formed in these
compos-ite samples. The vibration bands of Al–O bonds could be observed in the infrared region between 900 and 500 cm1 (Chatterjee and Naskar, 2003; Boumaza et al., 2009). The bands at 550 and 636 cm1observed inFig. 3(a) corresponded from AlO6 stretching modes and were linked to a-Al2O3
(Boumaza et al., 2009). Bands at 642, 544 and 520 cm1 in composite samples with x= 0.3–0.5 referred to AlO4–LiO4
lattice of the LiAlO2and LiAl5O8phases (Oksuzomer et al.,
2004; Li et al., 2002). The bands appeared at 610 and 680 cm1 corresponding to LiAl5O8 phase could be clearly
be seen in composite sample withx= 0.3 (Oksuzomer et al., 2004; Ribeiro et al., 2001). The changes in the spectral proper-ties in the nitrates could be attributed to the rotary mobility of molecular ion due to substantial thermal activation and the increase in dynamic interaction between the ions that occurred during the sample preparation (Gaphurov et al., 2002).
3.4. SEM analysis
Fig. 4 shows SEM micrographs of composite sample with
x= 0.4. As observed from Fig. 4(a), only alumina particles dominantly appeared in the composite sample. On the con-trary, the LiNO3(dark region) was observed to be in the
amor-phous form and apparently spreading over the alumina particle surface. The spreading of lithium nitrate over the sur-face of the oxide was the main factor to the formation of the amorphous phase of lithium nitrate. The ionic salt was expected to spread only in a molten state which occurred at temperatures closed toTm. The amorphous phase was formed
as the result of the ionic melt and physical interaction of both Al2O3 and LiNO3 crystalline phases (Uvarov et al., 1996b;
Neiman et al., 2007). According to Uvarov and Vanek (2000), amorphous phase may be formed at the interface phase when composites obtained are in strong nonequilibrium condi-tions or if the surface structures of ionic salts and oxide are very different.Fig. 4(b) shows that alumina particles (white region) were uniformly dispersed in the composite mixture confirming thus interfacial interaction between both Al2O3
and LiNO3crystalline phases.
3.5. Electrical conductivity
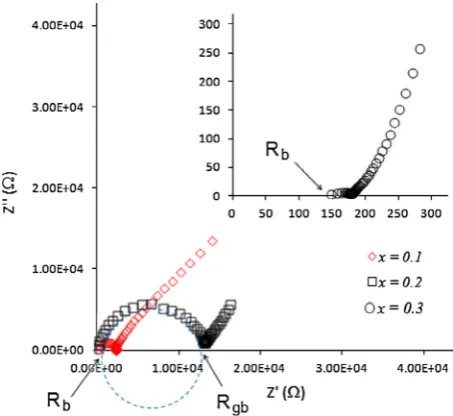
Complex impedance plots of composite samples with
[image:3.595.58.270.54.199.2]x= 0.1–0.3 and x= 0.4–0.5 are shown in Figs. 5 and 6, respectively. For composite samples withx–0.1–0.3, the plots show a slanted spike at low frequency and distorted semicircles at higher frequencies. The formation of spike represented interfacial effects between electrode and electrolyte (Dygas et al., 2005; Godinho et al., 2003). The high and low frequency semicircles with the interception at the Z’-axis were assigned to bulk resistance (Rb) and grain boundary resistance (Rgb),
respectively. The appearance of these two semicircles could be associated with different conduction process in the composite samples. The ionic conduction could be occurring through the grain and along the grain boundaries of LiNO3.
However, the semicircle portion at higher frequency disap-peared with increase in alumina composition, as shown in impedance plot for composite samples with x= 0.4–0.5 (Fig. 6). The disappearance of semicircle portion implied that only resistive components prevailed in the composite samples. In this case, alumina particles were the only resistive compo-nent, as clearly shown in the SEM micrographs inFig. 4. In
the present work, by knowing the value of bulk resistance (Rb), the conductivity has been calculated using the
relation-ship as shown below:
r¼ d RbA
ð1Þ
wheredis the sample thickness (cm),Rbis bulk resistance (X),
andAis the area (cm2) of the sample.
Fig. 7shows the compositional dependence of conductivity at room temperature (25C) for pure LiNO3 and (1x)
[image:4.595.108.501.52.375.2]LiNO3–xAl2O3 composite samples. The conductivity
[image:4.595.129.476.412.574.2]Figure 3 FTIR spectra of (1x)LiNO3–xAl2O3composites in (a) 500–1500 cm1and (b) 1100–1000 cm1regions.
dependence plot had two maxima atx= 0.1 andx= 0.4. The conductivities were found to increase fromx= 0.0 to 0.1 but decreased steadily with further increase inx. However, beyond the composite samples with x= 0.2, the conductivity slowly increased up to x= 0.4. From Fig. 7, it was observed that the conductivity decreased again after the maximum point of
x= 0.4. The enhancement in ionic conductivity in the com-posite sample with x= 0.1 was due to the formation of the amorphous phase of LiNO3, as indicated by the XRD and
DSC results, in Figs. 1 and 2, respectively. The collapse of LiNO3 crystal lattice initiated the orientational disordered
anions of NO3 and consequently increased the number of
Li+ ions. It suggests that the ionic conductivity proceeded via amorphous interface phase (Gaphurov et al., 2002; Uvarov et al., 1996a; Rao et al., 2005). Decrease in conductiv-ity for composite samples withx> 0.1 could be explained by the increasing amount of alumina (dispersoid) grains in the composites which reduced the surface area of contact between
the host matrix of LiNO3and the dispersoid grains. This led to
the blocking effect by the alumina grains that hinder the migration of the Li+ ions. Beyond x= 0.2, however, the conductivity continued to increase due to the presence of new phases of LiAlO2and LiAl5O8in the composite samples
with x= 0.3–0.5. The highest conductivity value of 1.97·103S cm1 occurred in the composite sample with
x= 0.4. The high ionic conductivity in this composite sample was related to the presence of the fully amorphous phase of LiNO3as revealed by the XRD spectra and the spreading of
the LiNO3over the alumina as shown in the SEM micrograph
inFig. 4. The high ionic conductivity around 103S cm1at room temperature has also been observed for the same com-posite solid electrolyte system prepared using ethanol (Sulaiman et al., 2012). It means that the water-based system of the prepared composite samples is able to produce materials with high ionic conductivity.
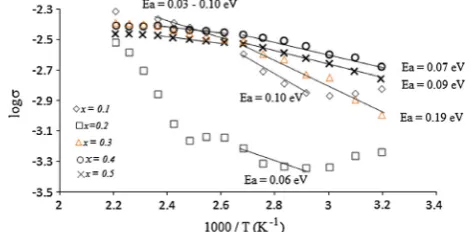
Temperature dependencies of conductivity for (1x)LiNO3–xAl2O3 composites prepared are shown in
Fig. 8. Conductivities values of the composite samples increased with temperature. Interestingly, the composite sam-ples exhibited conductivities in the same range of 103S cm1at room temperature to 180C (exceptx= 0.2). As discussed earlier, the amorphous phase of the LiNO3
played a major role in conductivity enhancement in composite samples. Beginning at a temperature of 110C, conductivities continued to be constant (except x= 0.2). This was due to stable state between 110C and 200C as shown in the DSC curves. The low ionic conductivity in composite sample with
x= 0.2 could be related to the absence of crystalline LiAlO2
and LiAl5O8, which on the other hand, enhanced the
conduc-tivity of the composite samples withx= 0.3–0.5. The activa-tion energy was obtained by fitting the ionic conductivity data with Arrhenius equation:
r¼Aexp Ea
kT
ð2Þ
where A is the pre-exponential factor, Ea is the activation
energy for conduction andkis the Boltzmann’s constant which is 8.52·105eV/kelvin, T is the temperature in Kelvin. The activation energy for all samples is shown inFig. 8. The low value of activation energy indicates high mobility of ions in the sample.
Figure 5 Complex impedance plot of composite samples with
[image:5.595.51.278.54.262.2]x= 0.1, 0.2 and 0.3 at room temperature.
Figure 6 Complex impedance plot of composite samples with
[image:5.595.78.254.540.702.2]x= 0.4 and 0.5 at room temperature.
[image:5.595.311.535.570.702.2]4. Conclusions
Our study demonstrate for the first time that composite solid electrolytes in the system (1x)LiNO3–xAl2O3 with x=
0.0–0.5 prepared by sol–gel method using solely deionized water as medium for sol preparation exhibited high ionic con-ductivity at room temperature and especially atx= 0.4.
Acknowledgment
The authors would like to thank the University of Malaya for granting the Research Grant (RG021/09AFR) to support this work.
References
Agrawal, R.C., Gupta, R.K., 1999. Review superionic solids: com-posite electrolyte phase-an overview. J. Mater. Sci. 34, 1131–1162. Boumaza, A., Favaro, L., Ledion, J., Sattonnay, G., Brubach, J.B., Berthet, P., Huntz, A.M., Roy, P., Tetot, R., 2009. Transition alumina phases induced by heat treatment of boehmite: an X-ray diffraction and infrared spectroscopy study. J. Solid State Chem. 182, 1171–1178.
Chatterjee, M., Naskar, M.K., 2003. Novel technique for the synthesis of lithium aluminate (LiAlO2) powders from water-based sols. J. Mater. Sci. Lett. 22, 1747–1749.
Chatterjee, M., Enkhtuvshin, D., Siladitya, B., Ganguli, D., 1998. Hollow alumina microspheres from boehmite Sols. J. Mater. Sci. 33, 4937–4942.
Chatterjee, M., Naskar, M.K., Lakshmi, N.S., 2002. Sol-emulsion-gel synthesis of hollow mullite microspheres. J. Mater. Sci. 37, 343–348.
Dygas, J.R., Malys, M., Krok, F., Wrobel, W., Kozanecka, A., Abrahams, I., 2005. Polycrystalline BIMGVOX.13 studied by impedance spectroscopy. Solid State Ionics 176, 2085–2093. Gaphurov, M.M., Aliev, A.R., 1999. Raman and infrared
spectro-scopic studies of the platinum electrode/molten nitrate interface. Spectrochim. Acta Part A 55, 1237–1241.
Gaphurov, M.M., Aliev, A.R., Akhmedov, I.R., 2002. Raman and infrared study of the crystals with molecular anions in the region of a solid–liquid phase transition. Spectrochim. Acta Part A 58, 2683–2692.
Godinho, M.J., Bueno, P.R., Orlandi, M.O., Leite, E.R., Long, E., 2003. Ionic conductivity of Bi4Ti0.2V1.8O10.7polycrystalline
ceramics obtained by the polymeric precursor route. Mater. Lett. 57, 2540–2544.
Jow, T., Wagner, J.B., 1979. The effect of dispersed alumina particles on the electrical conductivity of cuprous chloride. J. Electrochem. Soc. 126, 1963–1972.
Kamiya, K., Takahashi, K., Maeda, T., Nasu, H., Yoko, T., 1991. Sol–gel derived CaO- and CeO2- stabilized ZrO2fibres conversion process of gel to oxide and tensile strength. J. Eur. Ceram. Soc. 7, 295–305.
Li, F., Hu, K., Li, J., Zhang, D., Chen, G., 2002. Combustion synthesis of c-lithium aluminate by using various fuels. J. Nucl. Mater. 300, 82–88.
Liang, C.C., 1973. Conduction characteristics of the lithium iodide – aluminium oxide solid electrolytes. J. Electrochem. Soc. 120, 1289– 1292.
Minami, T., Tatsumisago, M., Wakihara, M., Iwakura, C., Kohjiya, S., Tanaka, I., 2005. Solid State Ionics for Batteries. Springer. Nakamoto, K., 1978. Infrared and Raman spectra of inorganic and
co-ordination compounds. Wiley, New York.
Neiman, A.Y., Uvarov, N.F., Pestereva, N.N., 2007. Solid state surface and interface spreading: an experimental study. Solid State Ionics 177, 3361–3369.
Oksuzomer, F., Koc, S.N., Boz, I., Gurkaynak, M.A., 2004. Effect of solvents on the preparation of lithium aluminate by sol–gel method. Mater. Res. Bull. 39, 715–724.
Rao, M.V.M., Reddy, S.N., Chary, A.S., 2005. DC ionic conductivity of NaNO3:c- Al2O3composite solid electrolyte system. Physica B 362, 193–198.
Ribeiro, R.A., Silva, G.G., Mohallem, N.D.S., 2001. The influences of heat treatment on the structural properties of lithium aluminates. J. Phys. Chem. Solids 62, 857–864.
Scrosati, B., Garche, J., 2010. Review lithium batteries: status, prospects and future. J. Power Sources 195, 2419–2430.
Sulaiman, M., Rahman, A.A., Mohamed, N.S., 2011. Li2CO3–Al2O3 composite solid electrolytes prepared by sol gel method. Key Eng. Mater. 471–472, 379–384.
Sulaiman, M., Rahman, A.A., Mohamed, N.S., 2012. Sol–gel synthesis and characterization of LiNO3–Al2O3composite solid electrolyte. Solid State Sci. 14, 127–132.
Tamura, S., Mori, A., Imanaka, N., 2004. Li+ion conduction in (Gd, La)2O3–LiNO3system. Solid State Ionics 175, 467–470.
Tarascon, J.M., Armand, M., 2001. Issues and challenges facing rechargeable lithium batteries. Nature 414, 359–367.
Uvarov, N.F., 2000. Stabilization of amorphous phases in ion-conducting composites. Russ. J. Appl. Chem. 73, 1030–1035. Uvarov, N.F., 2011. Composite solid electrolytes: recent advances and
design strategies. J. Solid State Electrochem. 15, 367–389. Uvarov, N.F., Vanek, P., 2000. Stabilization of new phases in
ion-conducting nanocomposites. J. Mater. Synth. Proc. 8, 319–326. Uvarov, N.F., Hairetdinov, E.F., Skobelev, I.V., 1996a. Composite
solid electrolytes MeNO3– Al2O3(Me = Li, Na, K). Solid State Ionics 86–88, 577–580.
Uvarov, N.F., Vanek, P., Yuzyuk, Y.I., Zelezny, V., Studnicka, V., Bokhonov, B.B., Dulepov, V.E., Petzelt, 1996b. Properties of rubidium nitrate in ion-conducting RbNO3-Al2O3nanocomposites. J. Solid State Ionics 90, 201–207.
Valenzuela, M.A., Te´llez, L., Bosch, P., Balmori, H., 2001. Solvent effect on the sol–gel synthesis of lithium aluminate. Mater. Lett. 47, 252–257.
[image:6.595.55.291.56.172.2]Yaroslavtsev, A.B., 2009. Composite materials with ionic conductivity: from inorganic composites to hybrid membranes. Russ. Chem. Rev. 78, 1013–1029.