Int. J. Electrochem. Sci., 9 (2014) 3846 - 3863
International Journal of
ELECTROCHEMICAL
SCIENCE
www.electrochemsci.orgElimination Voltammetry as a New Method for Studying the
SAM Formation
Zuzana Nováková1, Renáta Oriňáková2, *, Andrej Oriňák2, Pavol Hvizdoš3
, Andrea Straková Fedorková2,4
1
Department of Physical and Theoretical Chemistry, Faculty of Natural Sciences, Comenius University, Mlynská dolina, SK-84215 Bratislava 4, Slovak Republic
2
Department of Physical Chemistry, Faculty of Sciences, P. J. Šafárik University in Košice, Moyzesova 11, SK-04154 Košice, Slovak Republic
3Institute of Material Research, Slovak Academy of Sciences, Košice, Slovak Republic 4
Department of Electrical and Electronic Technology, Faculty of Electrical Engineering and Communication, Brno University of Technology, Technická 10, CZ-61600 Brno, Czech Republic
*
E-mail: [email protected]
Received: 10 February 2014 / Accepted: 13 March 2014 / Published: 14 April 2014
In this paper we present the electrochemical study of self-assembled monolayer (SAM) created of aliphatic 1-hexadecanethiol (1-HDT) molecules adsorbed onto the gold and Au/Cr QCM crystal surfaces. We investigated the influence of 1-HDT concentration and scan rate on potential values for both adsorption and desorption processes. Our study introduces elimination voltammetry with linear scan (EVLS) as a new, improved and sufficient approach to study and characterize the SAM creation. Furthermore, formation of SAM was studied by cyclic voltammetry, electrochemical quartz crystal microbalance (QCM) and atomic force microscopy (AFM). Our study showed that the EVLS is suitable method for SAM study and gave detail information about the processes on the electrode surface. It was found that the adsorption of 1-HDT molecules on QCM crystal was more extensive than on Au electrode, i.e. molecules of 1-HDT molecules had better coverage on QCM crystal. The incomplete desorption of previously adsorbed 1-HDT from the electrode surface was observed by QCM measurements. AFM measurements confirmed that created SAM was homogenous without defects. The application of EVLS to the voltammetric signals resulted in significant increase of peak height and revealed a kinetically controlled reaction before an electron transfer proceeding in adsorbed state for oxidation processes corresponding to the 1-HDT monolayer adsorption and dithiol formation on both electrodes. A kinetically controlled reaction was detected also before the reductive desorption of previously adsorbed 1-HDT on both the electrodes.
Keywords: elimination voltammetry with linear scan; self-assembled monolayer; electrochemical
1. INTRODUCTION
Thiol monolayers on different substrates (especially on gold) are well known for their self-assembling properties. In recent years these systems have been studied with increasing attention. Gold, silver and glass are frequently used substrates. Thiol molecules are captured onto the surface of the substrate via the chemical bond between atoms of the substrate and thiol atom in alkanethiol. Hydrophobic alkyl chains interact between each other due the van der Waals interactions [1]. This property enables the chemisorption of alkylthiols on surface of substrate (metals, semiconductors), leading to the formation of monolayer. The monolayer created is called self-assembled monolayer (SAM). SAMs of thiols have been investigated from the 1980s of 20th century [2, 3] because of wide range of applications for those surfaces. Moreover, SAMs have good chemical and physical properties, they are stable against etching, they act as lithographic resists and can be modified with different functional groups (e.g. –COOH, –OH, –CH3, –CF3). According to the functional end group SAMs
could have potential technical usage in chemical and optical sensors. Most of the studies were related to layer consisting of aliphatic thiol. The electrochemical characteristics are drastically changed, when molecules of thiols are chemisorbed on the surface of the electrode. Electrochemical properties of modified electrodes surface also depend on the properties of organic moiety [4, 5]. The hydrocarbon chain length could modulate the physical and chemical properties of thiol SAMs created on the metal surface.
The process of adsorption/desorption has been investigated by many methods including electrochemical techniques [6-15], Fourier transform infrared spectroscopy (FT-IR) [16, 17, 18], electrochemical quartz crystal microbalance (EQCM) [19, 20, 21] and in situ scanning tunneling microscope (STM) [22-25].
One of the most important and used technique for studying the adsorption and desorption of SAM is the cyclic voltammetry (CV). This method gives information about the quality of the monolayer film. CV method was used for the characterization of the SAM dielectric properties on a gold quartz crystal surface. It was found that alkylthiols with longer alkyl chain have shifted reduction peak to the more negative potential. This is reflecting via the stronger van der Waals interactions between alkyl chains of thiol molecules [6]. The process of SAM desorption was initiated from the defects in thiol monolayer, i.e. missing rows and the edge of the vacancy islands. The desorbed molecules of alkylthiols formed aggregates in H2SO4 solution [25].
Widrig et al. [6] have described desorption of alkanethiol molecules from the gold surface to the alkaline aqueous solution as the one-electron reductive process given by the reaction:
SR e Au RS
Au (1)
It was carried out many electrochemical studies of the reaction (1). The peak area, the cathodic peak shape for the reductive desorption and peak potential provide useful information of the SAM, such as adsorbed amount, stability, adsorption energy, orientation and substrate morphology [6-25].
A detailed investigation of the reductive desorption and oxidative re-deposition of thiol SAMs confirmed that the peak potential for the reductive desorption is dependent on the hydrocarbon chain length, the functional end group, and the gold surface crystallography [17]. It was found, that the adsorbed layer of organic molecules were desorbed from the electrode surface via a poration process, or creation of defects in the adsorbed layer as the potential became more negative.
The aim of this paper is to study the adsorption/desorption process of SAM on gold surface by methods of cyclic voltammetry (CV), quartz crystal microbalance (QCM), atomic force microscopy (AFM) and elimination voltammetry with linear scan (EVLS). The surface of gold electrode and gold coated quartz crystal with a chromium under-layer (Au/Cr QCM crystal) was modified by aliphatic thiol molecules of 1-hexadecanethiol (1-HDT). The effect of substrate nature, scan rate and thiol concentration on the electrochemical adsorption/desorption of SAM was evaluated.
The adsorption/desorption process of SAM on Au electrode and Au/Cr QCM crystal was also investigated by EVLS, which is a technique developed for improving the voltammetric results through estimation of the effects of diffusion, kinetic and charging currents on the total measured current [27-32]. EVLS supplies more detailed information about the process on the electrode, including adsorption and structural changes of an electroactive species.
The present work is a fresh attempt to optimize the thiol SAM deposition parameters for the preparation of modified electrodes for detection of biological molecules.
2. EVLS PROCEDURE
The EVLS is a mathematical method for deeper interpretation of electrode processes. This method enables an improvement of the linear sweep voltammetry (LSV) or CV results by elimination of undesirable currents using the elimination functions, and makes it possible to identify the nature of the currents controlling the studied process 33. Comprehensive information about elimination functions and their calculations are described in papers [33-36]. The EVLS was verified experimentally for reversible, quasi-reversible, and irreversible electrochemical systems [35]. The application of EVLS to different electrochemical systems studied on mercury drop electrodes [37-42, 27 and solid electrodes [38-32] provided expansion of the available electrode potential range and higher sensitivity compared to LSV and CV, especially for adsorbed electroactive species, detected minor electrode processes hidden in a major one, and reveal competitive electrochemical reactions such as adsorption and kinetic processes.
respectively), on the scan rate 33-36, 27. The required elimination can be achieved by an elimination function obtained by the transformation of total voltammetric currents, measured at different scan rates, to a suitable linear combination.
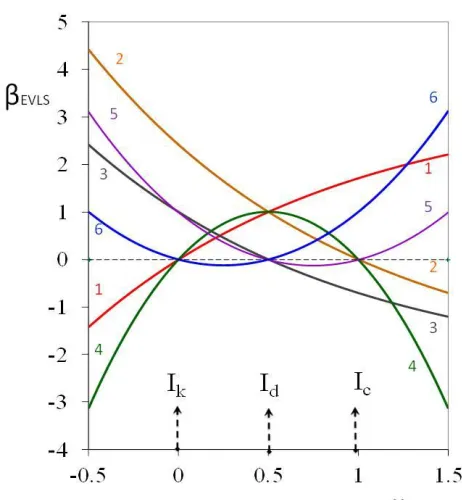
Figure 1. Dependence of current elimination coefficient βEVLS on scan rate coefficient x for six
elimination functions.
One of those scan rates is chosen as the reference scan rate, while the others are taken as fractions or multiples of the reference scan rate, usually half and twice the reference scan rate. The total current, corresponding to the reference scan rate, is denoted as the reference current (I) to whom all results are related 33. The linear combination is designated as elimination function, and its coefficients as linear elimination coefficients. The six elimination functions that ensure the elimination of unwanted particular currents and the conservation of desired particular currents were derived 33, 43:
E1: Elimination of Ik with Id conservation and Ic distortion by 1.707.
E2: Elimination of Ic with Id conservation and Ik distortion by 2.4142.
E3: Elimination of Id with Ik conservation and Ic distortion by -0.707.
E4: Simultaneous elimination of Ik and Ic with Id conservation.
E5: Simultaneous elimination of Ic and Id with Ik conservation.
E6: Simultaneous elimination of Id and Ik with Ic conservation.
For the partial current of any elimination function Ij, the current elimination coefficient, βEVLS is
[image:4.596.185.416.170.420.2]
x n
j ref
j j j
j EVlS
v v a I
I f
1
) (
(2) where aj in the sum means the coefficient of an elimination function, vjis arbitrary and vref is
reference scan rate. The dependence of the current elimination coefficient βEVLS on the scan rate
coefficient x is a suitable tool for the characterization of current nature and, consequently, for deeper insight into complex electrode processes [32, 33]. The courses of six derived elimination functions (E1 - E6) obtained using (1/2)vref, vref, and 2vref , are shown in Fig. 1. Whereas the current is well-preserved
for βEVLS = 1, the value of βEVLS = 0 corresponds to the elimination of a given partial current [34, 35].
It is appropriate to use inverted β-axis (i.e. negative values about zero) for better orientation in evaluation of reduction processes.
The graph is valid just for an electroactive material transported to a planar electrode by diffusion. E4 gives unique peak – counter peak [33, 37], in the case when the substance is adsorbed on the surface of the electrode before an electron transfer, making fast evidence of adsorption possible.
3. MATERIAL AND METHODS
All chemicals (1-hexadecanethiol, ethanol, KOH, K4[Fe(CN)6], NaCl and HNO3) used were
purchased from Alfa Aesar GmbH (Germany). They were of p.a. purity and solutions were freshly prepared. The chemicals were used without other purification.
Cyclic voltammetry measurements were performed by using an Autolab Potenstiostat PGSTAT 101 (Metrohm). All measurements were carried out by using a conventional three-electrode cell with Ag/AgCl/3 mol/l KCl reference electrode, platinum sheet counter electrode and gold electrode or Au/Cr QCM crystal as a working electrode. Before CV measurement crystal was immersed in a pure ethanol for 2 hours. Ag/AgCl/3 mol/l KCl, Pt and Au electrode were immersed in 25 vol. % HNO3 for
30 minutes and rinsed with distilled water and ethanol to clean. CV measurements were performed in 1 μmol/l, 10 μmol/l and 100 μmol/l 1-hexadecanthiol and 20 mmol/l KOH ethanol solution (pH 13.48) at different scan rates: 5; 10 and 20 mV/s. The potential was scanned from 0 mV → + 600 mV → - 600 mV → 0 mV for Au/Cr QCM crystal and from + 0 mV → + 1200 mV → - 1000 mV → 0 mV for Au electrode. The range of CV measurements for Au/Cr QCM crystal was reduced to avoid the crystal damage. All experiments were performed under atmospheric pressure and at room temperature. The surface area of Au/Cr QCM crystal was 4.15 cm2. Gold electrode was a traditional sheet electrode with surface area about 2 cm2.
QCM measurements were performed by using SRS MODEL QCM 200. Measurements were carried out by the same electrode system mentioned above. As working electrode was used Au/Cr QCM crystal with frequency 5 MHz. Crystal was immersed in a pure ethanol for 2 hours before measurements for cleaning.
The activity of gold electrode and Au/Cr QCM crystal surface was evaluated by CV in solution containing 1 mmol/l K4[Fe(CN)6] and 0,1 mol/l NaCl. The activity of the cleaned surface, the surface
molecules was investigated. The adsorption and desorption were carried out in 100 μmol/l 1-HDT 20 mmol/l KOH ethanolic solution by CV method in potential range 0 mV and 1000 mV at scan rate 10 mV/s.
QCM technique is based on relation between the frequency shift (Δf) of the quartz crystal resonator and changes of its mass per unit surface area (Δm), which is given by the following equation:
m C f f
(3)
Where Cf is the sensitivity factor (in our case his value is 56.6 Hz.µg-1.cm2). Eq. 3 was used to calculate the mass of the adsorbed 1-HDT molecules onto the Au/Cr QCM crystal surface.
AFM measurements were performed on VEECO ICON atomic force microscope. 1-HDT was electrochemically deposited from 10 μmol/l ethanolic KOH solution.
4. RESULTS AND DISCUSSION
4.1. CV study
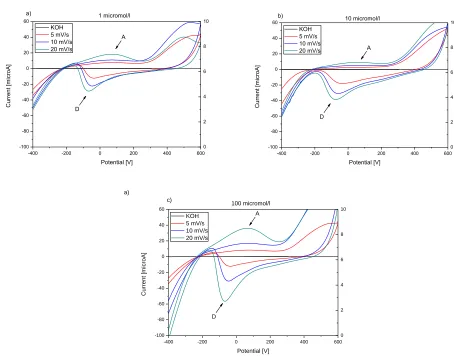
-400 -200 0 200 400 600 -100 -80 -60 -40 -20 0 20 40 60 KOH 5 mV/s 10 mV/s 20 mV/s
a) 1 micromol/l
C u rre n t [ mi cro A] Potential [V] D A 0 2 4 6 8 10
-400 -200 0 200 400 600 -100 -80 -60 -40 -20 0 20 40 60 KOH 5 mV/s 10 mV/s 20 mV/s 10 micromol/l C u rre n t [ mi cro A] Potential [V] D A 0 2 4 6 8 10 b)
[image:6.596.63.517.340.700.2]-400 -200 0 200 400 600 -100 -80 -60 -40 -20 0 20 40 60 KOH 5 mV/s 10 mV/s 20 mV/s c) 100 micromol/l C u rre n t [mi cro A] Potential [V] D A 0 2 4 6 8 10 a)
Figure 2. Cyclic voltammograms of 1 μmol/l (a), 10 μmol/l (b) and 100 μmol/l (c) 1-HDT recorded on
-200 -100 0 100 200 300 400 500 600 700 800 900 1000 1100 1200 -100
-50 0 50 100
150 a) 1 microM
C
u
rre
n
t
[mi
cro
A]
Potential [mV]
KOH 5 mV/s 10 mV/s 20 mV/s A
D
-200 -100 0 100 200 300 400 500 600 700 800 900 1000 1100 1200 -200
-150 -100 -50 0 50 100 150 200
KOH 5 mV/s 10 mV/s 20 mV/s
b) 10 microM
C
u
rre
n
t
[mi
cro
A]
Potential [mV] A
D
-200 -100 0 100 200 300 400 500 600 700 800 900 1000 1100 1200 -100
0 100
c) 100 microM
C
u
rre
n
t
[mi
cro
A]
Potential [mV] KOH
5 mV/s 10 mV/s 20 mV/s
A
[image:7.596.305.516.81.253.2]D
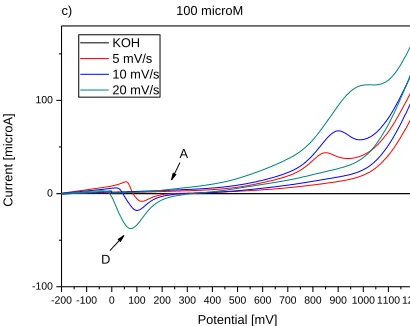
Figure 3. Cyclic voltammograms of 1 μmol/l (a), 10 μmol/l (b) and 100 μmol/l (c) 1-HDT recorded on
Au electrode at three different scan rates: 5 mV/s, 10 mV/s and 20 mV/s, and with 20 mmol/l KOH in ethanol.
Figure 2 and Figure 3 show the cyclic voltammograms of different concentrations of 1-HDT in 0.02 mol/l KOH ethanolic solution for Au/Cr QCM crystal and Au electrode. Cyclic voltammogram measurements for KOH ethanolic solution without thiol molecules show no oxidation or reduction peak. Neither an oxidative adsorption nor a reductive desorption process was registered in electrolyte without thiol molecules on both surfaces. The same results were obtained by other authors [46, 47].
[image:7.596.177.411.99.437.2] [image:7.596.189.394.276.439.2]
potential to the more positive/negative value was observed with increasing scan rate. Potential values of 1-HDT adsorption and desorption for Au/Cr QCM crystal are summarized in Table 1 and Table 2.
Table 1. Values of adsorption potentials determined from cyclic voltammograms of 1-HDT in
ethanolic KOH solution recorded at different scan rates and concentrations on Au/Cr QCM crystal and Au electrode
Eads [mV]
Au/Cr QCM crystal Gold electrode
conc 5 mV/s 10 mV/s 20 mV/s conc 5 mV/s 10 mV/s 20 mV/s
1 μmol/l 61.9 66.9 68.7 1 μmol/l 79.3 85.4 92.3
10 μmol/l 63.7 65.9 72.2 10 μmol/l 80.5 89.6 94.2
100 μmol/l 67.5 71.2 78.5 100 μmol/l 83.5 90.9 98.6
The cyclic voltammograms of different concentrations of 1-HDT in 0.02 mol/l KOH ethanolic solutions for Au electrode at three different scan rates are shown in Fig. 3. Two oxidation peaks observed at about 88 mV and 900 mV could be ascribed to the same processes as in case of QCM crystal. The reduction peak at potential about 100 mV was observed. Moreover, the re-adsorption of desorbed 1-HDT with the shift to negative potential was observed. The oxidation peaks at about 0 mV correspond to this re-adsortion process. Adsorption and desorption peak potentials were shifted to more positive values, as compared to Au/Cr crystal. The peak currents increase with increasing scan rate and increasing concentration was observed. Values of 1-HDT adsorption and desorption potentials for Au electrode are summarized in Table 1 and Table 2.
Table 2. Values of desorption potentials determined from cyclic voltammograms of 1-HDT in
ethanolic KOH solution recorded at different scan rates and concentrations on Au/Cr QCM crystal and Au electrode
Edes [mV]
Au/Cr QCM crystal Gold electrode
conc 5 mV/s 10 mV/s 20 mV/s conc 5 mV/s 10 mV/s 20 mV/s 1 μmol/l -34.3 -48.5 -69.9 1 μmol/l 120.3 117.9 100.6 10 μmol/l -36.6 -59.3 -73.1 10 μmol/l 110.5 90.1 83.1 100 μmol/l -38.0 -59.5 -74.2 100 μmol/l 141.7 74.5 71.9
corresponded with our results that with increased scan rate increased the measured current of adsorption and desorption peaks.
-200 -100 0 100 200 300 400 500 600 700 -200
-100 0 100 200 300 a)
gold/chrome after adsorption after desorption
C
urre
nt
[mi
cro
A]
Potential [mV]
0 200 400 600 800 1000 -200
-100 0 100 200 300 b)
gold after adsorption after desorption
C
u
rre
n
t [
mi
cro
A]
Potential [mV]
Figure 4. Cyclic voltammograms of 1 mmol/l K4[Fe(CN)6] in 0.1 mol/l NaCl solution measured
before electrochemical adsorption, after adsorption, and after desorption of 100 μmol/l 1-HDT in 20 mmol/l KOH ethanolic solution at 50 mV/s on Au/Cr crystal (a) and Au electrode (b).
The adsorption of thiol molecules on the electrode surface resulted in lowering of electrochemical activity of electrode surface. This could be observed on cyclic voltammograms of 1 mmol/l K4[Fe(CN)6] in 0.1 mol/l NaCl solution recorded before electrochemical adsorption, after
adsorption, and after desorption of adsorbed thiol molecules for 100 μmol/l 1-HDT in 20 mmol/l KOH ethanolic solution (Fig. 4). The potential was scanned from -100 mV to +600 mV and back to -100 mV and from 0 mV to +1000 mV and back to 0 mV for Au/Cr crystal and Au electrode, respectively. In comparison with clean surface, the activity of surface with adsorbed 1-HDT molecules decreased. After electrochemical desorption the activity increased again, but it was lower than the activity before the adsorption of thiol molecules indicating incomplete desorption of previously adsorbed 1-HDT from the surface. Comparing cyclic voltammograms recorded on Au/Cr crystal and Au electrode it can be observed that the lowering of peak current after adsorption was higher on the crystal surface, which reflects that the adsorption of 1-HDT molecules was more extensive, e.g. the coverage was larger, on QCM crystal than on Au electrode. These results indicate that the monolayer of 1-HDT formed on Au electrode surface was less consistent and adsorbed molecules were not able to block the electron transfer between the electrode surface and solution effectively.
[image:9.596.69.511.116.268.2]
4.2. QCM study
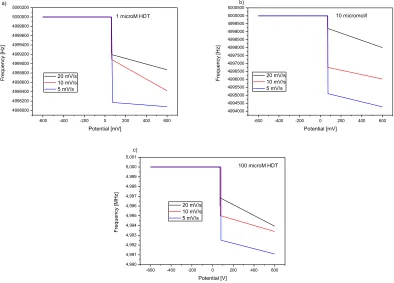
The electrochemical adsorption/desorption process was further confirmed with the QCM frequency change measurements. The frequency-potential response curves of adsorption and desorption of 1-HDT recorded on Au/Cr QCM crystal for different scan rates are shown in Fig. 5 and Fig. 6, respectively. The adsorption of 1-HDT on Au/Cr crystal was associated with the frequency decrease corresponding to the mass increase on crystal surface. The decrease in resonance frequency of crystal was observed at potential close to the oxidation peak potential in cyclic voltammograms in Fig. 2 (summarized in the Table 1), at which the 1-hexadecanthiol started to adsorb on the Au/Cr surface (Fig. 5). The potential values differed for each scan rate. For each concentration of 1-HDT the adsorption potential increased with increasing scan rate. The frequency of crystal increased and mass of adsorbed molecules decreased with increasing scan rate for all measured concentrations.
-600 -400 -200 0 200 400 600
4998000 4998200 4998400 4998600 4998800 4999000 4999200 4999400 4999600 4999800 5000000 5000200
1 microM HDT
20 mV/s 10 mV/s 5 mV/s F re q u e n cy [H z] Potential [mV] a)
-600 -400 -200 0 200 400 600
4994000 4994500 4995000 4995500 4996000 4996500 4997000 4997500 4998000 4998500 4999000 4999500 5000000 5000500b) 10 micromol/l 20 mV/s 10 mV/s 5 mV/s F re q u e n cy [H z] Potential [mV]
-600 -400 -200 0 200 400 600
4,990 4,991 4,992 4,993 4,994 4,995 4,996 4,997 4,998 4,999 5,000 5,001 c)
100 microM HDT
F re q u e n cy [MH z] Potential [V] 20 mV/s 10 mV/s 5 mV/s
Figure 5. The frequency-potential response curves of adsorption of 1 μmol/l (a), 10 μmol/l (b) and
100 μmol/l (c) 1-HDT recorded on Au/Cr QCM crystal for different scan rates: 5 mV/s, 10 mV/s and 20 mV/s.
[image:10.596.90.484.295.578.2]
Table 3 The values of adsorption potentials and corresponding frequencies, and mass changes of
adsorbed 1-HDT molecules from QCM measurements.
1 μmol/l 1-HDT 10 μmol/l 1-HDT 100 μmol/l 1-HDT
Scan rate [mV/s] Eadsorption [mV] ∆ f [Hz] ∆ m [μg] Eadsorption [mV] ∆ f [Hz] ∆ m [μg] Eadsorption [mV] ∆ f [Hz] ∆ m [μg]
5 61.5 -1920 33.9 70.4 -5730 101.2 72.3 -9010 159.2
10 64.1 -1170 20.7 71.9 -3980 70.3 74.2 -6667 117.8
20 70.8 -1160 20.5 76.1 -2000 35.3 81.0 -5829 103.0
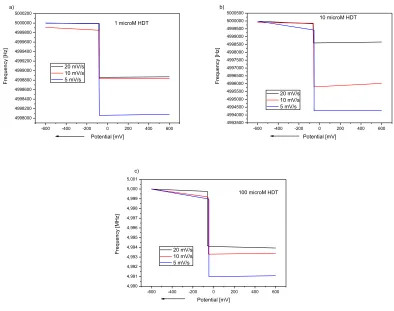
The increase of crystal resonance frequency at potentials corresponding to the desorption potentials in cyclic voltammograms (Fig. 2) was registered with potential shift to negative values (Fig. 6). At this potential previously adsorbed 1-HDT molecules were released from the crystal surface to the alkaline solution resulting in the decrease of crystal mass. The amount of desorbed molecules and frequency changes of the crystal together with desorption potentials determined from QCM measurements are summarized in Table 4.
-600 -400 -200 0 200 400 600
4998000 4998200 4998400 4998600 4998800 4999000 4999200 4999400 4999600 4999800 5000000 5000200 a)
1 microM HDT
20 mV/s 10 mV/s 5 mV/s F re q u e n cy [H z] Potential [mV]
-600 -400 -200 0 200 400 600
4993500 4994000 4994500 4995000 4995500 4996000 4996500 4997000 4997500 4998000 4998500 4999000 4999500 5000000 5000500 b)
10 microM HDT
20 mV/s 10 mV/s 5 mV/s F re q u e n cy [H z] Potential [mV]
-600 -400 -200 0 200 400 600
4,990 4,991 4,992 4,993 4,994 4,995 4,996 4,997 4,998 4,999 5,000 5,001
100 microM HDT
20 mV/s 10 mV/s 5 mV/s F re q u e n cy [MH z] Potential [mV] c)
Figure 6. The frequency-potential response curves of desorption of 1 μmol/l (a), 10 μmol/l (b) and
[image:11.596.43.539.110.224.2] [image:11.596.89.483.385.696.2]
Table 4 The values of desorption potentials of adsorbed 1-HDT molecules from QCM measurements.
1 μmol/l 1-HDT 10 μmol/l 1-HDT 100 μmol/l 1-HDT
Scan rate [mV/s]
Edesorption
[mV]
∆ f [Hz] ∆ m [μg]
Edesorption
[mV]
∆ f [Hz] ∆ m [μg]
Edesorption
[mV]
∆ f [Hz] ∆ m [μg]
5 -78.5 1390 24.6 -53.8 5150 90.9 -45.0 7949 140.5
10 -80.2 1130 20.0 -57.7 3880 68.5 -51.2 5767 101.9
20 -85.4 1020 18.0 -64.4 1220 21.6 -59.9 5584 98.7
Comparing the masses of adsorbed and desorbed 1-HDT molecules it can be concluded that not all molecules adsorbed were desorbed from the crystal surface. The amount of desorbed 1-HDT molecules corresponded to about 87 % of previously adsorbed molecules.
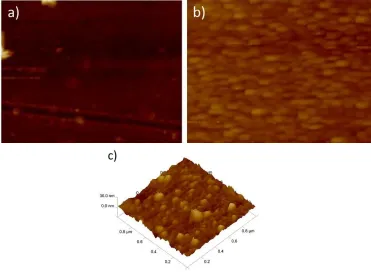
4.3. AFM study
Figure 7. AFM topography of a) pure Au/Cr QCM crystal surface, b) HDT covered Au/Cr QCM
crystal surface and c) topography profile.
[image:12.596.113.484.346.625.2]
QCM crystal surface coated with SAM of 1-HDT molecules, respectively. Molecules of 1-HDT were well ordered on the surface and formed continuous layer. This was also confirmed by topography profile of the Au/Cr QCM crystal surface coated with SAM of 1-HDT molecules (Fig 7c).
The Fig. 7a shows clean surface of Au/Cr crystal before measurements. The surface is smooth without any defects. Therefore all thiol molecules have the same probability to adsorb at any place on the surface. The Fig. 7b shows the Au/Cr crystal after electrochemical adsorption. As it is seen from the topography profile (Fig. 7c) of the surface, thiol molecules are oriented not at the same way. Therefore the molecules had not enough time to orient themselves due the van der Waals interaction between molecules and the height of the surface is changing, as it is shown in topography profile of the surface (Fig. 7c).
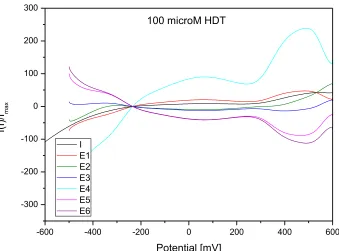
4.4. EVLS study
-600 -400 -200 0 200 400 600 -300
-200 -100 0 100 200 300
100 microM HDT
I E1 E2 E3 E4 E5 E6
f(I
)/
I ma
x
Potential [mV]
Figure 8. Elimination voltammogram of 1-HDT on Au/Cr QCM crystal, 100 μmol/l, process of
adsorption, reference scan rate 10 mV/s.
[image:13.596.118.457.322.573.2]
-0,6 -0,4 -0,2 0,0 0,2 0,4 0,6 0,8 1,0 1,2
-0,0002 -0,0001 0,0000 0,0001
0,0002 100 microM
Iref E1 E2 E3 E4 E5 E6
f(I
)/
Ima
x
Potential [V]
-0,2 0,0 0,2 0,4 0,6
-0,00002 0,00000 0,00002
f(I
)/
Im
ax
Potential [V]
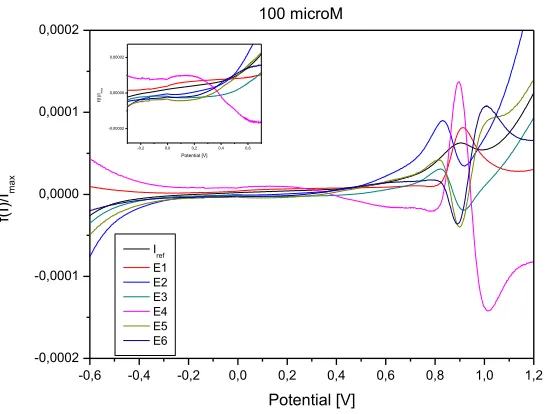
Figure 9. Elimination voltammogram of 1-HDT on gold electrode surface, 100 μmol/l, process of
adsorption, reference scan rate 10 mV/s.
In Figures 8 and 9 are shown the elimination and reference curves of oxidation processes corresponding to the 1-HDT monolayer adsorption and dithiol formation measured on Au/Cr QCM crystal and gold electrode.
The application of elimination functions E1 – E6 to the oxidation process of 1-HDT on Au/Cr crystal and Au electrode confirmed a kinetically controlled reaction at potential of first oxidation peak (about 70 mV and 90 mV on Au/Cr crystal and Au electrode, respectively). This can be seen from the increase of elimination functions E1 and E4 together with the opposite course of all other elimination functions.
Detected kinetic process on the electrode surface can be associated with chemical reaction and with arrangement of thiol molecules on the charged interface. The kinetically controlled surface process is slower than the electron transfer reaction but faster than diffusion of 1-HDT molecules. The cathodic EVLS signal for Au electrode in the region of about 150 mV (Fig. 9) is not clearly visible on the CV curve (Fig. 3), but a comparison of the courses of all elimination curves (E1 –E6) confirms a kinetic and/or super-kinetic domain. The process at these potentials can correspond to surface kinetics as a rate determining step (RDS).
[image:14.596.149.422.82.289.2]
function E4. The parallel course of elimination functions E2 and E3 to negative values of EVLS, which
is opposite to course of elimination function E1, indicates the dominance of charging process, and therefore the right part of the theoretical diagram (Fig. 1) must be taken in consideration. This is more evident in the case of Au electrode.
From these results it can be concluded that the adsorption of thiol molecules on the electrode surface is accompanied by electrochemical oxidation reaction of metallic electrode together with a metal-sulfur bond formation and followed by dithiol formation.
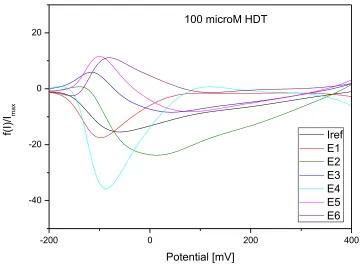
In Figures 10 and 11 are shown the elimination and reference curves of desorption measured on Au/Cr QCM crystal and gold electrode surface. The application of elimination functions E1 – E6 to the reduction process of 1-HDT confirm that desorption is preceded by a kinetically controlled reaction on both the electrodes. We assumed that the minor kinetic process could be related to different strength of metal-S bond on Au/Cr crystal and Au electrode or to the re-arrangement of adsorbed thiol molecules. The parallel course of functions E1 and E4, both to positive and negative values of EVLS, indicates that
the process on Au/Cr QCM crystal is controlled by kinetics and diffusion, and therefore the left part of the theoretical diagram (Fig. 1) must be considered. On the Au/Cr QCM crystal prevailed the process of diffusion of 1-HDT molecules from the crystal surface.
-200 0 200 400
-40 -20 0 20
100 microM HDT
Iref E1 E2 E3 E4 E5 E6
f(I
)/
I ma
x
Potential [mV]
Figure 10. Elimination voltammogram of 1-HDT on Au/Cr QCM crystal, 100 μmol/l, process of
[image:15.596.107.467.391.656.2]
-200 -100 0 100 200
-100 0 100
100 microM HDT Iref
E1 E2 E3 E4 E5 E6
f(I
)/
I ma
x
Potential [mV]
Figure 11. Elimination voltammogram of 1-HDT on Au/Cr QCM crystal, 100 μmol/l, process of
desorption, reference scan rate 10 mV/s.
The application of EVLS on the CV on Au electrode revealed the electron transfer in adsorbed state indicating that the reaction (1) is slowest reaction step in desorption process of 1-HDT molecules.
Dias et al [48] studied the electrochemical adsorption and desorption processes of ethanethiol onto the gold electrode surface in alkaline solution. They observed the mechanism of thiol adsorption in next steps:
1) the oxidation of gold to the gold-thiolate:
RS Au SR e
Au (5)
2) the oxidation of dissolved ethanethiol to dithiol:
e S
R
RS diss diss 2
2 ( ) 2 2( )
(6)
3) the oxidation of gold-thiolate to dithiol and formation of “gold hydroxide” layer:
SR OH AuOH R S e
Au 2 2 diss 2
2 2 2( )
(7) 4) the reduction of the formed “gold hydroxide” to gold:
e Au OH
AuOH (8)
5) the reductive desorption of thiol on gold:
SR e Au RS
Au (1)
[image:16.596.113.459.100.352.2]
arrangement of thiol molecules on the charged interface and followed with reaction (6). The reductive desorption is associated with reaction (1).
5. CONCLUSIONS
We studied the process of adsorption/desorption of 1-HDT onto Au/Cr QCM crystal and gold surfaces from KOH in ethanolic solution. We observed that at the potential of adsorption the molecules were very quickly adsorbed onto the surface, what was confirmed the QCM measurements. At the adsorption potential the frequency of the crystal rapidly decreased, what meant the increasing of the crystal mass. These results were confirmed also by EVLS and AFM measurements. In AFM images it was clearly seen, that the monolayer consisting of 1-HDT molecules is well ordered. The monolayer creation was confirmed with the activity of Fe2+/Fe3+ cation that decreased using gold or Au/Cr QCM crystal surface with adsorbed molecules. The formed monolayer of 1-HDT was not able to block the electron transfer between the electrode surface and solution completely. The activity of cation increased after desorption of 1-HDT molecules again. . However, about 87 % of previously adsorbed 1-HDT was desorbed from the electrode surface. The higher extension of 1-HDT adsorption on QCM crystal surface than on Au electrode was detected. EVLS measurements showed that adsorption of thiol molecules on the electrode surface is preceded by a kinetically controlled reaction and followed by electron transfer and metal-sulfur bond formation. Furthermore EVLS measurements showed that the process of desorption was kinetically controlled on gold electrode while on Au/Cr QCM crystal it was controlled by kinetics and diffusion.
ACKNOWLEDGEMENT
The authors wish to acknowledge financial support from the Grant Agency of the Ministry of Education of the Slovak Republic (Project No. 1/0211/12), Brno University of Technology (Project No. CZ.1.07/2.3.00/30.0039), and Slovak Research and Development Agency (Project No. APVV SK-CZ-0113-11).
References
1. Ch. A. Canaria, J. So, J. R. Maloney, C. J. Yu, J. O. Smith, M. L. Roukes, E. S. Fraser and R. Lansford, Lab Chip, 6 (2006) 289
2. Y. Sato, B.L. Frey, R.M. Corn and K. Uosaki, Bull. Chem. Soc. Jpn., 67 (1994) 21 3. F. Bensebaa, R. Voicu, L. Huron, T.H. Ellis and E. Kruus, Langmuir, 13 (1997) 5335 4. K. Shimazu, I. Yagi, Y. Sato and K. Uosaki, Langmuir, 8 (1992) 1385
5. D.S. Karpovich and G.J. Blanchard, Langmuir, 10 (1994) 3315
6. C.A. Widrig, C. Chung and M.D. Porter, J. Electroanal. Chem., 310 (1991) 335 7. T. Kondo, T. Sumi and K. Uosaki, J. Electroanal. Chem., in press
8. M.M. Walczak, D.D. Popenoe, R.S. Deinhammer, B.D. Lamp, C. Chung and M.D. Porter, Langmuir, 7 (1991) 2687
9. M.M. Walczak, C.A. Alves, B.D. Lamp, M.D. Porter,J. Electroanal. Chem., 396 (1995) 103 10.C.-J. Zhong, J. Zak, M.D. Porter, The Voltammetric Desorption Characteristics of Alkanethiolate
11.C.-J. Zhong and M.D. Porter, J. Electroanal. Chem., 425 (1997) 147 12.D.-F. Yang, C.P. Wilde and M. Morin, Langmuir, 12 (1996) 6570 13.D.-F. Yang, C.P. Wilde and M. Morin, Langmuir, 13 (1997) 243 14.D.-F. Yang and M. Morin, J. Electroanal. Chem., 429 (1997) 1 15.D.-F. Yang and M. Morin, J. Electroanal. Chem., 441 (1998) 173
16.D.-F. Yang, H. Al-Maznai and M. Morin, J. Phys. Chem. B, 101 (1997) 1158 17.M. Byloos, H. Al-Maznai and M. Morin, J. Phys. Chem. B, 103 (1999) 6554 18.M. Byloos, H. Al-Maznai and M. Morin, J. Phys. Chem. B, 105 (2001) 5900 19.T.W. Schneider and D.A. Buttry, J. Am. Chem. Soc., 115 (1993) 12391
20.T. Kawaguchi, H. Yasuda, K Shimazu and M.D. Porter, Langmuir, 16 (2000) 9830 21.D. Qu and M. Morin, J. Electroanal. Chem., 517 (2001) 45
22.D. Hobara, K. Miyake, S. Imabayashi, K. Niki and T. Kakiuchi, Langmuir, 14 (1998) 3590 23.D. Hobara, M. Yamamoto and T. Kakiuchi, Chem. Lett., (2001) 374
24.C. Vericat, G. Andreasen, M.E. Vela, H. Martin and R.C. Salvarezza, J. Chem. Phys., 115 (2001) 6672
25.H. Wano and K. Uosaki, Langmuir, 17 (2001) 8224
26.C. D. Bain, H. A. Biebuyck and G. M. Whitesides, Langmuir, 5 (1989) 723
27.F. Jelen, A. Kourilova, S. Hason, R. Kizek and L. Trnkova, Electroanalysis, 21 (2009) 439 28.L. Trnkova, Talanta, 56 (2002) 887
29.R. Orinakova, L. Trnkova, M. Galova and M. Supicova, Electrochim. Acta, 49 (2004) 3587 30.M. Supicova, R. Rozik, L. Trnkova, R. Orinakova and M. Galova, J. Solid State Electrochem., 10
(2006) 61
31.R. Orinakova, M. Streckova, L. Trnkova, R. Rozik and M. Galova, J. Electroanal. Chem., 594 (2006) 152
32.R. Rozik and L. Trnkova, J. Electroanal. Chem., 593 (2006) 247 33.L. Trnkova, J Electroanal. Chem., 582 (2005) 258
34.O. Dracka, J. Electroanal. Chem., 402 (1996) 19
35.L. Trnkova and O. Dracka, J. Electroanal. Chem., 413 (1996) 123 36.L. Trnkova, Chem. Listy, 95 (2001) 518
37.L. Trnkova, R. Kizek and O. Dracka, Electroanalysis, 12 (2000) 905 38.L. Trnkova J. Friml and O. Dracka, Bioelectrochemistry, 54 (2001) 131 39.L. Trnkova, F. Jelen and I. Postbieglova, Electroanalysis, 15 (2003) 1529 40.S. Sander, T. Navratil and L. Novotny, Electroanalysis, 15 (2003) 1513
41.R. Fadrna, B. Yosypchuk, M. Fojta, T. Navratil and L. Novotny, Anal. Lett., 37 (2005) 399 42.I. Sestakova and T. Navratil, Bioorg. Chem. Appl., 3 (2005) 43
43.J. Galandova, L. Trnkova, R. Mikelova, and J. Labuda, Electroanalysis, 21 (2009) 563
44.L. Trnkova, L. Novotny, N. Serrano, K. Klosova and P. Polaskova, Electroanalysis, 22 (2010) 1873
45.S. Dong and J. Li, Bioelectrochem. Bioenerg., 42 (1997) 7 46.K. Uosaki, Chem. Rec., 9 (2009) 199
47.Z. Dursun, S. Ulubay Karabiberoglu, B. Gelmez and A. Basaran, Turk. J. Chem., 35 (2011) 349 48.D. Dias, U. Hasse, K. Fricke, P. C. Nascimento and F. Scholz, J. Electroanal. Chem., 690 (2013)
121
49.S. Menolasina, Ciencia, 11 (2003) 87
![Figure 4. Cyclic voltammograms of 1 mmol/l K4[Fe(CN)6] in 0.1 mol/l NaCl solution measured before electrochemical adsorption, after adsorption, and after desorption of 100 μmol/l 1-HDT in 20 mmol/l KOH ethanolic solution at 50 mV/s on Au/Cr crystal (a) and](https://thumb-us.123doks.com/thumbv2/123dok_us/1899054.147878/9.596.69.511.116.268/voltammograms-solution-electrochemical-adsorption-adsorption-desorption-ethanolic-solution.webp)