Coordinating On-ramp Queue Control with Adjacent
Local Signal Controller
[An algorithm to assist ramp metering application]
Proc. of the 13th World Congress on ITS London, UK. 2006
Dr. B. Sultan*, Dr. J. Piao+ and Prof. M. McDonald#
Transportation Research Group (TRG), School of Civil Engineering and the Environment, University of Southampton, Southampton SO17 1BJ, U.K.
Tel: *++ 44 (0)23 80593148, #+ 44 (0)23 80592192 Fax: +44 (0)23 80593152
ABSTRACT
This paper describes a queue control algorithm which is able to coordinate its operation with that of an adjacent local signal control so that its efficiency is improved. A microscopic simulation model (AIMSUN) was used to test the operation of the new queue control algorithm and compare its performance with that of the standard queue control. The assessment has shown the new algorithm to be a significant improvement in reducing the variation of the release rate and the frequency of exceeding the storage capacity whilst the efficiency of utilising ramp space increased. Also, the new algorithm was found to be less sensitive to changes in ramp demand and some parameter settings originally found critical to the operation of standard queue control.
INTRODUCTION
Ramp Metering is a traffic management and control application which regulates on-ramp flow at a merging section so that the overall downstream throughput could be improved. The increase in traffic demand has made congestion a daily event on many motorways particularly those used as corridor ring-roads around large metropolitan areas. Consequently, ramp metering has become one of the attractive remedy measures to improve the level of service.
Over the last decade, quite rightly, most metering algorithms have focused on developing algorithms which focus on monitoring the traffic condition of the main carriageway at a merging section to calculate the metering release rate. However, preventing on-ramp queues generated by a ramp metering application from intervening with the operation of local traffic becomes a necessity when the motorway network is managed by an organizational body independent from the one responsible for managing the adjacent local networks. For example in the UK, the Highway Agency is the main organisation responsible for managing motorways in England and Wales whilst the adjacent local network is managed by local urban control centres administrated by the relevant local county council. Queue override, which is described as an unrestricted opening to the ramp for a limited period of time, had been traditionally considered as the main relief remedy for an excessive on-ramp queue. A queue override event would be initiated whenever the occupancy of a specific set of on-ramp traffic detectors, located upstream of the ramp storage space, exceeded a preset threshold (e.g. [1] & [3]). However, as large numbers of vehicles merge at the same time during a queue override event, a short-term shockwave upstream of the merging section would be created. The problem is accumulated when queue override becomes a frequent event due to high ramp demand, and ill management of on-ramp queues. This may lead to ramp metering having a negative impact [5].
such approach would be useful to minimise on-ramp delay when ramps have a large storage space, the algorithm would be slow to respond and reduce the time duration of excessive queuing when the ramp storage space is limited. The impact of the previous queue control algorithm on the zone metering algorithm (used by the Minnesota DOT) was investigated by using microscopic simulation. The results reported pointed to a significant reduction in on-ramp delays but at the expense of reducing the benefit of ramp metering for mainstream traffic.
In order to overcome the disadvantage of queue override policy a new queue control algorithm was suggested by Smaragdis and Papageorgiou in 2003 [4]. The algorithm suggested used both estimated ramp demand and on-ramp queue length to calculate the minimum release rate. Whilst standard assessment showed the new algorithm to give an advantage over a traditional queue override policy when ramp demand is not very high [6], the algorithm lacked the ability to address two main issues. They are:
1- Reliable demand estimation and the ability to compensate for errors arose when queues reach the most upstream loop detectors on the ramp.
2- Demand variability due to the existence of an adjacent signalised intersection upstream of the ramp.
The EC EURAMP project aims at enhancing, developing and implementing new ramp metering algorithms to increase the efficiently of local metering applications, network wide coordination and the integration with local network management. To enable coordination between the queue control and the adjacent local signal controller, the algorithm suggested by Smaragdis and Papageorgiou was developed by adapting a new approach for demand estimation and synchronisation with adjacent local signal. This paper presents a technical assessment by using a microscopic simulation model to compare between the new (coordinated) and standard queue control algorithm (standard).
ALGORITHMS’ DESCRIPTION
Standard Control Algorithm
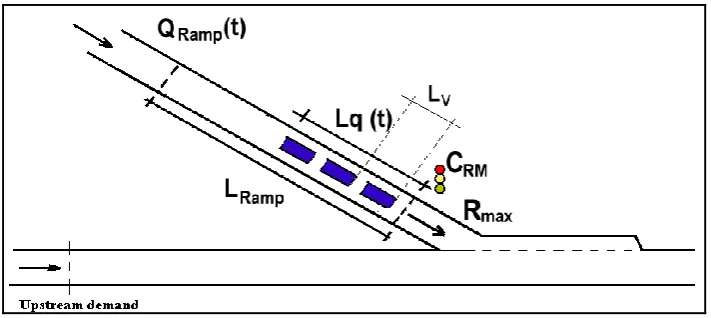
A setup of a generic isolated ramp metering site is presented in Figure 1 where the ramp flow is controlled with a traffic signal which regulates the traffic according to a certain algorithm. When mainstream demand becomes close to the bottleneck capacity, most metering strategies will result in a strong restriction to the merging traffic so that on-ramp queues build up quickly. The control algorithm as suggested by Smaragdis [4] aimed to prevent the on-ramp queues from exceeding the maximum storage space by calculating the ramp released flow from the following equation:
RM V
q Ramp
Ramp
C * L
) t ( L RSP L
* N * )
t ( EQ ) t (
R 3600 …(1)
Figure 1: A diagram showing the general variables and parameters of a metered ramp. Equation (1) shows the algorithm to have three parameters for performance tuning (i.e. RSP, LV & CRM), whilst to function properly two main inputs are required at the beginning
of each cycle. (i) The queue length (Lq (t)) which could be estimated by deferential
counting between upstream and downstream detectors on the ramp or by direct measurement by recent technologies such as VIP (video imaging processing) sensors [6]. (ii) The ramp demand (QRamp(t)) which is unknown and could only be estimated by using
vehicle counts upstream of the ramp.
Coordinated Control Algorithm
As described in the previous section the standard queue control algorithm required a reliable formula to estimate demand. Also if a signalised intersection existed upstream of the ramp, then high and low ramp demand levels could be observed depending on the phases of the signalised intersection. Therefore a new formula to estimate demand in addition to an approach for coordination with the operation of the adjacent signal control have been suggested.
Formula for estimating demand
Although Smaragdis [7] suggested the use of the last measured on-ramp flow as an estimated demand [EQ(t) = Q(t-1)], it was acknowledged that other formula might give better results. The previous formula had three main weaknesses. They are:
1) It lacks the flexibility to compensate for recent high demand. 2) It does not offer any parameters for calibration or tuning.
3) It is unable to compensate for flow error when queues reach the upstream vehicle count detectors.
Consequently, the following formula was suggested:
) t ( Q * K
) Q _ STD Q
_ Mean * K ( Max )
t ( EQ
1 1
1
…(2)
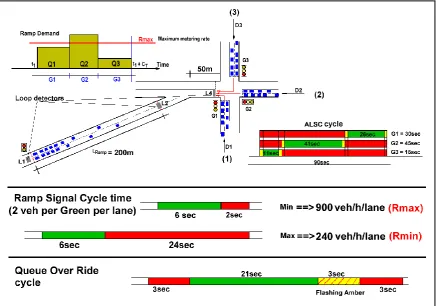
Ramp metering signals usually operate in a different way to that of a normal intersection traffic signal. Green time is fixed to allow a specific number of vehicles to enter the motorway (normally 1 to 2 vehicles), whilst the duration of red time will vary according to the calculated release rate. For example a cycle of 2sec red, 1sec amber, 2sec green and 1sec amber will result in a release rate of 600veh/h/lane when one vehicle per green is assumed. Whilst a cycle of 20sec red, 1sec amber, 2sec green and 1sec amber will result in a release rate of 150veh/h/lane. Consequently, a metering signal will have a minimum and maximum release rate depending on the duration of the maximum and minimum of red time respectively. In normal circumstances where on-ramp queues do not reach the on-ramp upstream detector, the minimum release rate will be linked to the metering cycle time. However, when queues reach the on-ramp upstream detector, the demand estimation formula presented in (2) does not compensate for the errors in vehicle counting. In such circumstances, the minimum release rate will be adjusted to compensate for error in vehicle counts by applying the following formula:
max min min R ) t ( EQ * K ) t ( R Min ) t (
R 1 4 …(3)
Where: Rmin is minimum vehicle release rate (veh/h). K4 is a calibration factor which was found to give best results when it is equal to 1.9.
To identify whether or not the on-ramp queues have reached the upstream detector both the estimated queue length and detectors occupancy threshold are used. The estimated queue length is calculated by deferential counting between upstream and downstream detectors on the ramp and an assumed average space occupied by a stationary vehicle (LV).
The occupancy threshold of the upstream detector could be identified by observing the occupancy levels when queues exist over the detectors. In the case where the algorithm was unable to keep the ramp queue within the ramp boundaries for 1.5minute, then a queue override event would be activated during which the ramp is opened for a continuous 24sec followed by 6sec of red signal.
Coordination with adjacent local signal control
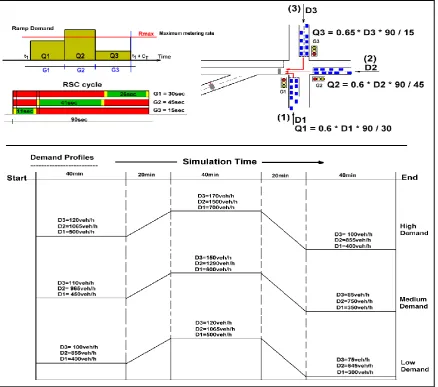
A critical issue for coordinating between the queue control algorithm and the adjacent local signal control (ALSC) is to address the issue of cycle time differences and demand variation. Due to the difference in the natures of the queue control and the ALSC, the cycle of the later is expected to be much longer than the former. However to achieve full coordination between the two systems, individual phases of the adjacent local signal control have to be of a multiple number of queue control cycles. If on-ramp demand varies according to ALSC phases, the algorithm should estimate ramp demand on phase basis and adjust its release rate to create a sufficient on-ramp storage space to accommodate the extra traffic (if any) during the following phase. To meet the previous requirement the following equation is suggested:
) i ( UR G * L ) i ( L ) i ( S RSP L * N * ) i ( EQ ) i ( R Ac i V q Ramp 1 1 3600 … (4)
unreleased flow due to overwhelming demand during the previous phase (i-1) [veh/h]. R(i) is the calculated ramp release rate at the beginning of phase (i).
The estimated storage space on the ramp required to accommodate demand during a specific phase could be calculated by the following equation:
N * L * G * ) R ) i ( EQ ( ) i (
S i V
max
3600
& [(LRamp –RSP) Si 0] … (5)
The equations (2) & (3) will be used to estimate ramp demand and performed on a phase basis. At some irregular periods due to excessive discharge of traffic, ramp demand could overwhelm the queue control algorithm. During such circumstances, the algorithm compensates for the unreleased demand by increasing the release rate during the following phase by the amount described in the following equation:
0 1 1 1 i i max i Ac G G * ) R R ( max ) i (
UR … (6)
In order to smooth the calculated ramp release between the various phases, the calculated release rate (4) should not be less than the release rate which is calculated based on average ramp demand during a complete ALSC cycle. Such criteria could be explained by the following inequality:
T V q Ramp T Ramp C * L ) T ( L RSP L * N * ) C ( EQ ) i (R 3600 … (7)
Where: CT is the ALSC cycle time [sec]. T is the discrete time index (0, 1, 2, 3, etc.) where the difference between two successive time steps is the ALSC cycle time CT [sec]. Lq(T) is the on-ramp queue length at step (T) [m]. EQRamp(CT) is the estimated on-ramp upstream demand over the whole duration of ALSC cycle time (CT) [veh/h].
The above algorithm assumes that the ALSC has a fixed cycle time and the duration of each of its phases is a multiple integer of the ramp metering cycle time. Also, it is assumed that if a queue is released, there will not be a queue backup from the merging section. In reality, such assumptions may not be true. A dynamic link would need to be established between the ALSC and the queue control algorithm to feed into information related to the start and end of ALSC phases. The assessment in this paper has focused on a static link between queue control and ALSC and it is anticipated that the assessment results would not be significantly different if a dynamic link was performed.
EXPERIMENTAL DESIGN
model a virtual test site resembling a signalised intersection leading to an on-ramp as described in Figure 2.
queue control algorithm (15 and 30sec) and two RSP settings were tested (10 and 25m) for both the coordinated and standard queue control algorithm.
To meet the objective of the assessment, a set of indicators were identified for the analyses. They are:
1- The number of events when the ramp queue exceeded the maximum storage space (Q_E_S). To enable the comparison between 30sec and 15sec cycle times the Q_E_S events were assessed every 15 seconds for all test scenarios including those with 30sec cycle-time.
2- The number of times a queue override is activated (Q_O_R).
3- The time duration when ramp queues affected the operation of the adjacent local signal controller
4- The average distance between the queue tail and the upstream end of the ramp (AV_DS). This distance is considered positive if the queue is shorter than the ramp and negative if longer then the ramp.
5- The STD of distance between the queue tail and the upstream end of the ramp (STD_DS). This distance is considered positive if the queue is shorter than the ramp and negative, if longer then the ramp
Figure 3: The simulated demand profiles used for the assessment.
RESULTS AND DISCUSSION
As described in the previous section, five indicators were used to assess the performance of queue control. A summary of results showing the values of all assessment indicators with the various test scenarios is presented in Table 1.
Low dem Mid dem High dem Low dem Mid dem High dem
15s 63 93 112 46 83 108
30s 36 48 58 22 40 51
Enhanced queue control 15s 9 9 9 1 0 0
15s 50 17 22 4 10 15
30s 12 16 20 11 16 19
Enhanced queue control 15s 0 0 0 0 0 0
15s 0 0 0 0 0 0
30s 0 0 0 0 0 0
Enhanced queue control 15s 0 0 0 0 0 0
15s 68 76 76 38 46 54
30s 74 78 79 66 75 77
Enhanced queue control 15s 36 44 56 50 59 71
15s 59 63 63 35 50 58
30s 69 71 73 67 70 72
Enhanced queue control 15s 20 31 42 18 29 39
Number of times exceeding the max storage capacity (Q_E_S)
Number of times of applying queue override activated (Q_O_R)
The everage of the difference between ramp length and on-ramp queue length (AV_DS), (m)
Initial queue control
Initial queue control
Initial queue control
Initial queue control
The duration of time when ramp queues affected the operation of adjacent local signal controller
Initial queue control
The standard deviation of the difference between ramp length and on-ramp queue length (STD_DS), (m)
RSP = 10m RSP = 25m Up-dating
interval Algorithms
[image:9.595.93.515.573.741.2]Although both algorithms prevented on-ramp queues from extending back to the intersection and interfering with its operation, the coordinated model performed significantly better than the standard model.
A significant decrease in the number of Q_E_S (on-ramp queues exceeding the storage capacity) and Q_O_R (queue override) events was observed when the coordinated control was used instead of the standard queue control. The results of the Q_E_S and the Q_O_R for both algorithms and under various test scenarios are presented in Figure 4. Clearly, the coordinated control was very efficient in preventing the occurrence of Q_O_R events and keeping the number of Q_E_S events very low. The standard algorithm was found to be sensitive to both demand and the RSP as the number of Q_O_R and Q_E_R events increased with the increase in demand and the decrease in RSP. However, the increase in the cycle time for the standard algorithm from 15sec to 30sec helped to reduce the number of Q_E_R events. Though, on the contrary, it resulted in an increase of Q_O_R events when RSP was set to 25m.
Number of times exceeding the max storage of the ramp (Q_E_S)
0 20 40 60 80 100 120
Low demand Mid demand High demand Low demand Mid demand High demand
RSP = 10m RSP = 25m
Test Scenario
E
v
e
n
ts
Standard / (15s cycle)
Standard / (30s cycle)
Coordinated
Number of Queue-Over-Ride events (Q_O_R)
0 5 10 15 20 25
Low demand Mid demand High demand Low demand Mid demand High demand
RSP = 10m RSP = 25m
Test Scenario
E
v
e
n
ts
Standard / (15s cycle)
Standard / (30s cycle)
Coordinated
Figure4: The Q_E_S (top) and the Q_O_R (bottom) values for the various test scenarios
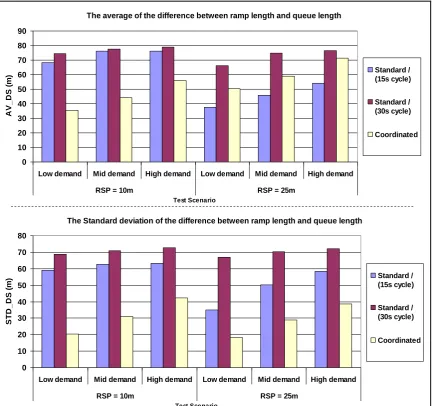
The average and standard deviation of the difference between queue length and the ramp maximum storage space (AV_DS & STD_DS) have also shown significant differences in performance between the coordinated and standard control. The AV_DS and the STD_DS for both algorithms and under various test scenarios are presented in Figure 5. When the ramp set point (RSP) was set to 10m, the coordinated control performed better as lower AV_DS and STD_DS values were generally observed. On average, the STD_DS was improved by a reduction of 50% (56%) when the coordinated control was used instead of the standard algorithm with 15sec (30sec) cycle time. The AV_DS was also reduced (improved) by an average of 39% (42%) when the coordinated control was used instead of the standard algorithm with 15sec (30sec) cycle time. However when the RSP was set to 25m, the standard control resulted in lower values (better) for the AV_DS when 15sec cycle time was used. None-the-less, the coordinated algorithm was found to reduce (improve) the STD_DS by 41% and 59% from the levels observed with the standard control when 15sec and 30sec cycle time were used respectively.
The average of the difference between ramp length and queue length
0 10 20 30 40 50 60 70 80 90
Low demand Mid demand High demand Low demand Mid demand High demand
RSP = 10m RSP = 25m
Test Scenario
A
V
_
D
S
(
m
) Standard /
(15s cycle)
Standard / (30s cycle)
Coordinated
The Standard deviation of the difference between ramp length and queue length
0 10 20 30 40 50 60 70 80
Low demand Mid demand High demand Low demand Mid demand High demand
RSP = 10m RSP = 25m
Test Scenario
S
T
D
_
D
S
(
m
) Standard /
(15s cycle)
Standard / (30s cycle)
[image:11.595.89.525.293.699.2]Coordinated
Figure 5: The AV_DS (top) and the STD_DS (bottom) values for the various test
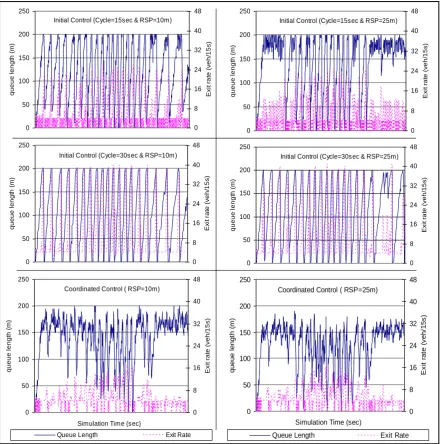
As shown in Figures 4 & 5, the increase in the RSP has helped the standard control to improve its performance considerably whilst the increase in the cycle time had a negative effect. With regard to the coordinated control, the influence of RSP was less apparent as the AV_DS and Q_E_S was marginally affected by the increase of RSP. In order to understand the above results and the mechanism of both control algorithms, the profiles of on-ramp queue length with the release rates were plotted against simulation time as in Figure 6. The results revealed a clear difference between the characteristics of the assessed algorithms. The standard control was unable to manage the length of the on-ramp queue properly as it always relied on queue override to bring the queue length into control and preventing queue spills. The standard control would be able to manage on-ramp queue properly, only when the cycle time is reduced and the RSP increased. In contrast, proper queue control was observed with the coordinated algorithm as the length of on-ramp queues were fluctuating over the time of simulation.
Coordinated Control ( RSP=10m)
0 50 100 150 200 250
Simulation Time (sec)
q u e u e l e n g th (m) 0 8 16 24 32 40 48 Ex it ra te (ve h /1 5 s)
Queue Length Exit Rate
Coordinated Control ( RSP=25m)
0 50 100 150 200 250
Simulation Time (sec)
q u e u e l e n g th ( m ) 0 8 16 24 32 40 48 E x it r a te ( v e h /1 5 s )
Queue Length Exit Rate
Initial Control (Cycle=30sec & RSP=10m)
0 50 100 150 200 250 q u e u e l e n g th (m) 0 8 16 24 32 40 48 Ex it ra te (ve h /1 5 s)
Initial Control (Cycle=15sec & RSP=10m)
0 50 100 150 200 250 q u e u e l e n g th (m) 0 8 16 24 32 40 48 Exi t ra te (ve h /1 5 s)
Initial Control (Cycle=15sec & RSP=25m)
0 50 100 150 200 250 q u e u e l e n g th (m) 0 8 16 24 32 40 48 Exi t ra te (ve h /1 5 s)
Initial Control (Cycle=30sec & RSP=25m)
0 50 100 150 200 250 q u e u e l e n g th (m) 0 8 16 24 32 40 48 Ex it ra te (ve h /1 5 s)
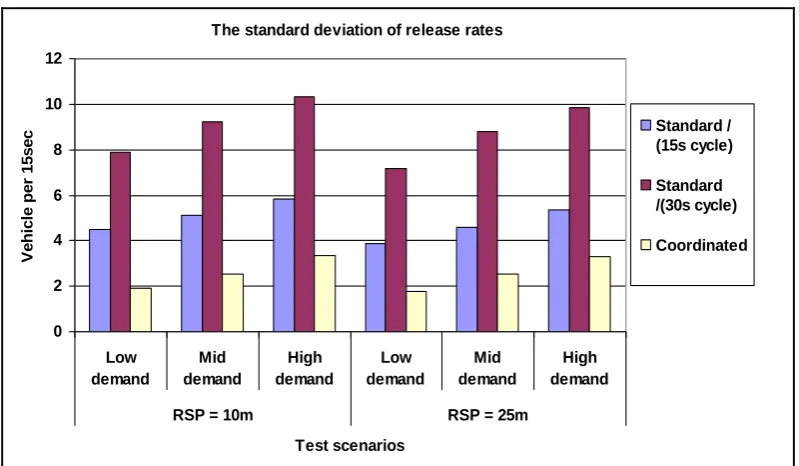
[image:12.595.86.530.277.722.2]The standard deviation of the release rate is another parameter to explain the characteristic above (see Figure 7). The coordinated algorithm has resulted in a reduction of 35% (46%) to the standard deviation of the release rate (STD_RR) compared to the standard control with 15sec (30sec) cycle time. The significant reduction in (STD_RR) is expected to reduce the negative impact of queue control on the overall performance of ramp metering, though a dedicated investigation has to be undertaken for this purpose.
The standard deviation of release rates
0 2 4 6 8 10 12
Low demand
Mid demand
High demand
Low demand
Mid demand
High demand
RSP = 10m RSP = 25m
Test scenarios
Ve
h
ic
le
p
e
r
1
5
s
e
c Standard /
[image:13.595.105.505.165.398.2](15s cycle) Standard /(30s cycle) Coordinated
Figure 7: The standard deviation of the release rate for various queue control algorithms.
CONCLUSION
The research described in this paper has presented a new control algorithm to help ramp metering applications control on-ramp queues and prevent queue spills into adjacent local networks. The new algorithm developed is considered an enhancement to a previous algorithm suggested by Smaragdis and Papageorgiou in 2003 [4]. A microscopic simulation model (AIMSUN) was used to test the operation of the coordinated queue control algorithm and to compare its performance with that of the original queue control. With three demand levels and various parameter settings a total of 18 test scenarios were used. The assessment showed that implementing the new algorithm results in a significant improvement in the reduction of the variation of release rate and the frequency of exceeding storage capacity whilst increasing the efficiency of utilising the ramp space. In addition, the new algorithm was found to be less sensitive to changes in ramp demand and some parameter settings which were found to be critical to the operation of standard queue control.
ACKNOWLEDGEMENTS
REFERENCES
1- Owens, D. and Schofield, M. (1988), “Access Control on the M6 Motorway: Evaluation of Britain’s first Ramp Metering Scheme”, Traffic Engineering and Control, 29(12), pp 616-623.
2- Ozbay, K., Yasar, I., and Kachroo, P, (2004) “Comprehensive Evaluation of Feedback-Based Freeway Ramp-Metering Strategy by Using Microscopic simulation, Taking Ramp Queues into Account”, Transportation Research Record, No. 1867, Washington, DC. 2004, pp 89-96.
3- Papageorgiou, M., Hadj-Salem, H. and Middelham, F, (1997) “ALINEA Local Ramp Metering Summary of Field Results”, Transportation Research Record, 1603, pp 90-98.
4- Smaragdis, E., and Papageorgiou, M, (2003), “Series of New Local Ramp Metering strategies”, Transportation Research Record, No. 1856, Washington, DC. 2003, pp 74-86.
5- Sultan, B., McDonald, M., and Brackston, M, (2005), “Factors Affecting Ramp Metering Impacts, a field implementation study on two sites in the UK.” 85th TRB
Annual Conference Meeting, 2005.
6- Sultan B., McDonald M. and Wu J, (2005), “The Benefit of Video Detection for On-Ramp Queue Control and ALINEA On-Ramp Metering Strategy”, European Transport
Conference2005. 3-5 October 2005, Strasbourg, France.
7- Xin, W., Michalopoulos, P. G, Hourdakis, J., and Lau, D, (2004), “ Minnesota’s New Ramp Control Strategy, Design Overview and Preliminary Assessment”,