S t a t i s t i c s i n F o c u s
Transport
Author: Yves MAHIEU
42/2009
Highlights of the Panorama of Transport
Selected highlights
This Statistics in Focus highlights a small selection of the data presented in the sixth edition of the
Panorama of Transport, to be published shortly.
• Not only does the transport sector support the mobility of people and the movement of goods, but it is also an industry in its own right.
Transport services employed 8.7 million persons in EU-27 in 2005 and they generated
EUR 380.1 billion value added.
• EU-27 passenger transport performance grew annually at an average rate of 1.7 %, while goods transport performance grew yearly by 2.8 % from 1995 to 2006.
• Bulky goods are transported over shorter distances than goods with higher value-added to weight ratios.
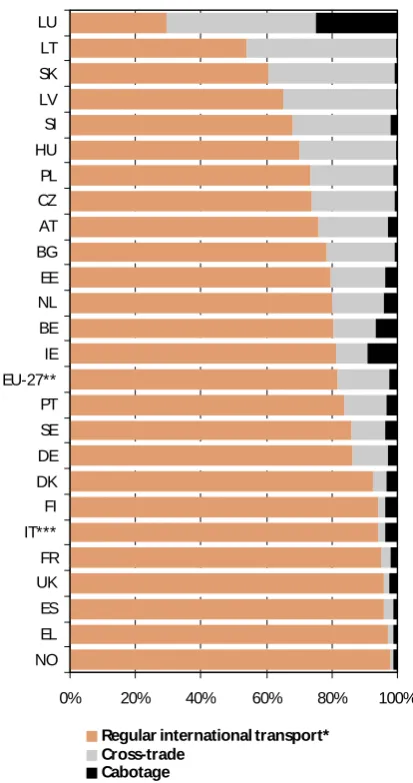
• In Road goods transport, Cross-trade and Cabotage were more widespread in the Member States of the 2004 and 2007 enlargements, the Benelux countries, Austria and Ireland.
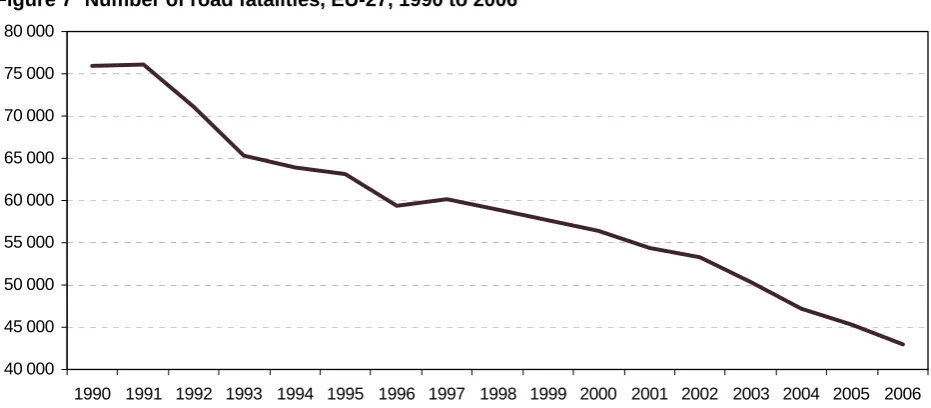
• The number of road fatalities in the EU-27 fell at an average yearly rate of 3.5 % from 1990 to 2006.
• Transport accounted for 31.5 % of total final energy consumption in the EU-27 in 2006, and for 72.1 % of the consumption of oil-based fuels.
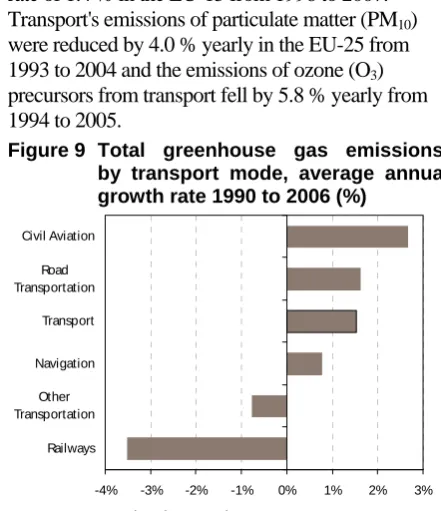
[image:1.595.69.533.472.740.2]• The transport sector's greenhouse gas emissions grew annually by 1.5 % on average from 1990 to 2006.
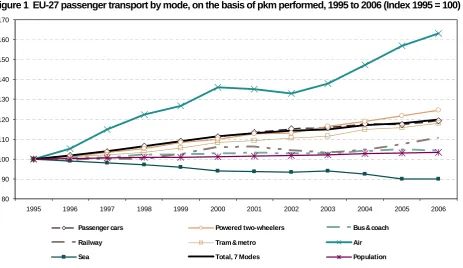
Figure 1 EU-27 passenger transport by mode, on the basis of pkm performed, 1995 to 2006 (Index 1995 = 100)
80 90 100 110 120 130 140 150 160 170
1995 1996 1997 1998 1999 2000 2001 2002 2003 2004 2005 2006
Passenger cars Powered two-wheelers Bus & coach
Railway Tram & metro Air
Sea Total, 7 Modes Population
Passenger transport performance in the seven modes depicted (Figure 1), grew annually at an average rate of 1.7 %, from 5.3 trillion
passenger-kilometres (pkm) in 1995 to 6.3 trillion pkm in 2006.
The two modes that contributed most to the overall increase were Passenger cars (71 %) and Air (20 %). Passenger cars made up a modal share of 73 % in 2006, unchanged from 1995, while Air's modal share rose from 6 % in 1995 to 9 % in 2006. This comes as a result of the liberalisation of the European Union's air transport market and of the growing role of low-cost carriers. The seaborne transport of
passengers was the only mode to display a reduction in performance, which is in large part due to the opening of the Channel Tunnel between France and the United Kingdom, of the Great Belt bridges in Denmark and the
Charilaos Trikoupis bridge in Greece.
Transport forms a vital structural part of many goods and service production and distribution chains.
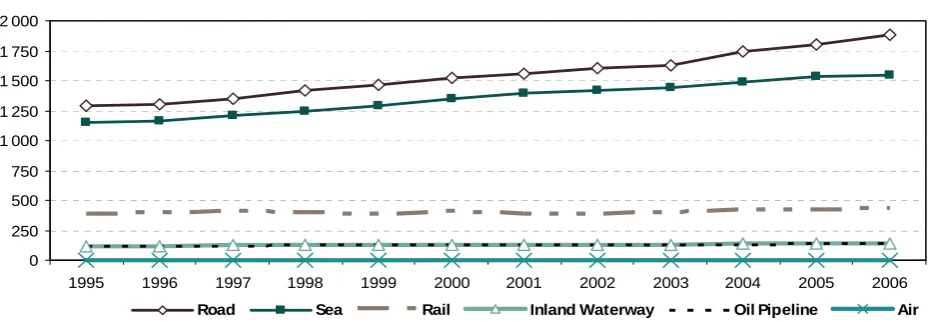
Goods transport performance in the EU-27 grew at an annual average rate of 2.8 % from
3.1 trillion tonne-kilometres (tkm) in 1995 to 4.1 trillion tkm in 2006. All of the six modes depicted here displayed growth, ranging from 1.1 % in Rail to 3.8 % in Sea (Figure 3). Accounting for modal shares of 46 % and 37 % respectively, Road and Sea were the two main goods transport modes in 2006 (Figure 2). Growing at rates of 3.5 % and 2.7 % respectively from 1995 to 2006, Road (55 %) and Sea (37 %) accounted for a major share of the overall increase in goods transport performance in the EU-27. However, the increase in Road goods transport performance from 2003 to 2004 is in
part due to changes in the collection of freight transport statistics in some of the Member States. The main contributors to growth in goods
[image:2.595.313.526.226.419.2]transport in the EU were often the largest Member States. The Member States of the 2004 and 2007 enlargements however displayed strong growth in a number of goods transport sectors. In Road goods transport, some of the Member States of the 2004 and 2007 enlargements, for example, rapidly developed their cross-trade activities to become major players.
Figure 2 Modal distribution of goods trans-port performance, EU-27, 2006 (% tkm)
Road 45.6% Sea
37.3%
Air 0.1%
Rail 10.5% Inland
Waterways
3.3% Oil
Pipelines 3.2%
Source: DG Energy and Transport
The Panorama of Transport details goods transport in the EU-27 by product chapter (1 digit) and by group (2 digits) of the NST/R classification (Standard Goods Nomenclature for Transport Statistics/revised, Eurostat). Travelling an
estimated 126.0 km on average by Road, Rail and Inland waterways, goods were transported furthest in the EU-27 by Inland waterway (273.7 km), followed by Rail (262.2 km). Road carried goods over a shorter average distance of 109.5 km.
Figure 3 Goods transport performance, by mode, EU-27, 1995 to 2006 (billion tkm)
0 250 500 750 1 000 1 250 1 500 1 750 2 000
1995 1996 1997 1998 1999 2000 2001 2002 2003 2004 2005 2006
Road Sea Rail Inland Waterway Oil Pipeline Air
[image:2.595.68.533.596.757.2]In all three transport modes on average, the goods of NST/R chapters Metal products (235.3 km) and Machinery, transport equipment, manufactured and miscellaneous articles (213.4 km) travelled
furthest. In comparison, the products of the NST/R chapter Crude and manufactured minerals, building materials were only carried over an estimated average 46.0 km.
[image:3.595.311.527.48.238.2]Focusing on Road goods transport, Figure 4 shows that the two main types of goods transported were those of the NST/R product chapters Crude and manufactured minerals, building materials and Machinery, transport equipment, manufactured and miscellaneous articles. Whereas, in the first case, the product accounted for 47 % of the weight in tonnes of all
Figure 5 International road goods transport: distribution by type of journey, 2006
(in % of tkm performed)
0% 20% 40% 60% 80% 100%
NO EL ES UK FR IT***
FI DK DE SE PT EU-27** IE BE NL EE BG AT CZ PL HU SI LV SK LT LU
Regular international transport* Cross-trade
Cabotage
Source: Eurostat (Transport)
* Road transport (goods loaded and unloaded) between two places (a place of loading and a place of unloading in two different countries. It may involve transit through one or more additional country or countries.
** IT: 2006; excl. MT; *** 2006 estimate
Figure 4 Road goods transport: distribution by group of goods (NST/R chapter), EU-27*, 2006 (% t and % tkm)
0% 10% 20% 30% 40% 50% Mach., tr. equ., man. & misc. (9)
Chemicals (8) Fertilisers (7) Crude & man. min., build. mat. (6) Metal products (5) Ores & metal waste (4) Petroleum products (3) Solid mineral fuels (2) Foodstuffs & animal fodder (1) Agricultural prod. & live animals (0)
Tonnes Tonne-kilometres
Source: Eurostat (Transport) * EU-27: IT (2005), excl. MT
goods transported by Road, it accounted for 17 % of Road goods transport performance in
tonne-kilometres. This is due to the fact that minerals and building materials are bulky and their transport is only viable over short distances. On the other hand, making up 20 % of total tonnes carried, Machinery, transport equipment, manufactured and
miscellaneous articles accounted for 36 % of tonne-kilometres performed by Road, reflecting the greater distances over which these lighter and more valuable goods are transported.
In the European Single Market, goods appear to be transported over greater distances internationally than they are nationally. The magnitude and proportions of national and international goods transport performance are influenced by the
specificities of the transport mode employed, by the country's size, its topology and location in Europe, as well as by its commercial specialisation and degree of openness to trade. In terms of tonne-kilometres, 33 % of Road goods transport performance was international in the EU-27 in 2007, while this proportion was 40 % in Rail goods transport. In Inland waterway goods transport, in 2006, this share was 75 %.
[image:3.595.66.273.308.700.2]Enterprises, employment and economic performance
In 2005, 1.1 million enterprises employing 8.7 million persons were active in providing Transport services in the EU-27. They generated over EUR 1.1 trillion in turnover and produced
EUR 380.1 billion in value added. Transport services accounted for 6.9 % of the persons employed and for 7.1 % of the value added in the EU-27's non-financial business economy
Table 1 Top ten contributors to Transport services, EU-27, 2005
1 000s %
share 1 000s
%
share EUR billion
%
share EUR billion
% share EU-27 8 725.6 100.0 EU-27 1 104.3 100.0 EU-27 380.1 100.0 EU-27 1 115.0 100.0 Germany 1 274.1 14.6 Spain 223.3 20.2 United Kingdom 69.3 18.2 United Kingdom 205.0 18.4
France 1 116.9 12.8 Italy 154.4 14.0 Germany 66.1 17.4 Germany 181.5 16.3
United Kingdom 1 105.9 12.7 Poland 131.9 11.9 France 57.5 15.1 France 156.4 14.0
Italy 954.7 10.9 France 93.5 8.5 Italy 41.5 10.9 Italy 126.6 11.4
Spain 863.7 9.9 Germany 84.1 7.6 Spain 34.6 9.1 Spain 97.3 8.7
Poland 557.5 6.4 Greece 68.2 6.2 Netherlands 21.1 5.5 Netherlands 58.6 5.3
Netherlands 282.5 3.2 United Kingdom 65.8 6.0 Belgium 11.9 3.1 Sweden 41.2 3.7
Romania 280.5 3.2 Czech Republic 44.9 4.1 Denmark 10.6 2.8 Belgium 40.3 3.6
Czech Republic 268.2 3.1 Hungary 34.5 3.1 Austria 10.6 2.8 Denmark 38.6 3.5
Sweden 221.0 2.5 Sweden 31.1 2.8 Sweden 10.3 2.7 Sweden 32.8 2.9
Number of persons employed Number of enterprises Value added (at factor cost) Turnover
Source: Eurostat (SBS), Member States Note: excluding Malta
From 2000 to 2005, in the EU-25, value added in Transport services grew at an average annual rate of 4.9 % while the number of persons employed rose by 2.2 % yearly.
While the EU-27's largest Member States were generally also those that contributed most to Transport services, their ranking varied according to the Structural Business Service indicators: Number of persons employed, Number of enterprises, Value added and Turnover (Table 1). Germany was the top contributor to the sector's employment, whereas Spain was the largest in terms of the number of enterprises. The top six contributors to EU-27 Transport services turnover and value added ranked in the same order. They were led by the United Kingdom. Together, those six Member States made up close to three quarters of both turnover and value added in EU-27 Transport services in 2005. Transport services contributed the highest shares to the value added in the non-financial business
economies of the Baltic countries and Luxembourg in 2005 (Figure 6). Transport services accounted for 11 % of employment in Latvia. From 2000 to 2005, the number of persons employed in Transport services grew most, at annual average rates of close to 4 %, in Germany, Ireland, Spain and Latvia. Value added grew most over the period at yearly average rates of 16 % in Lithuania and 13 % in both Hungary and Slovakia. Eight out of nine of the Member States displaying the highest growth rates in Transport services value added from 2000 to 2005 belonged to the group of ten Member States with the highest GDP growth rates in the EU-27 over that period. This particularly includes the central and eastern European Member States.
Figure 6 Contribution of Transport services (NACE 60 to 63) to the non-financial business economy (NACE C to I and K), value added and employment, 2005 (%)
0% 5% 10% 15%
IE PL SI SK DE UK SE ES RO IT EU-27 HU CZ* FR PT FI AT BE NO NL EL CY DK BG EE LU LT LV
Employment Value added
Source: Eurostat (SBS)
[image:4.595.61.541.156.301.2]Transport safety
In 2006, 44 400 people lost their lives in
transport accidents in the EU-27 – road, rail and air traffic combined – and most of them on the road (97 %). Road accidents were the cause of 42 950 fatalities in 2006: car drivers and passengers, occupants of buses and coaches, riders and passengers of powered two-wheelers, cyclists, pedestrians and commercial vehicle drivers. This corresponds to 87 fatalities per
million inhabitants in the EU-27, a ratio which has fallen steadily, nearly halving from 162 in 1990. Road safety is at the forefront of the EU's
concerns, and measures taken have contributed to reducing the number of road fatalities at an average yearly rate of 3.5 % from 1990 to 2006 (Figure 7), while the EU-27's population grew at a yearly rate of 0.3 %.
Figure 7 Number of road fatalities, EU-27, 1990 to 2006
40 000 45 000 50 000 55 000 60 000 65 000 70 000 75 000 80 000
1990 1991 1992 1993 1994 1995 1996 1997 1998 1999 2000 2001 2002 2003 2004 2005 2006
Source: DG Energy and Transport
Note: Persons killed are all persons deceased within 30 days of the accident. Corrective factors are applied to the figures from Member States not currently using this definition.
Transport of commuters in European cities
The Urban Audit survey provides data on the distribution by mode of transport used for journeys to work. These are shown in Figure 8 for a selected number of cities.
Reflecting the importance that cars have in those cities, the proportion of journeys made by car ranged between 78 % in Saarbrücken and 26 % in Bratislava. Most capital cities displayed a share of journeys to work by public means of transport that was above 40 %, rising to as much as 50 % in Tallinn and 70 % in Bratislava.
The non-polluting, non-motorised means of transport that are cycling and walking do have their place in EU-27 cities. Cycling appears to be more widespread in northern-European cities, as close to one quarter of journeys to work were made in this way in Amsterdam, Umeå and Aarhus. That proportion rose to as much as 37 % in Groningen and 34 % in Oulu. In Trnava, 56 % of journeys to work were made on foot.
Figure 8 Distribution of journeys to work, selected EU cities (2004)
0% 50% 100%
Bratislava (SK) København (DK) Trnava (SK) Stockholm (SE) Tallinn (EE) Amsterdam (NL) Helsinki (FI) Aarhus (DK) Berlin (DE) Groningen (NL) Umeå (SE) Oulu (FI) Torino (IT)
Saarbrücken (DE) Proportion of
journeys to work by:
Car
Motor cycle
Bicycle
Foot
Public transport *
Source: Eurostat (Urban Audit) * Rail, Metro, Bus and Train.
[image:5.595.65.531.213.417.2]Energy consumption and emissions
Somewhat under a third of total final energy consumption in the EU-27 (31.5 %) was accounted for by Transport in 2006 (Table 2). Transport accounted for 72.1 % of the final consumption of oil-based fuels, the main type consumed in the EU-27. In accordance with their performances in passenger and goods transport, Road (81.9 %) and Air transport
(14.0 %) were the two modes that consumed most energy in the transport sector. Vehicle mobility in those two modes requires a transportable and readily combustible fuel type, explaining their widespread use of oil derivates. The share of biofuels in
[image:6.595.60.539.196.315.2]transport's total fuel consumption amounted to 1.5 % in 2006 compared to nearly nil in 1990.
Table 2 Final energy consumption by fuel, by sector and by transport mode, EU-27, 2006 (in 1000 tonnes of oil equivalent and in %)
Total Oil Gas Electricity Renewables
& Other Solid fuels Heat Final energy consumption 1 176 120 496 681 278 701 241 912 62 054 55 479 41 293
Industry (%) 27 10 37 41 29 77 28
Households/Services (%) 41 18 62 57 62 23 72
Transport (%) 31 72 0.2 3 9 0
of which: Road (%) 82 83 100 100
Rail (%) 2 1 100
IWN (%) 2 2
Air (%) 14 14
Source: Eurostat (Energy)
The transport sector's energy consumption grew at an average annual rate of 1.8 % from 1990 to 2006, accounting for 82.9 % of the increase in the EU-27's total final energy consumption over the period. Growing fleets of passenger and goods road vehicles with higher performances, and a strong increase in the provision of Air transport services were the main contributors to the transport sector's higher energy consumption, 76% of which was accounted for by Road and 25 % by Air transport. While a major share of the increase in consumption (83 %) over the period was attributable to the EU-15 Member States, the countries of the 2004 and 2007 enlargements displayed an acceleration in transport consumption after 2000.
The fuels used in the EU-27 have been made cleaner, for example through the removal of lead from petrol and of sulphur from diesel, and notable
improvements in vehicle technology have resulted in energy efficiency gains. Given that diesel is relatively cheaper than petrol in a large number of Member States, a trend of 'dieselification' took place in road vehicles between the mid-1990s and the mid-2000s. Progress in diesel motor technology contributed to more than doubling the share of diesel in new
passenger car registrations in the EU-15, from 23.1 % in 1994 to 53.6 % in 2007.
The costs of buying and running a transport vehicle are clear, yet transport also occasions a number of external costs such as the emissions of greenhouse gases (GHGs) and pollutants, as well as noise. Based on Eurostat's Sustainable Development Indicators, although total numbers of vehicles have further increased, average CO2 emissions per kilometre from
new passenger cars decreased at an average yearly rate of 1.4 % in the EU-15 from 1996 to 2007. Transport's emissions of particulate matter (PM10) were reduced by 4.0 % yearly in the EU-25 from 1993 to 2004 and the emissions of ozone (O3) precursors from transport fell by 5.8 % yearly from 1994 to 2005.
Figure 9 Total greenhouse gas emissions, by transport mode, average annual growth rate 1990 to 2006 (%)
-4% -3% -2% -1% 0% 1% 2% 3% Railways
Other Transportation
Navigation Transport Road Transportation
Civil Aviation
Source: Eurostat (Environment)
[image:6.595.308.529.365.621.2]¾
ESSENTIAL INFORMATION – METHODOLOGICAL NOTES
zzzzzzzzzzzzzzzzzzzzzzzzzzzzzzzzzzzzzzzzzzzzzzzzzzzzzzzzzzz PANORAMA OF TRANSPORT, SIXTH EDITION
This edition of Statistics in Focus presents a small selection of the data available in the sixth edition of the Panorama of Transport, which covers 1990 to 2007.
The Panorama provides a complete analysis of the EU-27 Transport sector, looking specifically at: infrastructure; vehicle fleets; goods and passenger transport perfomance; enterprises, employment and economic performance; transport safety; energy consumption and emissions.
DATA SOURCES
All data presented in this Statistics in focus come from the
Panorama of Transport, which draws primarily on data from Eurostat – Transport, but also the Urban Audit, SBS, LFS, Energy, Environment and SDI – as well as the DG Energy and Transport Pocketbook EU energy and transport in figures - 2007/2008. Other data sources include OECD/IEA and Eurobarometer as well as the National Statistical Offices of Liechtenstein, China, Japan, Russia and the USA.
Eurostat data, publications and background information can be found under the theme ‘Transport’ on Eurostat’s website:
http://epp.eurostat.ec.europa.eu/.
Data compiled by the European Commission’s DG Energy and Transport can be found in the Pocketbook EU energy and transport in figures:
http://ec.europa.eu/dgs/energy_transport/
DEFINITIONS
Terms and definitions for transport are based on the
Glossary of transport statistics prepared by Eurostat, ITF (International Transport Forum) and UNECE (United Nations Economic Commission for Europe).
Other terms and classifications used in this Statistics in focus are:
Figure 4
NST/R, the Standard Goods Nomenclature for Transport Statistics / Revised. The NST/R Chapters are:
0 Agricultural products and live animals 1 Foodstuffs and animal fodder 2 Solid mineral fuels
3 Petroleum products 4 Ores and metal waste 5 Metal products
6 Crude and manufactured minerals, building materials 7 Fertilisers
8 Chemicals
9 Machinery, transport equipment, manufactured and miscellaneous articles
The 10 Chapters are made up by 24 Groups of goods. As from 2008, the NST/R was replaced by the NST 2007 classification, which has become the unique classification for transported goods in all modes.
Figure 5
International road transport, road transport between two places (a place of loading/embarkation and a place of
unloading/disembarkation) in two different countries. It may involve transit through one or more additional countries.
Cross-trade road transport, international transport performed by a road motor vehicle registered in a third country. Road cabotage transport, road transport performed within a country by a motor vehicle registered in another country.
Table 1 and Figure 6
Structural Business Statistics (SBS) are presented by sector of activity according to the NACE Rev. 1.1 system of classification. ‘Transport services’ includes the four NACE Divisions: Land transport (60), Water transport (61), Air transport (62) and Supporting and auxiliary services (63). These are further detailed at NACE Group or Class level. The SBS variables used in the Panorama of Transport and in this Statistics in Focus include: Number of enterprises, the number of enterprises active during at least part of the reference period; Number of persons employed, the total number of persons who work in the observation unit, as well as persons who work outside the unit, who belong to and are paid by it, including working proprietors, employees, unpaid family workers, part-time workers, seasonal workers, etc.;
Value added at factor cost, the gross income from operating activities after adjusting for operating subsidies and indirect taxes (including value added tax); and
Turnover, totals invoiced by the observation unit during the reference period, which corresponds to market sales of goods or services supplied to third parties.
For further information on SBS data, please visit the ‘Industry, trade and services’ pages on Eurostat’s website:
http://epp.eurostat.ec.europa.eu
For further information on the NACE Rev. 1.1 system of classification, please visit ‘Ramon’, Eurostat’s metadata server: http://ec.europa.eu/eurostat/ramon/
Figure 7
Persons killed, all persons deceased within 30 days of the accident. Corrective factors have been applied to the figures from Member States not currently applying this definition.
Table 2
Final energy consumption covers energy supplied to the final consumer for all energy uses. Readers should note that maritime transport and pipelines are excluded from these figures. Inland Waterway Networks (IWN) are defined differently to Inland Waterways in other parts of the
Panorama of Transport.
Figure 9
Greenhouse gases (GHGs) are emissions of the 'Kyoto basket' of six GHGs, covered by the Kyoto Protocol. They are weighted by their global warming potentials (GWPs), expressed in tonnes-CO2 equivalent and aggregated to yield
total emissions. Ozone-depleting substances with global warming properties, as covered by the Montreal Protocol, are excluded. Figures do not include GHGs from
Further information
Data: Eurostat Website: http://ec.europa.eu/eurostat
Select your theme on the left side of the homepage and then ‘Data’ from the menu.
Data: Eurostat Website/Transport
Journalists can contact the media support service:
Bech Building Office A4/125 L - 2920 Luxembourg Tel. (352) 4301 33408 Fax (352) 4301 35349 E-mail: [email protected]
European Statistical Data Support:
Eurostat set up with the members of the ‘European statistical system’ a network of support centres, which will exist in nearly all Member States as well as in some EFTA countries.
Their mission is to provide help and guidance to Internet users of European statistical data.
Contact details for this support network can be found on our Internet site:
http://ec.europa.eu/eurostat/
A list of worldwide sales outlets is available at the:
Office for Official Publications of the European Communities.
2, rue Mercier L - 2985 Luxembourg
URL: http://publications.europa.eu
E-mail: [email protected]
Manuscript completed on: 18.05.2009 Data extracted on: 14.01.2009 ISSN 1977-0316