taxonomy determination did not outperform metabarcoding approaches. Our study demonstrates how barcoding markers can be tested prior to their application to specific taxonomic groups, and that taxonomy fidelity of markers needs to be validated in relation to environment, taxa, and available reference information.
Keywords: environmental DNA, metataxonomic,
mitochondrial cytochrome c oxidase I, COI, 18S rDNA, Illumina, 454, biodiversity survey
1 Introduction
Biodiversity information from Antarctic terrestrial habitats is important for estimating the effects of environmental change on Antarctic ecosystems [1,2], conservation management in light of increasing threats from non-indigenous invasive species [3], and investigations on the historic effect of glacial constraints on the evolution of Antarctic biotas over millions of years [4]. Undertaking such biodiversity research in terrestrial Antarctica is challenging due to the logistics of accessing remote locations in a harsh environment [5]. In recent years, biodiversity information for terrestrial Antarctic plant life has improved due to compilation of occurrence records from smaller-scale studies into easily accessible databases, and may in the future be easier to obtain through remote sensing technology [6,7]. However, the distribution and diversity of Antarctic invertebrates remains understudied [8,9] despite their important role in nutrient cycling and soil formation [10].
Deficient biodiversity information for terrestrial Antarctic invertebrates is caused by the persistence of slow and inefficient survey methods. Antarctic springtails, mites, tardigrades, nematodes and rotifers are morphologically conserved, but still frequently analyzed with morphological approaches, requiring highly skilled taxonomists - time required to identify such invertebrates can be considered inversely proportional to their size [11–14]. Not reliant on morphological identification, DNA-DOI 10.1515/dna-2017-0001
Received February 29, 2015; accepted December 19, 2016
Abstract: Biodiversity information from Antarctic
terrestrial habitats helps conservation efforts, but the distribution and diversity particularly of micro-invertebrates remains poorly understood. Springtails, mites, tardigrades, nematodes and rotifers are difficult to identify using morphological features, hence DNA-based metabarcoding methods are well suited for their study. We compared taxonomy assignments of a high throughput sequencing metabarcoding approach using one ribosomal DNA (18S rDNA) and one mitochondrial DNA (cytochrome c oxidase subunit I – COI) marker with morphological reference data. Specifically, we compared metabarcoding or morphological taxonomic assignments on multiple taxonomic levels in an artificial DNA blend containing Australian invertebrates, and in seven extracts of Antarctic soils containing known micro-faunal taxa. Avoiding arbitrary application of metabarcoding analysis parameters, we calibrated those parameters with metabarcoding data from non-Antarctic soils. Metabarcoding approaches employing 18S rDNA and COI markers enabled detection of small and cryptic Antarctic invertebrates, and on low taxonomic ranks 18S data outperformed COI data in this respect. Morphological
Research Article
Open Access
Paul Czechowski*, Laurence Clarke, Alan Cooper, Mark Stevens
Ground-truthing Phylotype Assignments for
Antarctic Invertebrates
*Corresponding author Paul Czechowski, Antarctic Biological Research Initiative, 31 Jobson Road, Bolivar, South Australia 5110, Australia; E-mail: [email protected]
Paul Czechowski,Laurence Clarke, Alan Cooper, Australian Centre for Ancient DNA, University of Adelaide, North Terrace, Adelaide, South Australia 5000, Australia
Laurence Clarke, Australian Antarctic Division, 203 Channel High-way, Kingston, Tasmania 7050, Australia
Laurence Clarke, Antarctic Climate & Ecosystems Cooperative, Research Centre, University of Tasmania, Private Bag 80, Hobart, Tasmania 7001, Australia
Mark Stevens, South Australian Museum, Science Centre, North Terrace, Adelaide, South Australia 5001, Australia
based methods are better suited for the study of such taxa [15,16], but may lack resolution when sequence information is not used (e.g. in analysis of Terminal Restriction Fragment Length Polymorphisms – TRFLPs; [17,18]) or may also be prohibitively work intensive when large sample numbers are analyzed (e.g. through Sanger-sequencing; [19,20]. High Throughput Sequencing (HTS) of amplicons generated from bulk extracts of environmental samples can be used to rapidly generate biodiversity information from terrestrial Antarctic habitats [16]. With such metabarcoding methods (sensu [21]), morphologically conserved species are rapidly distinguished in parallel from substrates such as soil, snow or water [22–25], using simple sampling procedures and laboratory workflows [23,26]. In Antarctica, HTS based metabarcoding studies have investigated viruses [27], bacteria [17,28,29] and predominantly unicellular, fungal or algal, eukaryotes [18,26,30]. Such metabarcoding studies could also be increasingly applied specifically to invertebrate taxa, and may there be particularly useful to provide broad taxonomic classification across large spatial distances (i.e. large sample numbers) [16].
The development of practical metabarcoding techniques as successors over morphological biodiversity research requires comparative methodological studies [31]. In the Antarctic context, it is currently unknown how well a metabarcoding approach generating invertebrate phylotypes would compare to morphological taxonomic assignments. Metabarcoding studies require suitable genetic markers to detect target organisms, and markers targeting 18S rDNA [32] and mitochondrial cytochrome c oxidase subunit I (COI) [33] have been widely applied to phylogenetic studies of invertebrates which are also prevalent in Antarctica [19]. Both markers consequently offer a comparatively large amount of reference data to identify such taxa in mixed DNA extracts [19,34]. A comparison of taxonomic assignments between 18S rDNA and COI phylotypes generated through metabarcoding and morphological approaches should consider available metabarcoding reference data, and rank resolution of morphological identifications. Furthermore, comparisons between morphological and HTS-based metabarcoding approaches are complicated by assumptions regarding sequence clustering and taxonomy assignment. Often, analysis parameters for a given processing environment are more or less arbitrary, although crucial to establish reliable richness and diversity estimates [35].
Here, we compared the taxonomy assignment performance of a metabarcoding approach using one 18S rDNA and one COI marker to morphology-derived reference data. To avoid arbitrary application
of metabarcoding analysis parameters, we calibrated parameters with replicated metabarcoding data from two soil samples (“Australian soils”). We were interested in how successfully each marker retrieves taxonomic assignment on superphylum, phylum, class, order, family, genus, and species level in an artificial DNA blend (containing Australian invertebrates - “Australian blend”), and in seven extracts of Antarctic soils (containing microfaunal taxa - “Antarctic soils”) when compared to morphologically-derived sample compositions.
2 Methods
2.1 Samples
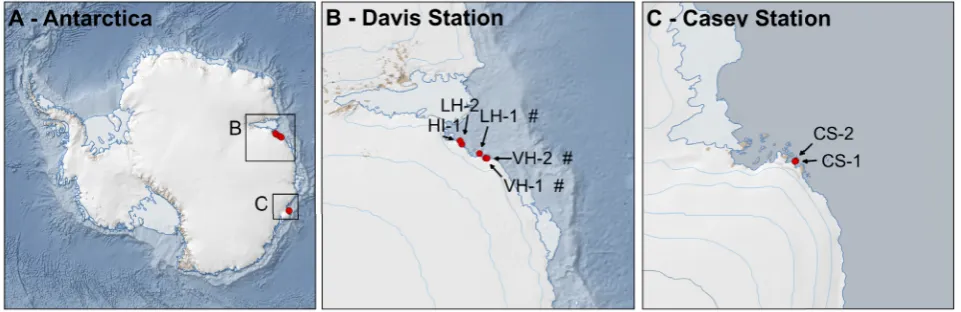
All field activities in Antarctica and sample handling in Australia were undertaken as permitted by the Australian Antarctic Division and the Department of Agriculture, Fisheries and Forestry (Australian Federal Government). Sampling locations of Antarctic soils are shown in Fig. 1, invertebrate isolation and taxonomic descriptions are detailed elsewhere [14]. Invertebrate morphotype composition of these soils is provided in Fig. S2, supporting information. Antarctic soils were thawed and freeze-dried prior to DNA extraction. Australian soils, collected in Adelaide (July 2012, see Table S1, supporting information), were introduced into the laboratory workflow at the freeze-drying stage; the Australian blend was introduced prior to amplification. The latter blend contained DNA from 15 taxa belonging to one order of Arachnida and 14 orders of insects, at a total concentration of 3.1 ng/µl [24].
2.2 DNA extractions
2.3 Primers
Primer sequences (including sequencing adapters and amplicon labels—fusion primers) for PCR and paired-end sequencing of 18S rDNA on the Illumina MiSeq platform were sourced from the 18S rDNA amplification protocol 4.13 of the Earth Microbiome Project [40] and are routinely used for metabarcoding 18S rDNA analyses [41]. Primers HCO2198 [33] and mlCOIintF [42] were chosen for COI amplification and sequencing using the 454 GS FLX platform. Further details on fusion primer design for both gene regions are provided in the Supplemental Material. 18S rDNA and COI fusion primers were initially tested on Antarctic soil samples. Phyla Chelicerata, Nematoda and Rotifera could be recovered by 18S rDNA and COI fusion primers, phylum Tardigrada only by 18S rDNA fusion primers.
2.4 Amplification and sequencing
Amplification and sequencing steps are detailed in the Supplemental Material. Triplicate PCRs were prepared from all 8 extracts to alleviate mixed-template amplification biases [23,43]. Long extension times were used to counteract chimera formation [44,45]. Amplicons were visualized on agarose gels. Triplicates amplicons for each marker were then combined, purified and quantified. Amplicons above 0.25 ng/µl (Table S1, Supplemental Material) were then pooled in equimolar concentration for each marker. Libraries were diluted to 9 pM for Illumina sequencing (18S rDNA) or concentrated to 3.18
ng/µl for emulsion PCR preceding 454 sequencing (COI). 18S rDNA libraries were paired-end sequenced in two separate runs on the Illumina MiSeq platform (Illumina, San Diego, US-CA; reagents kit v2; 150 bp paired-end reads) in 300 cycles and on two separate quarters of a 454 GS FLX PicoTiterPlate (COI). DNA extraction and PCR controls were amplified and sequenced for both markers if the cleaned control reaction allowed pipetting (with a concentration above 0.25 ng/µl). Further details are provided in the Supplemental Material.
2.5 Reference data for taxonomic
assignments
For 18S rDNA taxonomy assignments, SILVA reference data [46] release 111 was used. Reference data for COI was compiled from earlier Antarctic studies (Velasco-Castrillón et al. 2014b; c; Velasco-Castrillón & Stevens 2014) as well as GenBank [34]. Further details regarding creation and composition of reference data are provided in the Supplemental Material.
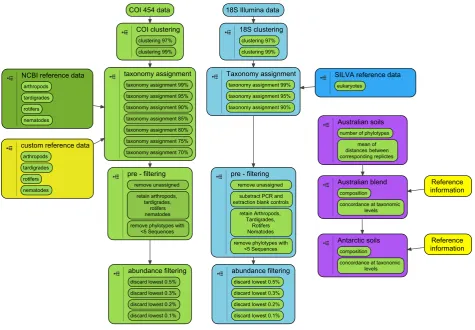
[image:3.595.53.534.69.225.2]85%, 90%, 95% and 99% (COI, accommodating higher intraspecific pairwise distances between query and reference sequences). Resulting phylotype observations were filtered in a step-wise process (Fig. 2; Table S3, Supplemental Material) to retrieve data free of phylotypes present in PCR and extraction blanks and containing only arthropods, nematodes, tardigrades and rotifers; after removal of observations present at 0.1%, 0.2% 0.3% or 0.5% total abundance. From 24 (18S rDNA) and 70 (COI) resulting QIIME phylotype tables, 24 and 16 contained data after processing and were imported into R using the PHYLOSEQ package [52]. Morphological information for Australian blend and Australian soils was converted into a format accessible by PHYLOSEQ and likewise imported into R. To ensure Antarctic phylotype origin in Antarctic thresholds to raw metabarcoding data of both markers and
evaluated the effect of these different settings on phylotype data from Australian soils. We then picked the most suitable setting (see below) to evaluate data from Australian blend and Antarctic soils (Fig. 2). Initially, deconvolution and 18S rDNA and COI data was performed. Chimera removal was achieved through removal of low abundant sequences for 18S rDNA and COI (removal of phylotypes with less than 5 sequences), and an additional de-novo search across the COI data using USEARCH 6.1 [56] as further detailed in the Supplemental Material. Subsequently, de novo clustering at 97% or 99% sequence similarity was performed with UCLUST [56]. Taxonomy assignment to phylotypes was performed with UCLUST [56] via QIIME and thresholds of 90%, 95% and 99% (18S rDNA), and 70%, 75%, 80%,
COI 454 data 18S Illumina data
taxonomy assignment
taxonomy assignment 99% taxonomy assignment 95%
taxonomy assignment 90%
taxonomy assignment 85%
taxonomy assignment 80%
taxonomy assignment 75%
taxonomy assignment 70%
COI clustering
clustering 97%
clustering 99%
18S clustering
clustering 97%
clustering 99%
Taxonomy assignment
taxonomy assignment 99% taxonomy assignment 95%
taxonomy assignment 90%
pre - filtering
remove unassigned retain arthropods,
tardigrades, rotifers nematodes
remove phylotypes with <5 Sequences
pre - filtering
remove unassigned substract PCR and extraction blank controls
retain Arthropods, Tardigrades,
Rotifers Nematodes
remove phylotypes with <5 Sequences
NCBI reference data
arthropods
tardigrades
rotifers
nematodes
custom reference data
arthropods
tardigrades
rotifers
nematodes
SILVA reference data
eukaryotes
abundance filtering
discard lowest 0.5%
discard lowest 0.3%
discard lowest 0.2%
discard lowest 0.1%
abundance filtering
discard lowest 0.5%
discard lowest 0.3%
discard lowest 0.2%
discard lowest 0.1%
Australian soils
number of phylotypes
mean of distances between corresponding replictes
Australian blend
composition
concordance at taxonomic levels
Antarctic soils
composition
concordance at taxonomic levels
Reference information
[image:4.595.68.544.71.401.2]Reference information
Fig 2. Preparation of 18S (light green) and COI (light blue) phylotype data using the QIIME environment, and subsequent analysis (purple). During preparation, data of both metabarcoding markers were independently clustered and assigned with taxonomy using multiple thresholds. Taxonomy assignment was aided by SILVA, NCBI and unpublished reference data (18S rDNA and COI, respectively). During pre-filtering, phylotypes without taxonomic information or not defined by more than five sequences were discarded. Among the remaining phylotypes, only invertebrate phyla expected in Australian blend and Antarctic soils were retained for analysis. Subsequently, different percentages of low abundant phylotypes were discarded. During analysis (purple), comparisons of invertebrate phylotype compositions between two independent PCR replicates for each of two Australian whole soil extracts (Australian soils) were used to determine clustering, taxonomy assignment and abundance filtering parameters that yield similar compositions between corresponding replicates (without dis-carding all phylotypes). Those settings were then chosen to compare phylotype compositions of Australian blend and seven Antarctic soils
soils, observations linked to Australian soils were removed from the Antarctic soil data. Taxonomy strings for morphological and metabarcoding data were restricted or expanded (where possible), to yield superphylum, phylum, class, order, family, genus, and species rank-level information. Taxon information was corrected using NCBI taxonomy terminology (16th of January 2015). All steps are further detailed in the supporting information; analysis scripts are available as indicated at the end of the text.
2.7 Selection of processing parameters for
18S rDNA and COI phylotypes
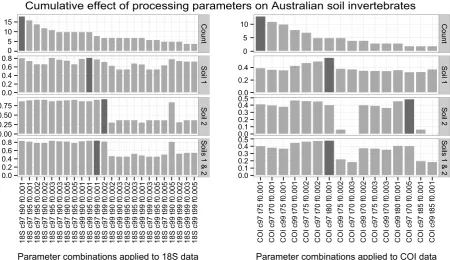
We selected QIIME processing parameters (clustering threshold, taxonomy assignment, low-abundance filtering percentage) based on the highest mean value of Jaccard indices between individually replicated PCRs of each of two Australian soils (Fig. 3; soils 1 and 2, dark grey shading). The chosen analysis parameters retrieve the most compositional similarity between two PCR replicates
of two Australian soils and minimize inclusion of low abundant phylotypes without discarding phylotypes reflective of the ‘true’ compositional diversity (see Discussion).
2.8 Concordance between morphotypes and
18S rDNA, COI phylotype taxonomy
We firstly plotted out the taxonomic composition of phylotypes from Australian blend and Antarctic soils, as well as the corresponding morphotype assignments. Secondly, concordance between morphotype and 18S rDNA / COI phylotype taxonomy was qualified by comparing rank-level information across all (seven) taxonomic ranks. To do so, through an algorithm (see analysis scripts) we recorded all morphotype names for each taxonomic level, and evaluated their presence among 18S rDNA and COI phylotype taxonomic assignments. Complete concordance between morphotypes and phylotypes was scored with “1”, complete dis-concordance
0 5 10 15
0.0 0.2 0.4 0.6 0.8
0.00 0.25 0.50 0.75
0.0 0.2 0.4 0.6 0.8
Count
Soil
1
Soil
2
Soils 1 &
2
18S c97 t90 f0.001 18S c97 t95 f0.001 18S c97 t95 f0.002 18S c97 t90 f0.002 18S c97 t95 f0.003 18S c97 t90 f0.003 18S c97 t90 f0.005 18S c97 t95 f0.005 18S c99 t90 f0.001 18S c99 t95 f0.001 18S c97 t99 f0.001 18S c97 t99 f0.002 18S c99 t90 f0.002 18S c99 t90 f0.003 18S c99 t95 f0.002 18S c99 t95 f0.003 18S c99 t99 f0.001 18S c97 t99 f0.003 18S c99 t95 f0.005 18S c97 t99 f0.005 18S c99 t90 f0.005 18S c99 t99 f0.002 18S c99 t99 f0.003 18S c99 t99 f0.005
Parameter combinations applied to 18S data
Cumulative effect of processing parameters on Australian soil invertebrates
0 5 10
0.0 0.2 0.4
0.0 0.1 0.2 0.3 0.4 0.5
0.0 0.1 0.2 0.3 0.4 0.5
Count
Soil
1
Soil
2
Soils 1 &
2
COI c97 t75 f0.001 COI c97 t70 f0.001 COI c99 t75 f0.001 COI c99 t70 f0.001 COI c97 t75 f0.002 COI c97 t70 f0.002 COI c97 t80 f0.001 COI c99 t75 f0.002 COI c97 t70 f0.003 COI c99 t70 f0.002 COI c97 t75 f0.003 COI c99 t70 f0.003 COI c99 t80 f0.001 COI c97 t70 f0.005 COI c97 t85 f0.001 COI c99 t85 f0.001
Parameter combinations applied to COI data
Fig 3.Determination of suitable processing parameters for invertebrate phylotypes recovered in Australian soils using 18S rDNA and COI metabarcoding markers. 18S rDNA data on the left, COI on right, respectively. Count: Abundances of invertebrate phylotypes. Decreasing phylotype numbers increase compositional similarity between two independent PCR replicates of the same soil and thus were chosen to order processing parameters (in rows). Soil 1 / Soil 2: Jaccard indices described similarity between phylotype compositions of two corres-ponding PCR replicates for a given processing parameter and soil sample (Complete conformity = 1, complete nonconformity = 0). Soil 1 & 2:
[image:5.595.71.522.361.621.2]S4, Supplemental Material). The Antarctic soil ICCs thus were lower than for the Australian blend (CS-1, HI-1) and / or influenced only by unavailable taxon information (HI-1) (Fig. 6 and Fig. S2, Table S1, Supplemental Material). Sample LH-2 yielded a comparatively high ICC value (0.759), due to the detection of Plectidae (Araeolaimida, Nematoda) in all three data sets (Fig. 6, Fig. S2).
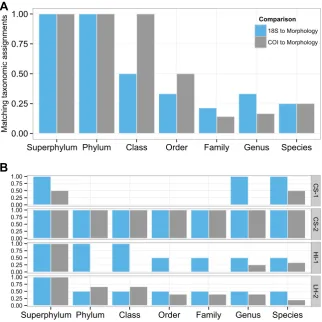
Evaluation of our scoring algorithm (Fig. 4a; second analysis in methods section) revealed phylotype taxonomy assignments for Australian blend using 18S rDNA and COI to be accurate on the superphylum and phylum level (for Ecdysozoa and Arthropoda, respectively, Fig. 4a). 18S rDNA yielded only four expected orders (Blattodea, Hymenoptera, Lepidoptera, Odonata, Fig. 5b). On class and order levels COI performed better than 18S rDNA (Fig. 4a) - insects were more accurately retrieved by COI; furthermore, six of 12 expected orders were retrieved (Araneae, Diptera, Hemiptera, Hymenoptera, Lepidoptera, Neuroptera; Fig. 5c). On the family level 18S rDNA yielded more matches than COI (Fig. 4a), three of 12 expected families were accurately assigned (Blattidae, Coenagrionidae, Ichneumonidae) and one family (Zygaenidae) constituted a miss-assignment (Fig. 5b). In comparison, COI yielded only two correct family assignments (Formicidae, Ichneumonidae), while four families were miss-assigned (Erebidae, Gnaphosidae, Hemerobiidae, Tachninidae, Fig. 5c). The concordance indices hereafter rose for both markers on the genus and species level (Fig. 4a), indicative of missing taxonomic information in both the morphologic and phylotype data (Fig. 5a, Fig. S1, Supplemental Material).
Graphic representation of our scoring algorithm applied to Antarctic soil data (Fig. 4b; second analysis in methods section) demonstrated comparisons between phylotypes and morphotypes to be more impeded by missing information than observed in Australian blend. 18S rDNA phylotype data yielded only one of the orders and families (Araeolaimida: Plectidae) detected morphologically (Fig. 6a), in 3 of 5 expected samples LH-1, LH-2, VH-1 (Fig. 6b). Evidently (Fig. 6b), 18S rDNA phylotypes included orders not detected in morphologic approaches (Monhysterida in sample HI-1 and Oribatida in sample LH-2), each comprised of one family (Monhysteridae and Phenopelopidae, respectively). COI metabarcoding data yielded two orders contained in morphologic reference data (Adinetida and Araeolaimida, Fig. 6c). COI family level assignment to Plectidae was concordant with morphological data (Fig. 6a, c). This family was detected in sample LH-2 with both approaches, in CS-1 only with COI (Fig. 6a, c). In the order Adinetida, the family Adinetidae was detected using morphology but not was scored with “0”. To avoid deflating this taxonomic
concordance in cases were both morpho- and phylotypes were lacking taxonomic information, unavailable taxonomic information was coded “NA”. Thirdly, inter-class correlation coefficients (ICC; [57]) were used to interrelate 18S rDNA and COI concordance values derived from the our algorithm, reaching a value of “1” if both markers showed the same ability to detect morphotypes.
3 Results
3.1 Selection of analysis parameters for 18S
rDNA and COI metabarcoding data
Maximum mean compositional similarity between two PCR replicates of each of two Australian soil samples (0.8 for 18S rDNA, and 0.45 for COI) was achieved using a clustering threshold of 97% and low abundance filtering of 0.01% for both markers, with a taxonomy assignment threshold of 99% for 18S rDNA and 80% for COI (Fig. 3, soils 1 and 2, dark grey shading).
3.2 Concordance between taxonomic
assign-ments of morphotypes and 18S rDNA, COI
phylotypes
Initial plotting indicated that morphologic taxonomy assignments were more or less straightforward for larger invertebrates in the Australian blend, where they were possible to species rank (Fig. 5a and Fig. S1, Supplemental Material). In comparison, morphological taxonomic analysis was more difficult across all Antarctic soils. There, assignments were frequently missing below order level, but identified taxa from six orders (Adinetida, Araeolaimida, Rhabditida, Dorylaimida, Parachela and Phylodinida) and seven families (Macrobiotidae, Adinetidae, Hypsibiidae, Philodinidae, Plectidae, Qudsiannematidae and Rhabditidae (Fig 6a; Fig S2, Supplemental Material).
COI in sample LH-1 and LH-2 (Fig. 6a and Fig. 6c); instead family Adinetidae was detected with COI in sample CS-1 (Fig. 6c). Since we excluded non-Antarctic phylotypes in our initial processing and also conducted low-abundance filtering, orders Coleoptera, Diptera, Lepidoptera and families therein (Fig. 6c) are highly likely to constitute miss-assignments due to missing reference data. Thus, our approach also allowed detection of Antarctic phylotypes that are not contained in the sequence reference data.
4 Discussion
Metabarcoding will likely remain one of the prime methods for biodiversity monitoring and ecological studies in the years to come [58]. Here, we present a straightforward approach to compare taxonomic assignments retrieved with different classification methods. We exemplify the usefulness of this approach by comparing taxonomic assignments of two different metabarcoding markers to morphological assignments. In the case of this study,
the 18S rDNA and COI markers were chosen, since their application to Antarctic invertebrates provides comparatively comprehensive reference information. Similarly, other taxon groups and barcoding markers could be evaluated. With this study, we have complemented research that has compared metabarcoding markers (e.g.: [59,60]), focused on invertebrates [61–63] and provided ‘ground-truthing’ for replicated metabarcoding data by means of morphological data [62–64]. We also expand the range of studies investigating the effect of analysis parameters on metabarcoding data sets [35,60,65,66] including the quality of reference data [67,68].
4.1 Selection of analysis parameters for 18S
rDNA and COI metabarcoding data
Amplicons of replicate bulk soil DNA extracts yield similar taxonomic compositions when the same markers are used, even when sequenced on different HTS platforms [69]. At the same time, low abundant sequence phylotypes
0.00 0.25 0.50 0.75 1.00
Superphylum Phylum Class Order Family Genus Species
Matching taxonomic assignments
Comparison
18S to Morphology COI to Morphology
0.00 0.25 0.50 0.75 1.00
0.00 0.25 0.50 0.75 1.00
0.00 0.25 0.50 0.75 1.00
0.00 0.25 0.50 0.75 1.00
CS-1
CS-2
HI-1
LH-2
Superphylum Phylum Class Order Family Genus Species
A
B
[image:7.595.55.378.348.671.2]Fig 6. Taxonomic assignments to invertebrates contained in Antarctic soils. Composition of morphotypes and phylotypes is shown on order and family level. Figure generated using the GGPLOT2 package [54].
Fig 5. Taxonomic assignments to invertebrates contained in Australian blend. Composition is shown on order and family level. Figure gene-rated using the GGPLOT2 package [54].
Araneae Blattodea Coleoptera Dermaptera Diptera Hemiptera Hymenoptera Isoptera Lepidoptera Neuroptera Odonata Orthoptera
A - Morphoypes.: 12 Orders, 14 Families
Count Families Acrididae Blattidae Chrysopidae Coenagrionidae Eurybrachyidae Forficulidae Formicidae Ichneumonidae Lauxaniidae Lymantriidae Rhinotermitidae Scarabaeidae Sparassidae Tettigoniidae 0 1000 2000 3000 4000 5000 0 5000 10000 15000 20000 25000 0 200 400 600 0 250 500 750 1000 1250 0 2000 4000 6000 8000 Blattodea Hymenopter a Lepidopter a Odonat a no referenc e
B - 18S: 4 Orders, 4 Families
Blattidae Coenagrionidae Ichneumonidae Zygaenidae 0 5 10 15 20 0 20 40 60 0 20 40 60 80 0 200 400 0 10 20 30 40 0 2 4 6 Araneae Dipter a Hemiptera Hymenoptera Lepidopter a Neuropter a
C - COI: 6 Orders, 7 Families
Erebidae Formicidae Gnaphosidae Hemerobiidae Ichneumonidae Tachinidae 0.0 0.5 1.0 1.5 2.0 0 100 200 300 0 5 10 15 20 0 5 10 15 20 0 2 4 6 8 0 1 2 3 0 500 1000 1500 Adinetid a Araeolaimida Rhabditida Dorylaimida Parachel a Philodinida
CS-1 CS-2 HI-1
LH-1
LH-2
VH-1 VH-2
A - M.-types.: 6 Orders, 7 Families
Count Families Macrobiotidae Adinetidae Hypsibiidae Philodinidae Plectidae Qudsianematidae Rhabditidae 0 100 200 300 400 0 2000 4000 6000 8000 0 50 100 0 30 60 90 Araeolaimid a Monhysterid a Oribatid a
CS-1 CS-2 HI-1
LH-1
LH-2
VH-1 VH-2
B - 18S: 3 Orders, 3 Families
Monhysteridae Phenopelopidae Plectidae 0 10 20 30 40 0.0 0.5 1.0 1.5 2.0 0 10 20 30 40 0.0 2.5 5.0 7.5 10.0 0 50 100 150 200 0 5 10 15 Adinetid a Araeolaimida Coleopter a Dipter a Lepidopter a
CS-1 CS-2 HI-1
LH-2
C - COI: 5 Orders, 7 Families
[image:8.595.78.517.421.697.2]are likely to be of chimeric origin or may constitute other PCR or sequencing errors, necessitating their removal for ecological inferences [66]. Adjusting sequence data processing thresholds could lead to biased results, if sparse data (i.e. Antarctic soils with low diversity [10,70], and low overall sequence count) or an artificial community (i.e. Australian blend, with high overall sequence count, but little sequence diversity) were used for calibration. In the first case (calibration with Antarctic soils), the amount of sequence artifacts could be underestimated, when applied to the Australian blend. In the second case (calibration with Australian blend), the amount of sequence artifacts could be overestimated in data from Antarctic soils. Consequently, we chose data from a more diverse natural community (i.e. Australian soils) for thresholds adjustment. We considered that these data would represent a compromise between over- and under-estimating the amount of sequence artifacts.
4.2 Detecting highly abundant and cryptic
Antarctic invertebrates
Generally, retrieval of a completely overlapping species inventory between morphological and sequence-based approaches is difficult to achieve due to inherent biases of each approach [61–63]. This limitation somewhat constrains comparisons between sequence-based and morphology based taxonomy assignments as performed here. Regardless, metabarcoding approaches are preferable in the first instance over morphological techniques for taxonomic identification of highly abundant and cryptic Antarctic nematodes and rotifers in Antarctic bulk soil samples, and provide some attractive benefits: (1) The high abundance of those taxa constitutes a constraint to morphological approaches and increases their DNA contributions to low-diverse Antarctic soil extracts, leading to higher success of metabarcoding approaches [14,61,62]; (2) both nematodes and rotifers are often missed in morphological approaches due to constraints of extraction methods, their small size and conserved morphology [61,62,71]; and (3) both markers employed here were able to provide family level assignments to nematodes and rotifers with reasonable workload (Fig. 6), despite the fact that all metabarcoding markers perform differently in detecting expected phylotypes from DNA mixtures [24]. Apart from Araeolaimida (Nematoda) and Adinetida (Rotifera), Antarctic phylotype data did not contain taxa detected also by visual inspection (morphology). These absences may be caused by (a) absences of target organisms in the sample, (b) incomplete/
imperfect DNA extraction, (c) poor PCR performance of markers, (d) inappropriate removal of reads during sequence processing or (e) incorrect taxonomy assignment due to lacking reference data [62,63,72]. Sub-samples of Antarctic soils used for sequence generation may have lacked taxa identified visually (a, above), but extraction of large soil quantities (400 g) performed here makes biased DNA extract composition (b, above) unlikely [73]. Overall lower amplicon concentrations for COI (Table S1, Supplemental Material) indicated lower PCR performance in comparison to 18S rDNA (c, above), but retrieval of invertebrate phylotypes was nonetheless possible (Fig. 6) and perhaps for invertebrates the large quantity of soil used is important (a, above). Due to our threshold selection approach, incorrect taxonomic assignments to phylotypes also detected among morphotypes is unlikely (e, above). Our results hence show that both 18S rDNA and COI markers are well suited to detect highly abundant Antarctic rotifers and nematodes in bulk soil extract, on the family level or above. Additionally, the employed 18S rDNA marker was able to detect Oribatida (Chelicerata), which the morphological approach failed to detect. In many cases this taxonomic resolution will be sufficient for large scale biogeographic inferences [16] and allows targeting of samples for further examination.
4.3 Metabarcoding marker choice for
Antarctic invertebrates
Here we examined the 18S rDNA and COI markers in conjunction with Antarctic invertebrates. Although metabarcoding data derived from the slow-evolving 18S rDNA may fail to accurately reflect biodiversity in mixed samples, the 18S rDNA gene region is considered an efficient and powerful marker for profiling unknown communities [59,60,74]. The faster mutation rate of the mitochondrial COI region is considered well-suited for discriminating among lower taxonomic ranks [32,75–77]. At the same time, the COI gene region is prone to saturate at higher taxonomic levels [58–60,74]. However, qualities of marker regions such as 18S rDNA and COI can only be observed and applied if reference data is available across all (and particularly the low) taxonomic ranks [58]. Collectively, our study provides evidence that markers used for metabarcoding of bulk samples need to be chosen depending on the desired rank-resolution of taxonomic assignments, with regard to available reference data, and to the investigated environment and/or potential biological diversity.
high taxonomic ranks, and to complement phylotype information obtained through other markers, such as 18S rDNA. In the Australian blend, COI performed better in retrieving morphologically concordant class and order level information, while on the family level 18S rDNA yielded higher concordance. In Antarctic soils, COI performed better on phylum and class level, while 18S rDNA retrieved better concordance at the order to species ranks. On lower taxonomic ranks, the taxonomic resolution of 18S rDNA outperforms the taxonomic resolution of COI for metabarcoding of Antarctic invertebrates. The decreased performance of COI at low taxonomic ranks in Antarctic samples is likely due and missing taxonomic information for this marker at low taxonomic ranks [58]. The task of collating COI genotypes across all metazoans (and particularly small and cryptic invertebrates in remote regions) is arguably more difficult than creating reference data for the overall fewer conserved 18S rDNA genotypes. Critically, the remedy for this situation is to increase α taxonomic [78,79] approaches in the Antarctic region linked to sequencing efforts, the latter in the future being likely realized using shotgun sequencing approaches [16,58,80].
5 Conclusions
We show that barcoding markers can be tested prior to their application to specific taxonomic groups, and that taxonomy fidelity of markers needs to be validated in relation to environment, taxa, and available reference information. Among two commonly used metabarcoding markers with relatively comprehensive invertebrate reference data, 18S rDNA data currently outperforms COI in accurately assigning Antarctic invertebrates phylotypes on low taxonomic ranks, due to a lack of COI reference data for Antarctic taxa. Similar constraints will exist for taxa studied in more northern latitudes and investigated with other metabarcoding markers.
Acknowledgements: PC designed and implemented
analysis and wrote the manuscript, MS and LC revised analysis. MS, LC, and AC revised the manuscript. The Australian Antarctic Division provided funding under science project 2355 to MS. The Australian Research Council supported this work through funds from linkage grant LP0991985 to AC and MS. The University of Adelaide supported this project through the International Post- Graduate Research Scholarship to PC.
We thank Alejandro Velasco Castrillón (University of Adelaide) for contributing Antarctic invertebrate
morphotype information, Stephen Pederson (University of Adelaide) and Greg Guerin (University of Adelaide) for helpful discussions on analysis coding, Jimmy Breen (University of Adelaide) for maintaining the computational infrastructure required for sequence processing. We appreciate the support of Alan McKay, Russell Burns, and the laboratory staff of the South Australian Research and Development Institute (SARDI).
Supplemental data
Supporting Online Information provide further details regarding materials, methods and results. Sequence data and analysis are available as a stable release via https://doi.org/10.5281/zenodo.570066 and maintained at https://github.com/macrobiotus/marker_comparison.git.
References
[1] Freckman D. W. & Virginia R.A., Low-Diversity Antarctic Soil Nematode Communities: Distribution and Response to Disturbance, Ecology, 1997, 78, 363. (doi:10.2307/2266013) [2] Nielsen U. N., Wall D. H., Adams B. J. & Virginia R. A., Antarctic
nematode communities: observed and predicted responses to climate change, Polar Biol., 2011, 34, 1701–1711. (doi:10.1007/ s00300-011-1021-2)
[3] Chown S. L., Lee J. E., Hughes K. A., Barnes J., Barrett P. J., Bergstrom D. M., et al., Challenges to the Future Conservation of the Antarctic, Science, 2012, 337(6091), 158–159. (doi:10.1126/science.1222821)
[4] Convey P. & Stevens M. I., Antarctic Biodiversity, Science, 2007, 317(5846), 1877–1878. (doi:10.1126/science.1147261)
[5] Convey P., Terrestrial biodiversity in Antarctica – Recent advances and future challenges, Polar Sci., 2010, 4, 135–147. (doi:10.1016/j.polar.2010.03.003)
[6] Fretwell P. T., Convey P., Fleming A. H., Peat H. J. & Hughes K. A., Detecting and mapping vegetation distribution on the Antarctic Peninsula from remote sensing data, Polar Biol., 2011, 34, 273–281.
[7] Casanovas P., Black M., Fretwell P. & Convey P., Mapping lichen distribution on the Antarctic Peninsula using remote sensing, lichen spectra and photographic documentation by citizen scientists, Polar Res., 2015, 34. (doi:10.3402/polar.v34.25633) [8] McGaughran A., Stevens M. I., Hogg I. D. & Carapelli A.,
Extreme Glacial Legacies: A Synthesis of the Antarctic Springtail Phylogeographic Record, Insects, 2011, 2, 62–82. (doi:10.3390/insects2020062)
[9] Terauds A., Chown S. L., Morgan F. J., Peat H., Watts D. J., Keys H., et al, Conservation biogeography of the Antarctic, Divers. Distrib.,2012, 18, 726–741. (doi:10.1111/j.1472-4642.2012.00925.x)
N. M. Johnston E. J. Murphy & A. Clarke), Chichester, UK: John Wiley & Sons, Ltd., 2012
[11] Stevens M. I. & Hogg I. D., Contrasting levels of mitochondrial DNA variability between mites (Penthalodidae) and springtails (Hypogastruridae) from the Trans-Antarctic Mountains suggest long-term effects of glaciation and life history on substitution rates, and speciation processes, Soil Biol. Biochem.,2006, 38, 3171–3180. (doi:10.1016/j.soilbio.2006.01.009)
[12] Velasco-Castrillón A., Gibson J. A. E. & Stevens M. I., A review of current Antarctic limno-terrestrial microfauna, Polar Biol., 2014, 37, 1517–1531. (doi:10.1007/s00300-014-1544-4) [13] Velasco-Castrillón A. & Stevens M. I., Morphological and
molecular diversity at a regional scale: A step closer to understanding Antarctic nematode biogeography, Soil Biol. Biochem., 2014, 70, 272–284. (doi:10.1016/j. soilbio.2013.12.016)
[14] Velasco-Castrillón A., Schultz M. B., Colombo F., Gibson J. A. E., Davies K. A., Austin, A. D., et al., Distribution and Diversity of Soil Microfauna from East Antarctica: Assessing the Link between Biotic and Abiotic Factors, PLoS One, 2014, 9, e87529. (doi:10.1371/journal.pone.0087529)
[15] Rogers A. D., Evolution and biodiversity of Antarctic organisms: a molecular perspective, Philos. Trans. R. Soc. B Biol. Sci., 2007, 362, 2191–2214. (doi:10.1098/rstb.2006.1948) [16] Czechowski P., Clarke L. J., Cooper A. & Stevens M. I., A
primer to metabarcoding surveys of Antarctic terrestrial biodiversity, Antarct. Sci., 2017, 29(1), 3-15. (doi:10.1017/ S0954102016000389)
[17] Makhalanyane T. P., Valverde A., Birkeland N.-K., Cary S. C., Marla Tuffin I. & Cowan, D. A., Evidence for successional development in Antarctic hypolithic bacterial communities, ISME J., 2013, 7, 2080–2090. (doi:10.1038/ismej.2013.94) [18] Dreesens L., Lee C. & Cary S., The Distribution and Identity of
Edaphic Fungi in the McMurdo Dry Valleys, Biology, 2014, 3, 466–483. (doi:10.3390/biology3030466)
[19] Lawley B., Ripley S., Bridge P. & Convey P., Molecular Analysis of Geographic Patterns of Eukaryotic Diversity in Antarctic Soils, Appl. Environ. Microbiol.,2004, 70, 5963–5972. (doi:10.1128/AEM.70.10.5963-5972.2004)
[20] Nakai R., Abe T., Baba T., Imura S., Kagoshima H., Kanda H., et al., Eukaryotic phylotypes in aquatic moss pillars inhabiting a freshwater lake in East Antarctica, based on 18S rRNA gene analysis, Polar Biol. 35, 2012, 1495–1504. (doi:10.1007/ s00300-012-1188-1)
[21] Taberlet P., Coissac E., Pompanon F., Brochmann C. & Willerslev E., Towards next-generation biodiversity assessment using DNA metabarcoding, Mol. Ecol., 2012, 21, 2045–2050. (doi:10.1111/ j.1365-294X.2012.05470.x)
[22] Bik H. M., Porazinska D. L., Creer S., Caporaso J. G., Knight R. & Thomas W. K., Sequencing our way towards understanding global eukaryotic biodiversity, Trends Ecol. Evol., 2012, 27, 233–243. (doi:10.1016/j.tree.2011.11.010)
[23] Bohmann K., Evans A., Gilbert M. T. P., Carvalho G. R., Creer S., Knapp M., et al., Environmental DNA for wildlife biology and biodiversity monitoring, Trends Ecol. Evol., 2014, 29, 358–367. (doi:10.1016/j.tree.2014.04.003)
[24] Clarke L. J., Soubrier J., Weyrich L. S. & Cooper A.,
Environmental metabarcodes for insects: in silico PCR reveals potential for taxonomic bias, Mol. Ecol. Resour., 2014, 14, 1160–1170. (doi:10.1111/1755-0998.12265)
[25] Drummond A. J. et al., Evaluating a multigene environmental DNA approach for biodiversity assessment, Gigascience, 2015 4, 46. (doi:10.1186/s13742-015-0086-1)
[26] Czechowski P., Clarke L. J., Breen J., Cooper A. & Stevens M. I., Antarctic eukaryotic soil diversity of the Prince Charles Mountains revealed by high-throughput sequencing, Soil Biol. Biochem., 2016 95, 112–121. (doi:10.1016/j. soilbio.2015.12.013)
[27] Lopez-Bueno A., Tamames J., Velazquez D., Moya A., Quesada A. & Alcami A., High Diversity of the Viral Community from an Antarctic Lake, Science, 2009, (80-. ). 326, 858–861. (doi:10.1126/science.1179287)
[28] Bottos E. M., Scarrow J. W., Archer S. D. J., Mcdonald I. R. & Cary S. C., Bacterial community structures of Antarctic soils, In: Cowan, D. A. (Eds.), Antarctic Terrestrial Microbiology pp. 9–33. Berlin, Heidelberg: Springer Berlin Heidelberg, 2014
[29] Teixeira L. C. R. S., Peixoto R. S., Cury J. C., Sul W. J., Pellizari V. H., Tiedje J., et al., Bacterial diversity in rhizosphere soil from Antarctic vascular plants of Admiralty Bay, maritime Antarctica, ISME J., 2010, 4, 989–1001. (doi:10.1038/ismej.2010.35) [30] Niederberger T. D., Sohm J. A., Gunderson T. E., Parker A. E., Tirindelli J., Capone, D. G., et al., Microbial community composition of transiently wetted Antarctic Dry Valley soils, Front. Microbiol., 2015, 6, 1–12. (doi:10.3389/ fmicb.2015.00009)
[31] Kelly R. P., Making environmental DNA count, Mol. Ecol. Resour., 2016, 16, 10–12. (doi:10.1111/1755-0998.12455) [32] Medlin L., Elwood H. J., Stickel S. & Sogin M. L., The
characterization of enzymatically amplified eukaryotic 16S-like rRNA-coding regions, Gene, 1988, 71, 491–499. (doi:10.1016/0378-1119(88)90066-2)
[33] Folmer O., Black M., Hoeh W., Lutz R. & Vrijenhoek R., DNA primers for amplification of mitochondrial cytochrome c oxidase subunit I from diverse metazoan invertebrates, Mol. Mar. Biol. Biotechnol., 1994, 3, 294–9.
[34] Benson D. A., Karsch-Mizrachi I., Lipman D. J., Ostell J. & Sayers E. W., GenBank, Nucleic Acids Res., 2011, 39, D32-7. (doi:10.1093/nar/gkq1079)
[35] Koskinen K., Auvinen P., Björkroth K. J. & Hultman J., Inconsistent Denoising and Clustering Algorithms for Amplicon Sequence Data, J. Comput. Biol., 2015, 22, 743–751. (doi:10.1089/cmb.2014.0268)
[36] Pankhurst C. E., Ophel-Keller K., Doube B. M. & Gupta V. V. S. R., Biodiversity of soil microbial communities in agricultural systems, Biodivers. Conserv., 1996, 5, 197–209. (doi:10.1007/ BF00055830)
[37] Ophel-Keller K., McKay A., Hartley D., Curran H. & Curran J., Development of a routine DNA-based testing service for soilborne diseases in Australia, Australas. Plant Pathol.,2008, 37, 243. (doi:10.1071/AP08029)
[38] Haling R. E. et al., Direct measurement of roots in soil for single and mixed species using a quantitative DNA-based method, Plant Soil, 2011, 348, 123–137. (doi:10.1007/s11104-011-0846-3)
[39] Huang C. Y. et al., A DNA-based method for studying root responses to drought in field-grown wheat genotypes, Sci. Rep., 2013, 3, 1–7. (doi:10.1038/srep03194)
Stand. Genomic Sci., 2010, 3, 243–248. (doi:10.4056/ sigs.1433550)
[41] Parfrey L. W. et al., Communities of microbial eukaryotes in the mammalian gut within the context of environmental eukaryotic diversity, Front. Microbiol., 2014, 5, 1–13. (doi:10.3389/ fmicb.2014.00298)
[42] Leray M., Yang J. Y., Meyer C. P., Mills S. C., Agudelo N., Ranwez
V., et al., A new versatile primer set targeting a short fragment
of the mitochondrial COI region for metabarcoding metazoan diversity: application for characterizing coral reef fish gut contents, Front. Zool., 2013, 10, 34. (doi:10.1186/1742-9994-10-34)
[43] Ding J. et al., Integrated metagenomics and network analysis of soil microbial community of the forest timberline, Sci. Rep., 2015, 5, 7994. (doi:10.1038/srep07994)
[44] Yu D. W., Ji Y., Emerson B. C., Wang X., Ye C., Yang C. & Ding Z., Biodiversity soup: metabarcoding of arthropods for rapid biodiversity assessment and biomonitoring, Methods Ecol. Evol., 2012, 3, 613–623. (doi:10.1111/j.2041-210X.2012.00198.x)
[45] Lenz T. L. & Becker S., Simple approach to reduce PCR artefact formation leads to reliable genotyping of MHC and other highly polymorphic loci — Implications for evolutionary analysis, Gene, 2008, 427, 117–123. (doi:10.1016/j.gene.2008.09.013) [46] Pruesse E., Quast C., Knittel K., Fuchs B. M., Ludwig W., Peplies
J. & Glockner F. O., SILVA: A comprehensive online resource for quality checked and aligned ribosomal RNA sequence data compatible with ARB, Nucleic Acids Res., 2007 35, 7188–7196. (doi:10.1093/nar/gkm864)
[47] Velasco-Castrillón A., Page T. J., Gibson J. A. E. & Stevens M. I., Surprisingly high levels of biodiversity and endemism amongst Antarctic rotifers uncovered with mitochondrial DNA, Biodiversity, 2014, 15, 130–142. (doi:10.1080/14888386.2014. 930717)
[48] Caporaso J. G. et al., QIIME allows analysis of high-throughput community sequencing data, Nat. Methods, 2010 , 7, 335–336. (doi:10.1038/nmeth.f.303)
[49] R Development Core Team, R: A language and environment for statistical computing, R Foundation for Statistical Computing, 2016, Vienna, Austria. URL http://www.R-project.org/. [50] Dray S. & Dufour, A.-B., The ade4 Package: Implementing the
Duality Diagram for Ecologists, J. Stat. Softw., 2007, 22, 1–20. (doi:10.18637/jss.v022.i04)
[51] Chessel D., Dufour A. B. & Thioulouse J., The ade4 package I: One-table methods. R News, 2004, 4, 5–10.
[52] McMurdie P. J. & Holmes S., Phyloseq: An R Package for Reproducible Interactive Analysis and Graphics of Microbiome Census Data, PLoS One, 2013, 8, e61217. (doi:10.1371/journal. pone.0061217)
[53] Wickham H., The Split-Apply-Combine Strategy for Data Analysis, J. Stat. Softw., 2011, 40, 1–20. (doi:10.18637/jss. v040.i01)
[54] Wickham H., ggplot2, Springer New York, 2009. (doi:10.1007/978-0-387-98141-3)
[55] Dixon P., VEGAN, a package of R functions for community ecology, J. Veg. Sci., 2003, 14, 927–930. (doi:10.1111/j.1654-1103.2003.tb02228.x)
[56] Edgar R. C., Search and clustering orders of magnitude faster than BLAST, Bioinformatics, 2010, 26, 2460–2461. (doi:10.1093/bioinformatics/btq461)
[57] Koch G. G., Intraclass Correlation Coefficient, In: Encyclopedia of Statistical Sciences, pp. 213–217. Hoboken, NJ, USA: John Wiley & Sons, Inc, 2006 (doi:10.1002/0471667196.ess1275. pub2)
[58] Leray M. & Knowlton N., Censusing marine eukaryotic diversity in the twenty-first century, Philos. Trans. R. Soc. B Biol. Sci., 2016, 371, 20150331. (doi:10.1098/rstb.2015.0331) [59] Tang C. Q., Leasi F., Obertegger U., Kieneke A., Barraclough
T. G. & Fontaneto D., The widely used small subunit 18S rDNA molecule greatly underestimates true diversity in biodiversity surveys of the meiofauna, Proc. Natl. Acad. Sci., 2012, 109, 16208–16212. (doi:10.1073/pnas.1209160109)
[60] Zhan A., Bailey S. A., Heath D. D. & Macisaac H. J., Performance comparison of genetic markers for high-throughput
sequencing-based biodiversity assessment in complex communities, Mol. Ecol. Resour., 2014, 14, 1049–1059. (doi:10.1111/1755-0998.12254)
[61] Wu T., Ayres E., Li G., Bardgett R. D., Wall D. H. & Garey J. R., Molecular profiling of soil animal diversity in natural ecosystems: Incongruence of molecular and morphological results, Soil Biol. Biochem., 2009, 41, 849–857. (doi:10.1016/j. soilbio.2009.02.003)
[62] Cowart D. A., Pinheiro M., Mouchel O., Maguer M., Grall J., Miné J. & Arnaud-Haond S. Metabarcoding is powerful yet still blind: A comparative analysis of morphological and molecular surveys of seagrass communities. PLoS One 10, 2015, e0117562. [63] Tréguier A., Paillisson J.-M., Dejean T., Valentini A., Schlaepfer
M. A. & Roussel J.-M., Environmental DNA surveillance for invertebrate species: advantages and technical limitations to detect invasive crayfish Procambarus clarkii in freshwater ponds, J. Appl. Ecol., 2014, 51, 871–879. (doi:10.1111/1365-2664.12262)
[64] Olds B. P., Jerde C. L., Renshaw M. A., Li Y., Evans N. T., Turner C. R., et al., Estimating species richness using environmental DNA, Ecol. Evol., 2016 , 6, 4214–4226. (doi:10.1002/ece3.2186) [65] Lee C. K., Herbold C. W., Polson S. W., Wommack K. E.,
Williamson S. J., McDonald I. R. & Cary S. C., Groundtruthing Next-Gen Sequencing for Microbial Ecology–Biases and Errors in Community Structure Estimates from PCR Amplicon Pyrose-quencing, PLoS One, 2012, 7, e44224. (doi:10.1371/journal. pone.0044224)
[66] Bokulich N. A., Subramanian S., Faith J. J., Gevers D., Gordon J. I., Knight R., Mills D. A. & Caporaso J. G., Quality-filtering vastly improves diversity estimates from Illumina amplicon sequencing, Nat. Methods, 2012, 10, 57–59. (doi:10.1038/ nmeth.2276)
[67] Berney C., Fahrni J. & Pawlowski J., How many novel eukaryotic ‘kingdoms’? Pitfalls and limitations of environmental DNA surveys, BMC Biol., 2004, 2, 13. (doi:10.1186/1741-7007-2-13) [68] Kwong S., Srivathsan A. & Meier R., An update on DNA
barcoding: low species coverage and numerous unidentified sequences, Cladistics, 2012, 28, 639–644. (doi:10.1111/j.1096-0031.2012.00408.x)
[69] Smith D. P. & Peay K. G., Sequence Depth, Not PCR Replication, Improves Ecological Inference from Next Generation DNA Sequencing, PLoS One, 2014, 9, e90234. (doi:10.1371/journal. pone.0090234)
Communities Using High-Throughput Sequencing, PLoS One, 2014, 9, e96928. (doi:10.1371/journal.pone.0096928) [71] Dartnall H. J. G., Rotifers of the Antarctic and Subantarctic.
Hydrobiologia, 1983, 104, 57–60. (doi:10.1007/BF00045952) [72] Egan S. P., Grey E., Olds B., Feder J. L., Ruggiero S. T., Tanner C.
E. & Lodge D. M., Rapid Molecular Detection of Invasive Species in Ballast and Harbor Water by Integrating Environmental DNA and Light Transmission Spectroscopy, Environ. Sci. Technol., 2015, 49, 4113–4121. (doi:10.1021/es5058659)
[73] Taberlet, P., Prud’homme S. M., Campione E., Roy J., Miquel C., Shehzad W. et al., Soil sampling and isolation of extracellular DNA from large amount of starting material suitable for metabarcoding studies, Mol. Ecol., 2012, 21, 1816–1820. (doi:10.1111/j.1365-294X.2011.05317.x)
[74] Deagle B. E., Jarman S. N., Coissac E., Pompanon F. & Taberlet P., DNA metabarcoding and the cytochrome c oxidase subunit I marker: Not a perfect match, Biol. Lett., 2014, 10, 20140562– 20140562. (doi:10.1098/rsbl.2014.0562)
[75] Abouheif E., Zardoya R. & Meyer A., Limitations of Metazoan 18S rRNA Sequence Data: Implications for Reconstructing a Phylogeny of the Animal Kingdom and Inferring the Reality
of the Cambrian Explosion, J. Mol. Evol., 1998, 47, 394–405. (doi:10.1007/PL00006397)
[76] Moritz C., Dowling T. E. & Brown W. M., Evolution of Animal Mitochondrial DNA: Relevance for Population Biology and Systematics, Annu. Rev. Ecol. Syst., 1987, 18, 269–292. (doi:10.1146/annurev.es.18.110187.001413)
[77] Wiemers M. & Fiedler K., Does the DNA barcoding gap exist? – A case study in blue butterflies (Lepidoptera: Lycaenidae), Front. Zool., 2007, 4, 8. (doi:10.1186/1742-9994-4-8) [78] Turrill W. B., The expansion of taxonomy with special
reference to Spermatophyta. Biol. Rev., 1938, 13, 342–373. (doi:10.1111/j.1469-185X.1938.tb00522.x)
[79] Stevens M. I., Porco D., D’Haese C. A., Deharveng L., Comment on ‘Taxonomy and the DNA barcoding enterprise’ by Ebach (2011), Zootaxa, 2011, 88, 85–88.
[80] Liu S., Li Y., Lu J., Su X., Tang M.,Zhang R., et al, SOAP Barcode: Revealing arthropod biodiversity through assembly of Illumina shotgun sequences of PCR amplicons, Methods Ecol. Evol., 2013, 4, 1142–1150. (doi:10.1111/2041-210X.12120)