Exchanges
Exchanges
CLIVAR is an international research programme dealing with climate variability and pre-dictability on time-scales from months to centuries.
July 2006 No 38 (Volume 11 No 3)
CLIVAR is a component of the World Climate Research Programme (WCRP). WCRP is sponsored by the World Meteorological Organization, the International Council for Science and the Intergovernmental Oceanographic Commission of UNESCO.
Editorial
This edition of Exchanges is a general one affording the opportunity to provide a
broader summary of activities than usual, including the meetings of CLIVAR’s Indian
Ocean and Pacific Panels, background to the the African Monsoon Multidisciplinary
Analysis (AMMA), the development of a new US CLIVAR Working Group on the
Madden-Julian Oscillation and outcomes of the 14th meeting of the CLIVAR SSG
in Buenos Aires in April. In addition we feature some recently received papers on
CLIVAR-relevant science in Australia, India and South America, a summary of the
outputs of the European Commission’s ENACT project and a sobering pointer to the
decline in the system of Voluntary Observing Ships. In addition, we have a taste of
the information available on North Atlantic climate in the ICES Report.
SSG-14 was the last for which we had the benefit of Tony Busalacchi as co-chair and
the picture above shows him receiving some momentos of his time with CLIVAR
at the SSG meeting. He will be much missed as co-chair of CLIVAR for his insight,
enthusiasm and energy. His place will be ably taken up by Jim Hurrell in the New
Year (more on which in a later edition).
Finally, it was sad to hear of the death of Kirill Kondratyev a little while ago. A tribute
to him will be found on page 25.
Building on previous successes in meeting its near-term implementation objectives, reflected in the outcomes from the 1st International CLIVAR Science Conference (Baltimore, USA, 21-25 June 2004), CLIVAR is making significant contributions to advancing the implementation of WCRP’s 2005-2015 strategic plan. CLIVAR Scientific Steering Group 13 (SSG-13, Baltimore, USA, 27-29 June 2004) and the CLIVAR assessment, led to a programmatic re-emphasis within CLIVAR on the four major themes of ENSO and other modes of tropical variability, monsoons, decadal variability & the thermohaline circulation, and anthropogenic climate change. These elements provided the focus for exploring the way ahead for CLIVAR during SSG-14 in terms of the development of a Road Map for CLIVAR for future research on exploring climate variability and change on a variety of timescales and how the interactions between the oceans and the atmosphere influence these.
CLIVAR SSG-14 was graciously hosted by Dr Carlos Ereno in Buenos Aires, Argentina from 19-22 April 2006 with financial support from the Argentine Ministry of Science, Technology and Productive Innovation. It concentrated its review of progress in CLIVAR against the four themes and the key role which observations and modelling play in meeting CLIVAR objectives. This was carried out through a series of mini-assessments that consisted of (a) overview papers by SSG members setting out the current status and science needs for each of the four topics followed by (b) round-table CLIVAR panel and working group contributions on how CLIVAR is addressing each theme and (c) discussions, led by “theme assessors”, to develop the elements for a CLIVAR Science Road Map on the 2007, 2010 and 2013 timescales (2013 is the planned WCRP “sunset date” for CLIVAR). A similar approach was followed also for modelling and for CLIVAR ocean observation and synthesis activities, the latter under the general heading of “the role of the oceans in climate”. Scene setting near the start of the meeting included introductions from sponsors and related programmes, projects and activities (WMO/WGNE, WCRP (including GEWEX), IOC, and IGBP. In addition the SSG was briefed on progress with national contributions to CLIVAR in the Netherlands and the US, and with MedCLIVAR and with IGBP IMBER. Science lectures on the GEF Project for the La Plata Basin (by V Barros and J Rucks) and on Regional Ocean Science Activities (by A Piola) were also presented.
Michelle Reinecker’s review of ENSO and other tropical modes of variability revealed the still fundamental gaps there are in our knowledge, and hence our modelling, of the coupled atmosphere-land-ocean system responsible for the dominant modes of tropical variability. CLIVAR is already substantially engaged in this area through the activities of its Atlantic, Pacific and Indian Ocean basin panels and its Working Group on Seasonal to Interannual Prediction (WGSIP). Led by Michelle Reinecker and Axel Timmermann, key elements of a road map for this area were agreed to be (i) to implement, in the Indian Ocean, and to further develop and sustain, in the Pacific and Atlantic, the tropical ocean monitoring arrays; (ii) to seek to realise key planned field experiments (for example, the Tropical Atlantic Climate Experiment (an activity receiving CLIVAR endorsement at SSG-14) and Pacific and Indian Ocean process studies (see the separate reports of the Pacific and Indian Ocean Panel meetings on pages 4 and 6); (iii) through
increased understanding of intra-seasonal variability and predictability, to improve the representation of ENSO and other tropical modes of variability and their global teleconnections in coupled models in time for IPCC AR5; (iv) in parallel, to develop improved seasonal predictions of tropical variability, operational thermocline decadal anomaly predictions and experimental decadal predictions with comprehensive Earth System models and (v) to establish the sensitivity of ENSO to past climate change using paleoclimate proxies and coordinated coupled model experiments.
Because of their societal importance and role in the general circulation of the atmosphere, studies of monsoons form a key component of CLIVAR. Bin Wang reviewed present status from the perspective of the Asian–Australian (AA) Monsoon. A challenge within WCRP is to integrate the various modelling studies within GEWEX and CLIVAR and for the AA monsoon in particular. The SSG heard plans for a new GEWEX activity “Monsoon Asian Hydro-Atmospheric Scientific Research and prediction Initiative (MAHASRI) and for extension of the Coordinated Enhanced Observing Period activity (CEOP-II) which the JSC requested CLIVAR review. Duane Waliser led a small group to develop a CLIVAR monsoon road map emphasising the needs for better understanding and model representations across all monsoon sectors of the diurnal cycle, intra-seasonal variability and the tropical mean state (an issue also identified from an ENSO prediction perspective). Emphasis in the road map was placed on progressive transition from where we are now in terms of research/experimental status to operational systems with increased skill and relevance to applications. On the short to medium timescale there is a need to continue to analyse the outputs from the VAMOS and NAME field experiments and to continue to support and build on the successes of AMMA. An emerging activity, which arose out of a recommendation by the THORPEX/WCRP/ICTP Workshop on Organisation and Maintenance of Tropical Convection and the MJO, held in Trieste in March 2006, is development of the concept of a year of coordinated observing, modelling and forecasting of the topics to address the challenge of organised convection. Such an activity would be joint between THORPEX and other elements of WCRP and could form a WCRP contribution to the UN International Year of Planet Earth in 2008. The SSG were very supportive of this proposal which CLIVAR will seek to contribute to strongly. They asked Duane Waliser to take this forward.
Jochem Marotzke emphasised the crucial need for improving understanding of decadal variability and the meridional overturning circulation (MOC) to meet the key objectives of WCRP. There are considerable uncertainties regarding the mechanisms of decadal MOC variability and in our views of whether the MOC is changing/slowing. Key research needs emerging from Jochem’s presentation and the road map exercise led by Wilco Hazeleger lie in terms of continued and sustained monitoring of, and the identification of proxies for, the MOC; establishment of the extent to which prediction is possible on decadal timescales; a move to initialisation-based approaches to decadal predictability studies and improved understanding of the mechanisms of decadal-interdecadal MOC variability. Toshio Tokioka presented Bryant McAveney’s paper on “Directions for Earth System Modelling” as a contribution to the
Summary of CLIVAR SSG-14 – Development of a CLIVAR Road Map
CLIVAR metrics
• New resources enabled by leveraging off of CLIVAR efforts, (e.g. $15M GEF funding of LPB, ESF MedCLIVAR, Climate Process Teams, AR4 analyses)
• Improvements in:
1. the spectral character (i.e. spectral power, frequency) and
2. predictability of ISO, seasonal, interannual, and decadal variability in coupled models • Number of global ocean observation deployments
and transition of process study and research observations to operational status (e.g.TAO)
• Reduction of uncertainty in climate models, bias reduction, and the number of new parameterizations incorporated into operational models (e.g. CPT on marine stratus, VOCALS)
• Metric tracking capacity building within and incorporation of developing nations into CLIVAR activities (e.g. efforts within VAMOS, VACS, AAMP)
• Global and regional data products enabled by CLIVAR (e.g., global ocean data reanalyses, African Climate Atlas) discussion on anthropogenic climate change (ACC). The paper
stressed the critical need to develop ever more complex Earth system models. New understanding of aerosol effects, carbon cycle dynamics and cryosphere changes is pushing projected temperature increases towards the upper end of the previously published IPCC range. Key roles for CLIVAR will be to determine how important these amplifying effects are, to foster a more compete approach to studies of the role of feedbacks in the climate system and to develop convergence of the earth system approach with IGBP. In leading the discussion of ACC in the CLIVAR context, Tim Palmer focussed on the particular need to establish better the impacts of anthropogenic forcing on natural modes of variability. He proposed development of a pan-CLIVAR review paper based on AR4 integrations and atmosphere/ocean data analysis on the 2007/8 timescale with a similar activity towards the end of CLIVAR but based on IPCC AR5 Earth System Model integrations. Issues of WCRP modelling strategy (including the “seamless modelling” concept) and the optimal way of organising ACC research post CLIVAR would also need to be addressed. A key element of the timeline is of course that for IPCC AR5, which WGCM is already turning its thoughts to in terms of future scenario development.
Modelling and prediction lies at the heart of many CLIVAR activities. Presentations on the current status of coupled climate modelling, global ocean modelling and seasonal to interannual prediction were given by Jerry Meehl, Stephen Griffies and Ben Kirtman respectively. The way ahead in terms of a CLIVAR roadmap was developed from the perspective of complex Earth system models by Pedro Silva Dias with regard to (i) data assimilation for initial and boundary conditions; (ii) ensemble forecasting (iii) improved integration of regional and global modelling and (iv) theoretical studies on the non-linear coupling between the time and space scales of the various components of the Earth system. He saw (i) to (iii) above as being at the R&D stage at present. Transfer of techniques to operational prediction centres will provide a key metric for success. WGCM will provide the clear lead for WCRP’s collaborative development of Earth system models with IGBP Key medium term priorities for CLIVAR in terms of modelling include (a) finalisation of the WGSIP’s Seasonal Model Intercomparison Project; (b) building on this, realisation of the major seasonal prediction experiment under the JSC Task Force for Seasonal Prediction, management of
which will pass to WGSIP in 2007, and (c) developing wider community involvement in Working Group on Ocean Model Development’s Coordinated Ocean-ice Reference Experiments. The SSG continues to encourage CLIVAR’s regional panels to coordinate activities to analyse these global runs and the outputs from the IPCC AR4 dataset.
Ed Harrison (chair, Ocean Observing Panel for Climate, OOPC) opened the session on the ocean’s role in climate from the perspective of CLIVAR’s role in the development of the global ocean observing system and products, including synthesis activities through ocean reanalysis. Detlef Stammer provided a review of Global Synthesis and Observation Panel (GSOP) activities in this area, including proposals for a global synthesis evaluation framework to determine the quality of analysis/synthesis products and assess their usefulness for climate research. David Legler led the road map activity from the ocean observation perspective. He emphasised the need for CLIVAR to (i) continue its close cooperation with OOPC through its ocean basin panels and GSOP; (ii) complete and validate multiple global reanalyses (especially in time for IPCC AR5) and (iii) stimulate international activity to evaluate the current state and development vector of the global ocean observation system. We should aim, by the end of CLIVAR, to have developed a global description of subsurface ocean variability and to have in place a permanent and truly global ocean observation system. Both of these would be key legacies of CLIVAR, a theme which Bob Weller subsequently picked up on. In particular it was suggested that a post-CLIVAR legacy would be the initiation of an “ocean data synthesis decade” built on the modelling and observational tools developed through the CLIVAR period. A key issue for CLIVAR is to firm up on its overall data legacy and to develop activities which bring this together.
Surrounded by lush Hawaiian jungle, fighting mosquito bites and repelling fierce centipede attacks, the International CLIVAR Pacific Panel and a number of international guests met for three days (February 15-17th, 2006) in the beautiful Manoa Valley in Honolulu. The main objectives of this jungle retreat were to identify new scientific key thrusts and to discuss observational programs such as VOCALS, PUMP and SPICE (see below) which are presently in their planning stages.
The panel members are Magdalena Balmaseda (ECMWF, UK), Scott Power (BoM, Australia), Toshio Suga (Tohoku University, Japan), Dongxiao Wang (SCSIO, China), Rodney Martinez (CIIFEN, Ecuador), Bi Qiu (UH, USA), David Neelin (UCLA, USA), Bill Crawford (IOS, Canada), Alexandre Ganachaud (IRD, New Caledonia), Amy Clement (RSMAS, USA), Wenju Cai (CSIRO, Australia) and Dick Feely (PMEL, USA). The panel is chaired by Axel Timmermann (IPRC, Honolulu, USA) A number of invited international guests gave presentations on ongoing theoretical and observational research activities in the Pacific (Fei-Fei Jin, Jay McCreary, Kelvin Richards), and Indian Ocean (Gary Meyers, Bin Wang). New panel members were also introduced to the international CLIVAR structure (Tony Busalacchi), and to the new structure of US CLIVAR (David Legler) and new NOAA initiatives within the Pacific Ocean (Mike McPhaden, Howard Diamond). Furthermore, the panel discussed the scientific justification of new field programs such as: the South Pacific Circulation and Climate Experiment (SPICE) (presented by Lionel Gordeau) focusing on the southern Pacific western boundary currents; the Pacific Upwelling and Mixing Physicis Experiment (PUMP) (presented by Billy Kessler) – a process study on mixing in the eastern equatorial Pacific; and the VAMOS Ocean Cloud Atmosphere Land Study (VOCALS) (presented by Roberto Mechoso) focusing on the air-sea-land interactions in the south-eastern tropical Pacific. New directions for the next-generation of ocean models were presented by Stephen Griffies.
One of the focal points of the discussions and presentations was ENSO dynamics. The eastward propagating SST-westerly wind burst coupled instability, its role in triggering large El Nino events and its relevance for seasonal predictions was discussed thoroughly. In particular the effect of this type of instability in generating spread in ensemble forecasting was highlighted. Another key aspect of modulating ENSO activity is the annual cycle in the eastern equatorial Pacific which is mostly controlled by meridional, rather than by zonal SST gradients. Further theoretical and modeling work was recommended to elucidate the mechanisms which are responsible for controlling the amplitude of ENSO and its sensitivity to climate change. Fei-Fei Jin presented some theoretical work suggesting that at each point in parameter space ENSO is not just a single mode but rather consists of a combination of two modes: a biennial and a 4-year mode (in addition to the known SST modes). This new perspective may help to explain the diversity of ENSO behavior in the observed record. Furthermore, Fei-Fei Jin proposed a new semi-empirical ENSO instability index which can be directly estimated from observations as well as from coupled models. The panel recommended using this index as a standard index for CGCM evaluations.
Scott Power gave a presentation showing that ENSO can drive variability off the equator that is actually more predictable than ENSO itself. This arises because ocean thermodynamics and
dynamics in the region act as a low pass filter on the ENSO forcing. He used the same processes to explain why decadal ENSO-like patterns have a broader meridional structure than their interannual counterparts. Magdalena Balmaseda showed the current status of ENSO forecasting. Operational ENSO prediction with the multi-model approach now produces reliable seasonal forecasts, but it is usually at the expense of large ensemble spread. Increasing the forecast resolution can only be achieved by improving the quality of the individual forecasting systems. Crucial problems common to many forecasting systems are initialization shocks, weak MJO-ENSO interactions and errors in the simulated ENSO statistic. Some of these problems can be alleviated by short-term practical fixes such as flux correction or anomaly assimilation, but fundamental long-term solutions are still needed. Better coupled models and more balanced ocean-atmosphere initialization procedures are required. Ensemble strategies other than the multi-model, such as stochastic physics, should be explored. In recognition of our imperfect understanding of ENSO dynamics and in the light of the relatively slow progress in improving seasonal predictions, the panel proposed to organize an international ENSO meeting in Australia in late 2007.
Societal aspects of tropical climate variability were discussed by Rodney Martinez who presented an overview of how climate information percolates down to decision makers in South America. He mentioned the current applications on agriculture, health, climate disaster related management and other sectors. There are a lot of gaps between users and climate information producers. Considering the current societal needs is important to seasonal forecast development in Latin America, which combines dynamical and statistical methods. The impact of MJO and decadal variability in regional and local forecasting must be addressed to contribute more reliable products and applications to users. One of the main challenges in the Eastern Pacific which is directly related with social and economic impacts is to improve the understanding of coastal processes, mesoscale structures and convection mechanisms associated with global and regional circulation patterns. The presentation also raised the general question of who is most profiting from climate forecasts. Scott Power showed that the impact of ENSO is not always linear in all locations (e.g. in Australia and the SW U.S.), and this needs to be considered in the provision of climate services. These issues need to be further considered by the climate forecasting community, and will be addressed in the proposed 2007 ENSO meeting.
Akio Kitoh gave a detailed description of the climate projection uncertainties in the Pacific as simulated by the multi-model ensemble of greenhouse warming simulations conducted for the Fourth Assessment Report of IPCC. The presentation showed that many of the state-of-the art coupled general circulation models exhibit severe biases in the tropical mean state, the annual cycle and ENSO variability. One of the key systematic biases in the tropical eastern Pacific is the equatorial cold bias as well as the south-eastern tropical Pacific warm bias. Different hypotheses were discussed for the origin of these biases. While the cold bias might be due to a lack of resolved tropical instability waves in CGCMs or an unrealistic representation of light attenuation in the water column, warm biases in the south-eastern Pacific might be due to under-represented stratus cloud-SST feedbacks, lack of ocean eddies, or problems in
Axel Timmerman and the CLIVAR Pacific Panel Corresponding author: [email protected]
simulating the strength of oceanic Tsuchiya jets that upwell near the Peruvian coast. Roberto Mechoso’s presentation of the new field program VOCALS which is strongly endorsed by the CLIVAR Pacific Panel, is aimed at targeting some of these questions. Also the new research program PUMP addresses some of these issues by focusing on the role of mixing in setting up the mean thermocline and its variability in the eastern equatorial Pacific. The CLIVAR Pacific panel recommended establishing closer ties between PUMP and VOCALS, since equatorial processes may influence the south-eastern Pacific via the atmosphere or changes in the heat divergence as well as the other way round, via eddy-heat transports and atmospheric circulation anomalies. Another key area for the global climate system is the western tropical Pacific warm pool which affects the strength of the Walker circulation and the position of the stationary wave patterns in the extratropics. In recent years, the general interest in temperature regulation in this area has decreased although fundamental questions on thermostats still remain unsolved. Owing to a delicate balance between radiative effects, latent cooling and ocean heat transport the average heat flux in the warm pool area for present-day conditions is close to zero. However, paleo data reveal that the warm pool area was about 4 K colder under glacial conditions than presently, suggesting that the delicate heat balance in this area is subject to long-term changes. Concern on the future temperature evolution in this area has been raised by the panel. Climate modeling uncertainties in this area are also large, thereby prohibiting an accurate assessment of the warm pool’s role in global climate change. The panel recommended that more targeted field-programs have to be conducted to address these crucial questions and was strongly supportive of the ongoing and planned activities of the South China Sea Institute in launching extensive field campaigns in this area as presented by Dongxiao Wang.
Western boundary currents play an essential role in releasing heat originally coming from the tropical oceans to the atmosphere. They play a key role in modulating regional climates in Japan and Australia, as well as global climate. Wind-stress changes can lead to substantial changes in the position of the fronts accompanying these western boundary currents causing large temperature anomalies which may eventually influence also the atmospheric circulation. The very successful field program, the Kuroshio Extension System Study (KESS), has addressed some of these issues in the Kuroshio area and Bo Qiu’s presentation on decadal changes in this region led to a discussion on the potential long-term predictability of thermocline anomalies in the western North Pacific. The panel decided to evaluate the hindcast/forecast skill of simple ocean prediction models driven by observed wind-stress anomalies as well their potential use for society. Toshio Suga discussed the role of eddy formation and mode waters in the climate of the North Pacific. Satellite data, as well as hydrographic data have helped jointly to disentangle some of the complex interactions between flow fields and temperature anomalies in the North Pacific as highlighted by Bill Crawford. The aim of the newly suggested field program SPICE is to understand the dynamics of the southwestern boundary currents as well as their influence on climate. Lionel Gordeau gave a convincing presentation on the scientific and technical challenges of such an endeavor. Physical aspects of subtropical-tropical connections in the South Pacific involving the western boundary currents were outlined by Kelvin Richards. Alexandre Ganachaud is actively involved in the planning stages of SPICE. The panel recommended establishing closer links to the KESS community to learn from their experience of an analogous experiment in the North Pacific. While SPICE is focusing mostly on the
subtropical gyres, a link should also be established to ongoing activities in China to monitor the low latitude western boundary currents (LLWBCs). Furthermore, the relevance of these boundary currents in the overall meridional oceanic heat transport needs to be re-assessed using ocean general circulation model simulations. Fritz Schott pointed out that the role of meridional heat transports associated with the LLWBCs is captured differently in different ocean assimilation products such as SODA-POP and ECCO. These results need to be reconciled soon using forced OGCM simulations.
Pan-oceanic connections were discussed by Wenju Cai and Axel Timmermann. Wenju Cai focussed on the supergyre in the southern hemisphere as well the oceanic connections between the Pacific and the Indian ocean via Godfrey’s Island rule, Axel Timmermann presented results from the CMIP-2 waterhosing experiments which suggests that a weakening of the North Atlantic meridional overturning circulation leads to a southward shift of the ITCZ in the Atlantic and the Pacific with important consequences for the meridional SST gradient, the annual cycle and ENSO. These oceanic and atmospheric teleconnections between the ocean basins will be a major topic of the CLIVAR workshop on multidecadal to centennial climate variability which will be held in Honolulu from November 15-17th 2006.
Climate change issues in the Pacific were discussed by Amy Clement, Wenju Cai and Akio Kitoh. Amy Clement’s presentation sketched how our understanding of paleo-climate can be used to assess future paleo-climate sensitivities. This linkage between PAGES and the CLIVAR Pacific panel will be consolidated in near future. The influence of the radiative forcing of aerosols has been estimated by Wenju Cai and colleagues. Most interestingly, the aerosol forcing can account for 0.6-0.8 K cooling in the central equatorial Pacific with the subpolar North Pacific subject to more than 1K cooling due to direct aerosol forcing. This may have compensated some of the greenhouse warming signal in the Pacific Ocean and its polar amplification. Akio Kitoh pointed out that climate modeling uncertainties for future climate change projections are still very large and exacerbate regional assessments of future climate change in the Pacific. An intense debate started on the question whether all CGCM greenhouse warming simulations should be treated equally by the IPCC or whether metrics can be introduced which lead to a weighting within the multi-model ensemble of CGCMs. Aristocratic and democratic viewpoints were put forward but no conclusion could be reached. Another important problem of climate change is that of the sources and sinks of carbon dioxide. Dick Feely presented results from the most recent field programs in the Pacific, illustrating that the interannual and interdecadal trends of surface water pCO2
variability show significant large-scale spatial differences due to natural variability and anthropogenic impacts on atmosphere-ocean CO2 fluxes.
The Third Session of the CLIVAR /GOOS Indian Ocean Panel
After a sudden change of venue in order to avoid the outbreak of Chikungunya fever in La Reunion, the Indian Ocean Panel ended up holding its third session in Honolulu, Hawaii USA, on 27 February – 2 March 2006.
The Indian Ocean Panel was established in 2004 and its primary goal was to prepare a regional implementation plan for sustained observations relevant to climate. The implementation plan was published just before the panel meeting (WCRP Informal Report No. 5/2006 and GOOS Report No. 152) and can be downloaded from http://eprints.soton.ac.uk/19645/
Some important scientific advances were presented during the meeting. There are a number of studies now that point toward the important (and often subtle) impacts of Indian Ocean Sea Surface Temperature (SST) on climate on a global scale. There are three places in the Indian Ocean where the thermocline is shallow enough to allow for significant dynamical feedback to SST. They are the upwelling regions off Somalia and Sumatra/ Java and the ridge in the thermocline near 5-10°S. These places are important because slowly evolving features like Rossby and Kelvin waves and major currents can alter SST, interact with the atmosphere and affect Pacific SST and climate as far away as North America. Model results suggest that the development of ENSO can be influenced by Indian Ocean SST. The idea is that Indian Ocean SST does not cause ENSO but sometimes influences how it evolves.
Results of IOD-ENSO forecast experiments using the GFDL coupled model and SINTEX-F model show that past Indian Ocean Zonal Dipole Mode (IOD) events demonstrate a possible predictability with a lead time of about six months, although there is significant influence of the predictability barrier during winter and spring seasons. It seems that some but not all IOD events are predictable. The southwest tropical Indian Ocean is emerging as an important region for climate variability with potential predictability because of the thermocline ridge 10-15°S. Large ocean Rossby waves in response to ENSO and/or IOD propagate into the region and induce SST anomalies associated locally with precipitation and tropical cyclone activity. The transit time for these ocean waves across the basin is about one year, a delay that gives rise to enhanced predictability in the region.
The Indian Ocean ocean-atmosphere exhibits energetic intraseasonal SST variability. Intraseasonal variations are the building blocks of monsoons and understanding the heat budget of the upper ocean, particularly the mixed layer, at intraseasonal time scales is a critical area of research. There is no doubt the ocean responds to the atmosphere at this time-scale. For example, there is substantial sub-seasonal SST variability - O(1-2°C) - in the southwestern Indian Ocean thermocline ridge. Strong Ekman pumping raises the thermocline close to the surface and affects SST, as well as surface fluxes. Model experiments suggest 3-D oceanic processes and active ocean-atmosphere coupling occur during these events. But the role of ocean-to-atmosphere feedback at this time scale remains uncertain. Continuous time series are required for monitoring these events and one of the key reasons for establishing a basin-scale form mooring array with upper ocean temperature, salinity and current measurements.
All of the available MBT, XBT and hydrographic temperature profiles for the Indian Ocean during the 20th century are now assembled into a new, high quality, flagged data set called the
Indian Ocean Thermal Archive (IOTA). A preliminary analysis of the linear subsurface temperature trend using IOTA in the tropics from 1960 to 2000 shows warming of the surface layer and cooling in the depth range of the thermocline, i.e. increased stratification. Analysis of the subtropical and sub-antarctic region shows a warming trend extending to considerable depth, >500m.
A preliminary analysis of OA-flux - a newly developed surface heat flux dataset which integrates satellite observations with surface moorings, ship reports, and atmospheric model reanalyzed surface meteorology - and other products pre-dating the satellite period found that the amount of the net heat gain received by the tropical Indian Ocean has been reducing due to an increase in evaporation. Surprisingly, surface heat fluxes alone cannot explain the warming trend observed in much of the tropical Indian Ocean surface layer.
The panel reviewed the progress in implementing a basin scale mooring array and a multi-platform observing system in order to understand the role of the Indian Ocean circulation and structure in interactions between the IOD, ENSO and the monsoons. JAMSTEC (Japan) will maintain three TRITON moorings and an ADCP near the equator at 90-95°E. NOAA (USA) will maintain ATLAS moorings at 1.5°N, 0°, and 1.5°S along 80.5°E and at 0°, 90°E and an ADCP near 0°, 80°E. DoD (India) will maintain three moorings on the equator at 77°, 83° and 93°E. The meteorological measurements at the moorings will also be extremely valuable to weather forecasting, data assimilation issues and weather-reanalysis efforts. At present there are few such measurements in the Indian Ocean and this lack of information prevents accurate initial condition determination of weather forecasts and limits reanalysis efforts.
INCOIS (India) hosts the regional Argo data centre and coordinates float deployments and implementation activities. The Argo floats should eventually provide seasonal to interannual temperature and salinity fields. The mapping accuracy using the fully implemented Argo profile data was demonstrated by observing system simulations. Argo floats are needed to monitor the region south of 20°S. Advice on the regional implementation of Argo was passed to the International Argo Science Team.
The Panel identified the XBT lines that have highest priority for implementation. The Indian Ocean XBT network was enhanced to improve observation of oceanic structure related to Indonesian Throughflow and inflow to the western boundary cross equatorial currents.
The Panel reviewed the progress of the INSTANT experiment which aims at designing a monitoring array for mass, heat and salt transports in the Indonesian Throughflow. Data from the first 18 months have been collected and an additional 18 months are expected after the final recovery in December 2006. The data will be used to determine cost-effective proxy methods for long term monitoring.
The ability of a 5°x5° network of drifting buoys (drogued at 15m depth) to be maintained in the Indian Ocean given the divergent current systems existent in that region was explored using observing system simulation experiments. Even with targeted deployment, certain regions remained opaque to drifters: the upwelling regions off Somalia and Java during the Southwest monsoon. It is found that the divergence of drifters and the
oceanic eddies substantially impact the ability to reconstruct surface currents solely from drifter tracks. The 5ox5o sampling
of drifters cannot resolve most of current and temperature variability except for large-scale meridional advection in the South Indian Ocean.
The Panel coordinated the planning of two research vessel based process studies on ocean-atmosphere interaction in intraseasonal variability—MISMO in the eastern Indian Ocean and VASCO/CIRENE in the western Indian Ocean. MISMO will be conducted in October - December 2006, focusing on the atmospheric evolutions in association with the intraseasonal disturbances known as the MJO (Madden-Julian Oscillation) and the ocean responses to the MJO events. Further information on MISMO can be found at http://www.jamstec.go.jp/iorgc/ mismo/.
The VASCO-Cirene experiment will take place from the beginning of January until mid-February 2007. The ship campaign, within the western Indian Ocean will be synchronized with the meteorological measurements based on balloons launched from Seychelles. One ATLAS mooring
US CLIVAR Madden -Julian Oscillation Working Group (MJOWG)
D.E. Waliser1 and K R Sperber2
1Jet Propulsion Laboratory, Pasadena, U.S.A.
2Lawrence Livermore National Laboratory, Livermore, U.S.A.
Corresponding author: [email protected]
In spring 2006, US CLIVAR established the Madden-Julian Oscillation (MJO) Working Group (MJOWG). The formation of this 2-year limited lifetime WG was motivated by: 1) the wide range of weather and climate phenomena that the MJO interacts with and influences, 2) the fact that the MJO represents an important, and as yet unexploited, source of predictability at the subseasonal time scale, 3) the considerable shortcomings in our global climate and forecast models in representing the MJO, and 4) the need for coordinating the multiple threads of programmatic and investigator level research on the MJO. Near-term tasks involve the development of metrics for assessing model performance in both climate simulation
and extended-range/subseasonal forecast settings, as well as designing and coordinating multi-model experimentation and analysis to diagnose and improve model shortcomings and assess MJO predictability characteristics and present-day prediction skill. In addition, the WG will help to coordinate MJO-related activities across other programmatic bodies (e.g., GEWEX, International CLIVAR, Thorpex) and will explore the applications and potential user base for subseasonal predictions based on the MJO. Workshops that address these issues are being planned, with results being communicated in summary reports and peer-review articles. For additional details, see http://www.usclivar.org/Organization/MJO_WG.html. will be deployed at the beginning of the experiment at the flux reference site at 67°E, 8°S. The ship will then proceed to perform a ~25 day on station cruise in this region of strong intraseasonal perturbation with intensive physical oceanography, air-sea fluxes and atmospheric measurements.
Finally the Panel discussed the establishment of a virtual one-stop shop for integrated management of Indian Ocean climate data, to include data quality control as well as information about access to data. The rationale is to assist with product generation (maps, input to assimilation models, etc.), and to handle data types where Indian Ocean data are not easily aggregated from original data sites. The focus is on the ocean and atmospheric boundary layers with data from: Argo, drifters, moorings, XBT, sea level, ADCP, CTD and bottles. The project will utilise the existing capability at INCOIS and APDRC, as well as the Argo, Mooring and XBT facilities at other sites, and identify the gaps and challenges we face in establishing an integrated activity. More information on the activities of the CLIVAR/GOOS Indian Ocean Panel can be found at: http://www.clivar.org/ organization/indian/indian.php
AMMA and its first International Conference address the West African Monsoon
Jean-Luc Redelsperger1, Chris Thorncroft2, Arona Diedhiou3, Thierry Lebel3,
Douglas Parker4, and Jan Polcher5
1CNRM/GAME CNRS and Météo-France, 2SUNY at Albany, US, 3LTHE/IRD, Niger, 4University of Leeds, UK, 5LMD/CNRS,
France
Corresponding author: [email protected]
The West African monsoon (WAM) is a coupled land-ocean-atmosphere system characterized by summer rainfall over the continent and winter drought. Over the land the effects of the monsoon are most evident over an area stretching eastward from a line between Cameroon in the south and Niger in the north to the west coast of Africa. The annual cycle of rainfall in the West African region is characterized by a poleward migration of peak rainfall up to August followed by a more rapid retreat. It also includes an apparent “jump” in the location of peak rainfall at the end of June from the coastal region around 5oN to about 10oN. The precipitation is provided by the
ubiquitous mesoscale convective systems and synoptic African easterly waves. Ultimately the nature of the surface conditions
over the land (e.g., soil moisture, vegetation) and over the ocean (sea surface temperatures) determine the nature and variability of the WAM on interannual and longer timescales. In addition, the Sahara, just north of the rainy zone, provides an abundant supply of dust which may interact with and impact the intensity of the WAM.
Over the past 50 years the change in West Africa from wet to much drier conditions is among the strongest interdecadal signals of the past century. This drying trend coupled with marked interannual variations has had devastating environmental and socio-economic consequences.
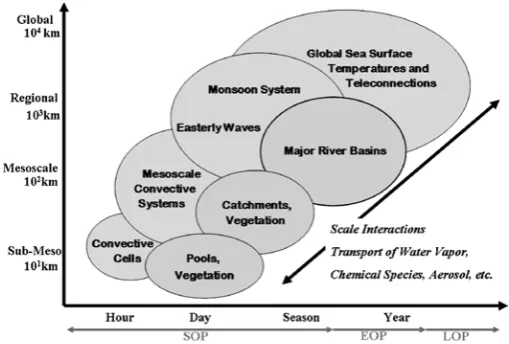
Figure 1: AMMA is structured around four interacting spatial timescales
Particpants at the AMMA First International Conference, Dakar, Senegal, 28 November - 2 December 2005
and modelling of this complex system have limited our prediction skills. To bridge these gaps, the African Monsoon Multidisciplinary Analysis (AMMA) Project, has adopted a multidisciplinary approach, involving substantial international collaboration that links observation, data analysis and modelling on a wide range of space and time scales.
The processes that couple the land, ocean and atmosphere take place in association with multiple interacting space and timescales. To address the multiple scales that characterize the WAM, AMMA is structured around four interacting spatial timescales (figure 1). AMMA is a multi-year project with three nested observation periods, LOP (2002–2010), EOP (2005–2007), and SOP (2006), which stand for the long-term, enhanced, and special observing periods, respectively.
The AMMA Project has three overarching aims: (1) improve our understanding of the WAM and its influence on the physical, chemical and biological environment, regionally and globally; (2) provide the underpinning science that relates variability of the WAM to issues of health, water resources, food security and demography for West African nations and defining and implementing relevant monitoring and prediction strategies; and (3) ensure that the multidisciplinary research carried out in AMMA is effectively integrated with prediction and decision-making activity.
Scientists from more than 30 countries, representing more than 130 institutes are involved in AMMA. AMMA receives funding from the European Union, France Action Programme Inter-organisme and the United Kingdom, as well as the United States and pan-African projects.
The CLIVAR Scientific Steering Group (SSG) endorsed AMMA as one of its key contributing projects in March 2003. AMMA was also approved by the GEWEX SSG as a Continental-Scale Experiment in February 2005. AMMA also has strong links to other international projects, including the International Geosphere-Biosphere Programme International Global Atmospheric Chemistry Project and international Land Ecosystem-Atmospheric Processes Study, and the Global Climate Observing System and Global Ocean Observing System. In collaboration with THe Observing System Research and Predictability Experiment (THORPEX), AMMA is addressing high impact weather prediction and predictability.
The First International AMMA Conference which was held in Dakar, Senegal, 28 November–2 December 2005, was very
successful with 255 participants from 23 countries and more than 300 abstracts submitted. The Conference brought together researchers from around the world working on the WAM and its impacts, to review ongoing research activities and to discuss future contributions and directions within the AMMA research program. It also provided the first real opportunity for establishing and coordinating collaborations at the international level, and in particular with African scientists.
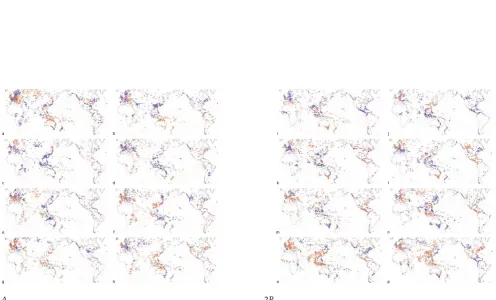
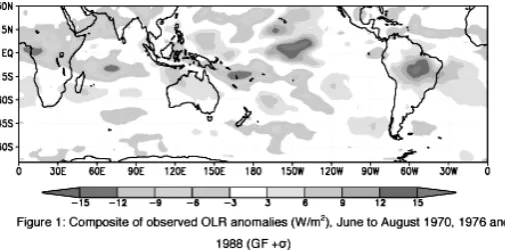
In agriculture many decisions have to be made at sub-seasonal timescales, yet with lead times that go beyond the scope of weather forecasts. This, and the potential to forecast the chances of wet and dry spells that the Madden Julian Oscillation (MJO) offers, is behind the interest in the MJO shown by rural practitioners in Australia. This interest motivated us to conduct the research recently published in GRL (Donald et al 2006) where we investigated the near-global impact of the MJO on rainfall. Here we will provide an updated synopsis of the work reported in GRL, followed by an outline of a rural industry funded R&D project that commenced earlier this year. Analysis of about 30 years of daily rainfall data reveals significant modulation of tropical and extra-tropical rainfall related to the equatorial passage of the MJO. We used the Real-time multivariate MJO (RMM) Index (Wheeler and Hendon 2004) to determine the location and amplitude of the MJO from June 1974 to May 2006, and linked the passage of MJO events with suppressed and enhanced rainfall in the Austral-Asian region and beyond (Figure 1 page 13). The aim was to develop a system with discriminatory ability that bridges weather- climate forecasting gap by providing a risk management tool for tactical decision-making in agriculture.
We calculate associated mean sea level pressure anomalies (MSLP) to determine synoptic scale features that might explain the observed rainfall anomalies (Figure 2 page 13). Standardised aggregated distributions of MSLP anomalies from stochastically generated MJO phases demonstrate the (low) probability of our results being random effect. The methodology follows that outlined in Donald et al (2006), but with up-to-date data. The results suggest that the west to east passage of the MJO across the tropics generates, via teleconnections, global atmospheric responses that enhance or suppress the prospect of precipitation across large parts of the Australasian region and beyond. This information is now available on our experimental web site (www.apsru.gov.au/mjo). Amongst other users, this web site attracts many decision-makers from the grazing industry, largely because Australia’s grazing lands are already threatened by climate variability and climate change. The beef industry is moving north in an attempt to escape ongoing drought and the possibility of further climate change induced rainfall reductions. However, such a shift north might not be sustainable given existing pressures, many of which are related to high climate variability. A repeat of past major degradation events must be prevented to avoid further irreversible damage and hardship. Better quantification and predictions of the onset, duration and termination of the northern Australian wet season would provide critically important information for better decision-making across the grazing industries, but would also have tangible benefits for other agricultural enterprises (grain, sugar, horticulture) and, in fact, other sectors (health, infrastructure development, tourism etc).
The “Enhancing the predictability of the northern Australian wet season” project aims to improve the predictability of onset, duration and termination of the Australian monsoon season by examining the influences of the MJO and ENSO. Knowledge of the tropical and extra-tropical MJO-associated weather states can significantly improve the tactical management of
climate-The MJO and agricultural decision making in northern Australia.
Lexie Donald1, Holger Meinke1, Sarah Lennox1, Matthew Wheeler2, Fiona Lo2, Aline de H N Maia 3
1Deprtment of Primary Industries and Fisheries, Toowoomba Queensland, 2 Bureau of Meteorology Research
Centre Melbourne Victoria, 3 Embrapa Meio Ambiente, Jaguariu ́na, Brazil.
Corresponding author: [email protected]
sensitive systems such as agriculture. Based on this research, an Australian R&D funder (Land & Water Australia via it’s ‘Managing for Climate Variability’ program) is providing resources to operationalise this research and make it an integral part of agricultural decision making. The project aims to offer improved probabilistic wet season predictions, initially targeted towards the specific needs of the Northern Australian grazing industry. However, the information generated will be sufficiently generic so that it can be adapted for use by other (agricultural) sectors and in other regions such as South and Southeast Asia and South America (www.apsru.gov.au/mjo; www.bom.gov. au/bmrc/clfor/cfstaff/matw/maproom/RMM/index.htm; www.bom.gov.au/climate/tropnote/tropnote.shtml). Specifically the project will: 1) reduce climate related risk to agricultural industries (using the grazing industry as a case study) by providing improved quantification and predictions of the northern Australian wet season; and 2) create new technologies for better decision-making in climate sensitive systems of northern Australia. The specific industry driven objectives include probabilistic predictions of the entire wet season rainfall with lead times of 2 months or more. At leads of less than 2 months, the project will provide forecasts of active and break periods within the wet season.
A preliminary systems analysis determining the leverage points for climate information and forecasts has been conducted with grazing industry experts and representatives. This revealed that quantifying the length of the dry season is important information for decision making. It influences many logistical decisions such as staffing, stocking rates and stock movement. Profit margins shift during the dry season, and intraseasonal climate forecasts may help maximise returns and minimise risk. Forecasts about the wet season onset and duration will assist with determination of pasture growth, stocking rates for the subsequent dry season, and the growth rates of young stock.
Acknowledgement:
The project is funded by Land and Water Australia. Any queries to the Project Officer [email protected]
References:
Chang, C.-P in Chang, C.-P., Wang, B. and Lau, N.-C. G. (Eds) 2005. The Global Monsoon System: Research and Forecast. Report of the International Committee of the Third International Workshop on Monsoons (IWM-III) WMO/TD No.1266, TMRP Report No. 70
Donald, A., Meinke, H., Power, B., Wheeler, M. C., Maia A de H. N , Stone, R. C., Ribbe J. and White N. 2006. Near-Global Impact of the Madden-Julian Oscillation on Rainfall,
Geophysical Research Letters, 33, L09704, doi:10.1029/ 2005GL025155
Lorenz D.J. and Hartmann, D.L. 2006. The effect of the MJO on the North American Monsoon. Journal of Climate, 19, 3, 333-343.
Introduction
Kripalani et al (2005) have identified ‘Speed-breakers’ of All India Monsoon Rainfall (AIMR) and stated that Indian summer monsoon variability is partly due to the external surface boundary forcing and partly due to its internal dynamics. They have brought out that the dominance of 3-7 and 10-20 day modes in a monsoon season would favour monsoon activity over Indian region, while the 30-60 days mode would not. They have said that to forecast the behaviour of these intraseasonal modes is still a challenge for the researchers.
It is well known that many efforts have been made earlier to identify these modes through study of different circulation parameters over Indian region. Krishnamurti and Bhalme (1976) have defined nine elements of the monsoon system over India and have shown that a quasi-bi-weekly oscillation existed in these parameters. They carried out a sequential ordering of these in terms of their respective phase angle and showed that in the stabilizing phase, soon after the realization of maximum dry and moist static instabilities, there occurred, in sequence, an intensification of the monsoon trough, satellite brightness, Mascarene high, Tibetan high and the tropical easterly jet, followed by a maximum in rainfall over central India which is primarily associated with monsoon depressions. Dominant modes are also found in the shorter time scales (<6 days) in their analysis. Gadgil (1988) has mentioned that the 5-7 day mode of rainfall variability over central India has been found to be linked to the synoptic scale monsoon disturbances while the 10-20 day mode is associated with the active-break cycle of monsoon rainfall.
While discussing the mechanisms of low frequency oscillation of monsoon system Goswami (1991 and references therein) has opined that the evolution of monsoon circulation from wet to dry conditions over India is associated with the destabilization and stabilization of the atmosphere due to latent heat released in the atmosphere. Also the interaction between the organised convection and the large scale dynamics is responsible for the low frequency oscillations of rainfall. A diagnostic study by Bhide et al (1997), hereafter referred as BR, has brought out the coincidence of the diabatic heat sources and the heavy rainfall zones over the monsoon trough region during the active monsoon phases of the southwest monsoon in 1979 using the data collection of FGGE MONEX-1979. The events of heavy rainfall were associated with transient synoptic scale disturbances in the monsoon trough area. The results have further shown that whenever an intense heat source developed over the western monsoon trough area in the later days of the active phases of monsoon 1979, a positive differential heating gradient developed from east to west. Das (1962) had observed a positive differential heating gradient from west to east for the month of July. Thus, in the later days of active phases, the heating gradient reversed during 1979 and such a reversal was observed due to the westward movement of disturbances from the Bay of Bengal. These disturbances also showed a typical path along more southerly latitudes compared to normal. These observations for 1979 have shown a relationship between the organized convection and the large scale dynamics of the monsoon system in relation to evolution of monsoon circulation from the active to break phases of monsoon 1979 as pointed out by Goswami (1991 and references therein).
U. V. Bhide, S. M. Bawiskar, V. R. Mujumdar, P. V. Puranik, S. P. Ghanekar, N. V. Panchwagh and M. D. Chipade Indian Institute of Tropical Meteorology, Homi Bhabha Road, Pashan, Pune, 411008, India
Corresponding authors: [email protected], [email protected]
On the variability of secondary heat sources over northwest India
In view of the above observations, an effort is made in the present paper to bring out the space-time variations of the secondary diabatic heat sources over the monsoon trough region for the southwest monsoon of 2002, a drought year for India. Kalsi et al (2004) have analysed many regional and planetary scale parameters related to the unusual behaviour of monsoon 2002. They observed a break-like situation in July 2002 when the monthly rainfall departure was as large as -49% from the long period normal. The rainfall deficiency of July was found to be the main cause of the drought in the year. It was unusual for the season that although ten low pressure areas formed over Bay of Bengal, none of them intensified into a depression or storm. Contrary to this during the normal monsoon year 1997, five depressions and a storm formed over the Bay of Bengal. This indicated that the circulation over India remained conducive for good rainfall activity during monsoon 1997. Hence, similar estimation of heat sources and moisture sinks is carried out for monsoon 1997 and the results compared with the drought year 2002.
Data and methodology
Daily NCEP/ NCAR reanalysis data (Kalney et al., 1996) of u,v, T and RH for standard levels between 1000 and 100 hPa for 1 June to 30 September 1997 and 2002, have been used to estimate the apparent heat source (Q1) and the apparent moisture sink (Q2) over India following Luo and Yanai (1984) and Bhide et al (1997). The information on synoptic features and rainfall activity for the two seasons is based on the Weather Reports for June to September 1997 and 2002 published by India Meteorological Department.
Results and discussion
The spatial and temporal variations of the heating rate (q1) and
drying rate (q2), at 500 hPa along 22.5°N across the monsoon
trough for 1997 and 2002 are discussed below through x-t diagrams following BR. The lax-tix-tudinal variax-tion of x-the vertically integrated heat source <Q1> and moisture sink <Q2>
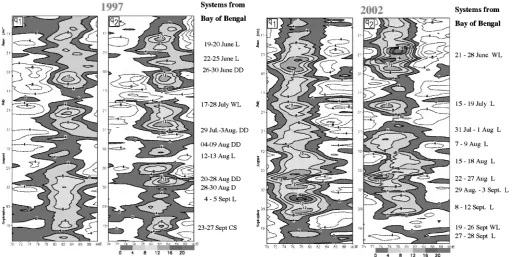
have been studied through y-t sections by averaging their values for the east (80°-90°E) and west (70°-80°E) regions. Figures 1 and 2 show the x-t diagrams of 3-day moving average of q1 and q2 along 22.5°N at 500 hPa for the period from 1 June to
30 September for the years 1997 and 2002 respectively. The low pressure systems which have formed over Bay of Bengal during these seasons are marked chronologically in the figures.
x-t diagram of q1 and q2
The most prominent feature is the repeated occurrence of large positive values of q1 and q2 east of 80°E (Fig. 1) for monsoon
1997. These are generally in association with formation of synoptic scale disturbances like depressions and the cyclonic storm, which formed over the Bay of Bengal. The q1 and q2
values are mainly negative, occasionally noticed to be large negative to the west of 80o E. This indicates that the differential
to the west of 80°E (Fig. 2). This indicates a reversal of the normal heating gradient for the entire monsoon season over India. Peculiarly the reversed gradient is very strong around 26 June, 18 July and 25 August. In the period 21 to 28 June 2002 a well marked low pressure area moved from the Bay of Bengal towards northwest India, keeping a more southward track. Different subdivisions of India located around 20°-25°N and west of 80°E showed Weekly Rainfall Departures of as much as 300-400% in this period due to the movement of the well marked low (Weekly Weather Reports, IMD, 2002). Though this was only a well marked low pressure area daily rainfall amounts reported by some stations were observed to exceed 30 cm between 26 to 28 June in the western trough region. One station, Bhavanager, reported 42 cm of rain on 28 June. This shows that the diabatic heating is due to organized cumulus clouds in presence of a transient synoptic system. The second low pressure area which formed over the north Bay region on 15 July also moved across the monsoon trough but its life cycle was shorter compared to that of June. It is remarkable that during this period, even if the all India rainfall was deficient, ranging from 40 to 60 percent of the long term daily normal, the north west of India, its adjoining Arabian sea region and north peninsular India shows good cloudiness in the satellite images. During this period the x-t diagram also shows a marked reversal of heating gradient around 18 July (Fig. 2). Following these two events, a substantial decrease is observed in heating rates (q1) on the western part (Fig. 2) for about ten days. In these
epochs the q2 values are observed to become negative practically
for the entire longitudinal belt. The negative q2 values are very
large on the western and eastern ends of this belt. Such a change in the values of q1 and q2 indicates two epochs of suppressed
convection over the monsoon trough region in July 2002. India experienced unprecedented below normal rainfall, -49% of the normal, for July 2002. The very large deficit in rainfall over
India for July 2002 has thus resulted from 2 epochs of break-like situations when circulation got disturbed. The monsoon did not revive even with the formation of a low pressure system over the Bay of Bengal on 15 July. The large positive q1 and q2
values between 15 and 20 July, observed west of 80°E, seem to be associated with the eastward moving cyclonic vortices. From the beginning of August, the heating and drying rates are observed to become positive and are also observed to spread over most of the belt covering 70° to 90°E. By 15 August the monsoon covered the entire country with a delay of about one month for the westernmost parts of India.
Monsoon 2002 showed a unique feature in the long historical records for India and that is the absence of monsoon depressions/storms over the entire season. The low positive or negative heating and drying rates for the eastern region of the monsoon trough over India for 2002 during July as well as August and September reflect this peculiar feature of the season (Fig. 2). During the season only five out of ten low pressure areas had a long life while others had a short life cycle. Contrary to this, presence of the large positive q1 and q2 values for the east
region during monsoon 1997 (Fig.1) reflects frequent formation of monsoon depressions/storms in the season. Large q1 and
q2 values have been observed in the presence of monsoon depressions and the storm for monsoon 1979 over the east region at the beginning of the two active phases of monsoon 1979 (BR).
y-t sections of <Q1> and <Q2>
Figures 3 and 4 (page 14) show the y-t sections of daily vertically integrated heat source <Q1> and moisture sink <Q2> averaged
over the east and west regions of India for monsoon 1997 and 2002 respectively. These figures show different persistent zones having positive values of <Q1> and <Q2>. In these zones
there are many occasions when the <Q1> and <Q2> values
are simultaneously large positive. Development of a diabatic
[image:11.595.41.557.477.734.2]Figure 1 : x-t diagram of heating rate (q1) and drying rate (q2) at 500 hPa level along 22.5°N during I June to 30 September 1997, between 70° to 90°E. The counter interval is at 4°C day-1. (L : low pressure area, WL : Well marked Low pressure area, D : Depression, DD : Deep Depression, CS : Cyclonic Storm)
heat source, due to cumulus clouds, is indicated by such a coincidence of large <Q1> and <Q2> values in these zones.
Generally, cumulus clouds are organized in these events by synoptic scale disturbances. The latitudinal location of such a zone around 20°N is supposed to represent weather conditions of the monsoon zone (denoted by M) for both the east and the west regions of India. The latitudinal belt around 27.5°N on the east region is denoted by T to represent the convective activity over southern Himalayas or southern Tibetan region. The y-t sections for the west region show positive <Q1> and
<Q2> values, north of 27.5°N which seem to be associated with
presence of two types of systems, viz., eastward moving lows or cyclonic circulations induced due to eastward moving westerly waves in the mid-latitudes and west-northwestward moving monsoon systems from Bay of Bengal. This zone is hence denoted C. There is an intermediate zone of negative values of <Q1> and <Q2>, denoted as Q1NG and Q2 NG respectively.
For the east region, Q1T (Fig. 3a page 14) and Q2T (Fig. 3b) are narrow for monsoon 1997 while very broad for 2002 (Fig. 4a, page 14 and b). As far as the intensity of the vertically integrated heat source and moisture sinks, <Q1> and <Q2>, is
concerned a remarkable difference is observed between the two seasons. Many events of very large <Q1> and <Q2> values for monsoon 2002 are indicative of many events of heavy rainfall over southern Tibetan region. Normally heavy falls of rain occur in and near Himalayas during monsoon breaks under the influence of eastward moving troughs in westerlies further north (Rao, 1976). It is noteworthy that Kalsi et al (2004) observed the frequent passage of eastward moving cyclonic circulations throughout the monsoon season of 2002. During monsoon 1997, events of coincident heat source and moisture sink are less and their intensity is low compared to monsoon 2002 in the Q1T and Q2T zones for the east region (Fig. 3a and b). This indicates that the rainfall activity over Tibetan region was less during monsoon 1997 as compared to that for monsoon 2002.
The zones Q1M and Q2M show that for the east region during
1997 (Fig. 3a and b), the heat source and the moisture sink in the monsoon zone was frequently intense around 20°N. Also positive values of <Q1> and <Q2> are found to extend
southward and northward from these zones. This indicates that the monsoon zone is quite broad during the events of intense convection. Due to this, the latitudinal extent of zones of heat source and moisture sink covers a very large portion of Indian region. Contrary to this, the Q1M and Q2M zones are narrow
during monsoon 2002 (Fig. 4a and b).
For the west region, Q1M and Q2M zones show contrasting
features for the two seasons with respect to intensity of heat source and moisture sink. During 1997, the heat source and moisture sink are weak and are found to be disorganized within the monsoon zones (Fig 3). While, during monsoon 2002, persistent zones of heat sources and moisture sinks are observed. Occasionally, in association with movement of synoptic systems, coming from the Bay of Bengal towards northwest India, the heat source and the moisture sink is very intense during the season (Fig 4). It is remarkable that during monsoon 2002, most of the westward moving low pressure systems took a more southward path than normal and decayed south of about 25°N. Contrary to this, monsoon depressions of July and August 1997 reached up to 30°N, over northwest India as weak systems. This variation in the tracks of the systems during the two seasons seems to be responsible for the difference in the pattern of <Q1> and <Q2> values over the
west region. It can be noticed that as result of the absence of convective rainfall during July 2002, the <Q2> values are much
smaller compared to <Q1> values.
Kalsi et al (2004) have noted the existence of a Tibetan Low/ vortex, centered around 33°N and 85°E at 600 and 500 hPa levels in the monthly mean wind patterns for July 2002 and have linked this vortex to the frequent presence of eastward moving systems along the southern Himalayas during monsoon 2002. In the present study, the repeated occurrence of high values of the heat source and moisture sink in the zones Q1T and Q2T
(Fig. 4) reflect such frequent passage of vortices. The absence of this feature during monsoon 1997 implies that the influence of mid-latitude westerly troughs was greater for monsoon 2002 over southern Tibet as compared to 1997. High positive <Q1>
and <Q2> values for the east region in the Tibetan zone are
associated with reduce convection in the monsoon zone in 2002. Intense negative values of the heat source and the moisture sink in Q1NG and Q2NG zones indicate more subsidence over
the northern part of the monsoon trough region in association with the enhanced convection in the Tibetan zone.
Circulation changes over India during monsoon 1997 and 2002
The mean circulation pattern at 500 hPa showed very pronounced circulation changes from active to break phases of monsoon 1979 (BR) as compared to the other levels of the lower or upper troposphere over Indian region. Hence, the circulation changes are studied through y-t sections of daily average vector wind for 500 hPa for monsoon 1997 and 2002. Salient features of circulation changes observed for the two seasons are as follows.
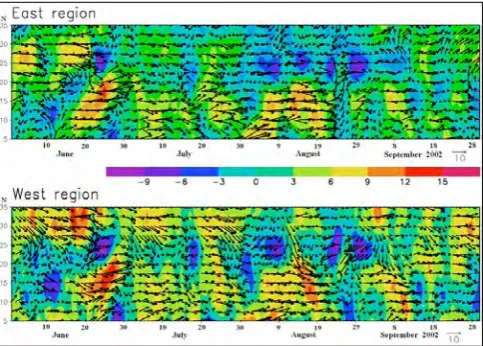
y-t section of daily vector wind at 500hPa
Figures 5 and 6 (page 14) show the y-t sections of the vector wind for the east and west regions for 1997 and 2002 respectively. The scalar analysis of u (the zonal component of the wind) is superimposed. A comparison of these figures shows that during the peak monsoon months, July and August of 1997, there are many periods of strong monsoon westerlies (easterlies) to the south (north) of about 20°N for both the east and the west regions (Fig. 5). Monsoon depressions formed during these periods and many out of them intensified as deep depressions. Such a wind field indicates many long active phases of the monsoon over India during 1997, when the monsoon circulation remained undisturbed. Contrary to this, westerly flow is observed to cover the entire belt from 5° to 35°N during July 2002 except around 15 July (Fig. 6). Strong shears are observed around 25 June 2002 at 500 hPa indicating the presence of a cyclonic vortex in the east as well as the west region. A well marked low pressure system had traveled across the monsoon trough from the east to the west region after its formation over the Bay of Bengal on 21 June 2002. Such a vortex having a very strong circulation was found to be decay quickly over the western region by the end of June and subsequently, the entire Indian region came under the grip of westerly flow. Thus, the event of reversal of the heating gradient around 25 June as seen from figure 2, is found to be followed by significant circulation changes at 500 hPa (fig. 6). This sequence of events resembles the observations made by BR during monsoon 1979.
A weak vortex, noticed around 15 July (Fig.6), over east and west regions did not recover the monsoon activity since westerly/northwesterly flow is again seen to spread over the entire belt (5° to 35°N) in the subsequent period. This is the second time when the monsoon circulation became weak after reversal of the heating gradient this time (around 18 July) due to intense heating rates seen at 500 hPa on the western side of 80°E (Fig. 2). The break-like situation in July 2002 seems to have resulted due to these two periods when westerly winds dominated the entire Indian region, following two events of
a b
c d
e f
g h
i j
k l
m n
o p
[image:13.595.59.348.114.386.2]2A 2B
Figure 1: Austral Winter RMM Phase 1 Rainfall and MSLP anomalies. Rainfall anomalies (positive anomalies; enhanced rainfall; blue tones, negative anomalies; suppressed rainfall; red tones) correspond to MSLP anomalies (high pressure; positive anomalies; red tones, low pressure; negative anomalies; blue tones).A positive MSLP anomaly stretching from southern Asia, across the Maritime Continent and Australia to the western coast of South America is reflected by negative rainfall anomalies. Rainfall is suppressed throughout Asia and Australia in the region of the high pressure anomalies. Western Indonesia evidences rainfall enhancement, possibly maintained by local equatorial easterly anomalies (Chang et al, 2006). Negative MSLP anomalies (blue tones) correspond to enhanced rainfall effects in northwest Mexico and Arizona similar to those reported by Lorenz and Hartmann (2006).
[image:13.595.46.543.411.711.2]From Donald et al (page 9): The MJO and agricultural decision making in Northern Australia
Figure 5 : y-t section of averaged vector wind (ms-1) at 500 hPa
level for (a) east region, b) west region of India during the southwest monsoon 1997. Colour shading shows the zonal component (ms-1) of
[image:14.595.76.265.100.443.2]the wind vector
[image:14.595.44.289.558.732.2]Figure 6 : Same as Figure 5 except for 2002 Figure 3 : y-t diagram of vertically integrated apparent a)heat source
[image:14.595.310.552.560.733.2]<Q1> and b) moisture sink <Q2>, averaged over East (80°-90°E) and West (70°-80°E) regions of India in Wm-2 during monsoon 1997.
Moored buoys Other Annual number of reports in ICOADS (millions)
Ships Drifters Annual number of reportsin ICOADS (millions) Air Temperature
Wind Speed
Humidity SST Pressure
[image:15.595.370.553.88.266.2]Flux
Figure 1: left: Shaded regions indicate annual number of reports from ICOADS for 1950 to 2004 by “platform type”. Solid line indicates number of reports made hourly, the dashed line the subset of 6-hourly reports from VOS. The increasing report numbers are largely from sources reporting hourly or more frequently; right: Number of 6-hourly reports (as Figure 1a) containing: sea surface temperature (SST), air temperature, humidity, pressure and wind speed and all of these variables (“Flux”). Note the change of vertical scale.
Figure 2: Distribution of SST (upper) and air temperature reports (lower) by platform type (VOS: light blue, drifters: green, moored buoys and platforms: red) in December 2004, the last available month of ICOADS.
Sea Surface Temperature Adequacy
1980-1984
2000-2004
Global Mean Uncertainty in Monthly SST (°C)
Red: Ship data onlyBlack: Ship and buoy data
Air Temperature Adequacy
1980-1984
2000-2004
Global Mean Uncertainty in Monthly Air Temperature (°C)
Red: Ship data only
Black: Ship and buoy data
adequate
inadequate adequate
inadequate
Figure 3: Adequacy maps and uncertainty time-series for SST (left) and air temperature (right).
From Kent et al (page 20): Voluntary Observing Ships: A vital marine observing system in decline
Figure 4: air temperature ( ̊C) on 10th July 1992 from VOS observations (top left), and ERA 40 (top right) its uncertainty from VOS (lower left), and comparison with research-quality buoy data at 33 ̊N, 34 ̊W (black dot) in 1992 (Moyer and Weller, 1997) (black: buoy; blue: VOS; red: ERA40; all ̊C).
VOS OAFlux NCEP1
Daily Latent Heat Flux (Wm-2)
1990, 40˚N, 40˚W
[image:15.595.39.561.125.716.2]