Fiber-to-mortar bond behavior in TRM composites: effect of
embedded length and fiber configuration
Ali Dalalbashi1, Bahman Ghiassi2, Daniel V. Oliveira3, Ana Freitas 4
ABSTRACT
The use of Textile Reinforced Mortar (TRM) composites for Externally Bonded Reinforcement (EBR) of reinforced concrete (RC) and masonry structures has attracted several attentions during the last years. The effectiveness of these composites in structural reinforcement is significantly dependent on the TRM-to-substrate and the fiber-to-mortar bond behavior. Despite the importance of the latter, that controls the crack distribution on these composites, have received few attentions and is relatively unknown.
This paper presents a combined experimental and analytical study on the effect of fiber-embedded length and configuration on the pull-out response. From the obtained results, bond-slip laws are proposed for TRM composites made of unidirectional and bidirectional grids. The tests are performed on a (unidirectional) steel-based and a (bidirectional) glass-based TRM composite as common reinforcing systems. A comparison is also made between the results obtained from single-fiber pull-out tests and conventional single-lap shear bond tests to highlight the differences/similarities between these two test methods.
Keywords: Fiber/matrix bond; Pull-out testing; Mechanical testing; Analytical modeling.
1 PhD Student, ISISE, University of Minho, Department of Civil Engineering, Azurém, 4800-058 Guimarães,
Portugal. Phone: +351 253 510 499, fax: +351 253 510 217, E-mail: [email protected]
2 Assistant Professor, Centre for Structural Engineering and Informatics, Department of Civil Engineering, The
University of Nottingham, UK. Phone: +44 (0) 1157487163, Email: [email protected]
3 Associate Professor, ISISE, University of Minho, Department of Civil Engineering, Azurém, 4800-058 Guimarães,
Portugal. Phone: +351 253 510 499, fax: +351 253 510 217, E-mail: [email protected]
1
Introduction
The advantages of Textile Reinforced Mortar (TRM) composites to Fiber Reinforced Polymers (FRPs), including the fire resistance, the vapor permeability, the removability, and the compatibility with masonry and concrete substrates [1–5], have made these composites very interesting for the externally bonded reinforcement of masonry and RC structures.
TRMs are composed of continuous fibers embedded in a cementitious or non-cementitious matrix. These composites are used with a variety of unidirectional and bidirectional fibers and mortar types, which makes the development of unified design relations for these materials a complicated task. Glass, steel and basalt are among the most common fiber types used. While for the matrix, cementitious or lime-based mortars are usually used. Lime-based mortars are preferred for application to masonry and historical structures due to compatibility, sustainability issues, breathability and capability of accommodating structural movements [6–9].
the bond response of these composites. A steel-based TRM (made of unidirectional steel fibers) and a glass-based TRM (made of bidirectional glass fibers) are used for this purpose. A comparison is also made between the results obtained from single-fiber pull-out tests and conventional single-lap shear bond tests to highlight the differences/similarities between these two test methods.
2
Experimental tests
2.1 Overall tests description
The experimental tests consist of a series of pull-out tests on steel-based and glass-based TRMs considering different embedded lengths and fiber configurations. In addition, single-lap tests are performed on steel-based TRMs to compare the obtained results with the single and group fiber pull-out tests. A detailed description of the materials and specimens preparation as well as the test methods is presented in this section.
2.2 Materials
The reinforcing materials are glass and steel fibers. The glass fiber is a woven biaxial fabric mesh made of an alkali-resistance fiberglass (Mapegrid G220, Fig. 1a), in which weft yarns pass through the warp yarns and are welded with each other. Its mesh size and load resistance area per width unit are equal to 25×25 mm2 and 35.27 mm2/ m,
respectively. The elongation at breakage, modulus of elasticity, and the tensile strength of the glass fiber are 1.8 %, 72 GPa and 45 kN/m, respectively, according to the technical datasheets. The steel fiber is a unidirectional ultra-high tensile steel sheet (GeoSteel G600, Fig. 1b), with a density of 670 g/m2, an effective area of one cord (five wires) equal to 0.538 mm2, a tensile strength of 2800 MPa and an elastic modulus of
190 GPa, according to the technical datasheets. Each steel fiber is made by twisting five individual wires together, three straight filaments wrapped by two filaments at a high twist angle, forming a uniform cord. In this research, the mortar-fiber pairs are taken from the same manufacturer, meaning that glass fibers are used with mortar M1 and steel fibers with mortar M2.
2.3 Material characterization tests
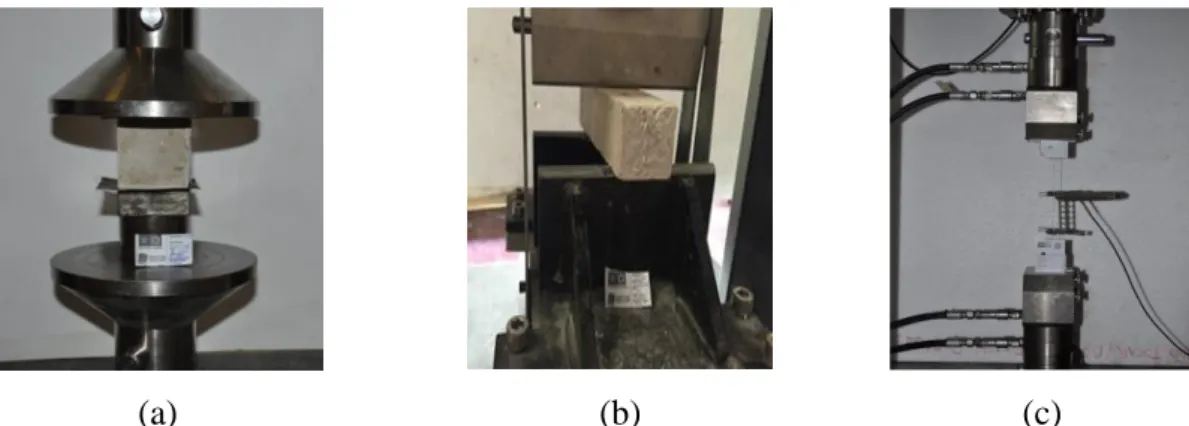
The flexural tests are performed according to the three-point bending test scheme with 100 mm distance between the supports (Fig. 2b).
Direct tensile tests are performed on fibers to obtain their tensile strength and elastic modulus. A universal testing machine with a maximum load capacity of 10 kN is used for these tests. The tests are performed under displacement-controlled conditions at the rate of 0.3 mm/min (Fig. 2c). The free length of all specimens under direct tensile load is equal to 300 mm. A 100 mm clip gauge located at the center of specimens and the internal LVDT of the actuator measure the fiber deformation along the tests.
2.4 Pull-out tests
The single-sided pull-out test setup, developed and presented by the authors in [19], is used in this study for investigating the fiber-to-mortar bond performance. The specimens consist of fibers embedded in disk shaped mortar with a cross section of 125×16 mm2. The free length of the fiber is embedded in an epoxy resin block over a length of 200 mm and with a rectangular cross-sectional area of 10×16 mm2. For detailed information on the procedure followed for preparation of the specimens the reader is referred to [19]. The specimens are demolded after 24 hours of preparation and are placed in a damp environment for seven days. After that, the specimens are stored in the lab environmental conditions (20°C, 60% RH) until the test day (at the age of 60 days).
and bond length, resulting in 20 specimens made for steel-based TRM and 15 specimens for glass-based TRM.
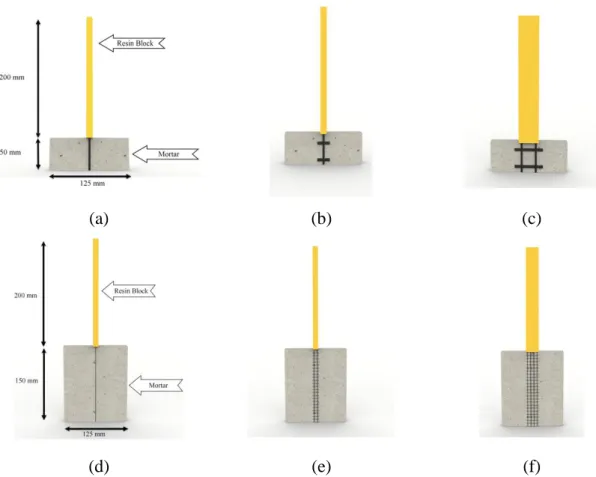
For investigating the effect of fiber configuration, three cases are considered for each material type, as shown in Fig. 3. For the glass-based TRMs, these cases include embedment of “single fiber (or cord)”, “single fiber + transverse elements” and “group of fibers” with a 50 mm embeddment length. For “single fiber” specimens, the transverse fibers are cut before embedment in the mortar (Fig. 3a). In case of “single fiber + transverse elements”, one fiber with two transverse elements is embedded in the mortar, as shown in Fig. 3b. The transverse elements have a total length of 50 mm (25 mm from each side of the fiber equal to the half of the mesh size). In case of “group of fibers”, two fibers with two transverse elements in between are embedded in the mortar (the distance between longitudinal fibers is 25 mm), see Fig. 3c. For the steel-based TRMs, since a unidirectional steel fiber mesh is used in this study, the specimens are prepared with embedment of “one single fiber”, “two fibers” and “four fibers” in the mortar with a 150 mm embedment length (see Fig. 3d-f).
The specimens are named as VV-WXY-Z, hereafter, in which VV is related to the mortar type (M1 and M2). W is connected to the fiber type (S: steel and G: glass). X is linked to the fiber configuration (S: single, T: single+ transverse, G: group) and Y is the number of fibers. Finally, Z is related to the embedded length as illustrated in Table 1. For example, specimen M2-SG4-150 is made with a four steel fibers embedded in mortar M2 with 150 mm embedded length.
2-µm sensibility are located at both sides of the epoxy block to record the slip from the surface of mortar, as shown in Fig. 4a. The LVDTs are mounted at the vicinity of the resin block to only capture the fibers slip from the measurements. However, the investigations performed by the authors showed that even mounting the LVDTs a little far from the bond (over the epoxy resin) captures the same slip measurements [19]. This is due to the fact that the epoxy resin block is very long (200 mm) and ensures no slippage of the fiber from the epoxy resin. This together with the much stronger adhesion of the fiber-to-epoxy compared to the fiber-to-mortar leads to occurrence of fiber slippage only at the fiber-to-mortar interface. The average of these LVDT measurements is presented as the slip in the experimental results. All the tests are carried out using a servo-hydraulic system with a maximum capacity of 25 kN at a displacement rate of 1.0 mm/min.
2.5 Single-lap tests
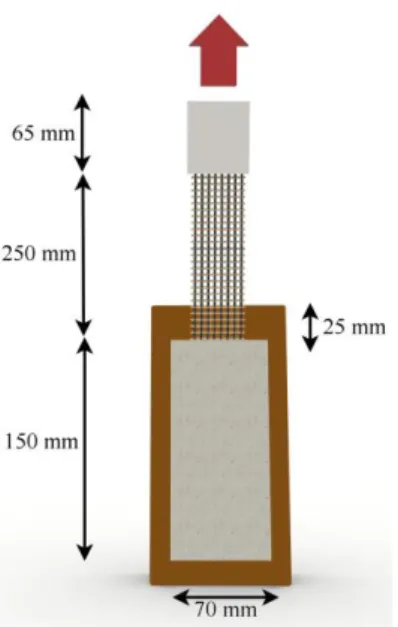
embedded length and free length of the fiber mesh are 150 mm and 250 mm, respectively, see Fig. 5. The curing condition of these specimens is similar to the pull-out test specimens. Two aluminum plates are attached to the extremity of the fibers 48 hours before testing to facilitate gripping of the specimens during the tests and to ensure a uniform load transfer.
For performing the single-lap shear tests, a closed-loop servo-controlled testing machine with the maximum load capacity of 50 kN at a displacement rate of 0.3 mm/min is used. It is noteworthy that the velocities for each test are selected based on the literature and are in the quasi-static range [20–23]. A stiff supporting frame and two clamps are used to support the specimens as shown in Fig. 4b. Attention is given to the alignment of dry fiber and TRM composite with the applied force. The slip of the fiber-to-mortar is measured by means of two LVDTs with 20 mm range and 2-µm sensibility placed at the loaded end (Fig. 4b). A preload equal to 200 N is applied to specimens before testing to facilitate attachment of the LVDTs [14].
3
Analytical modeling and extraction of the bond-slip laws
compared to that of fiber such as in fiber reinforced mortars. In these models, the bond-slip laws can be obtained indirectly from the pull-out tests [25].
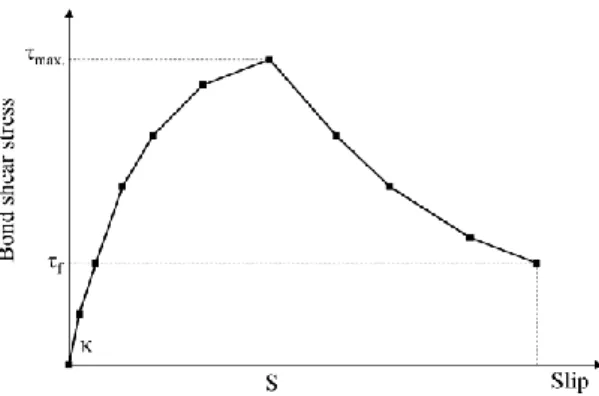
Various multi-linear and nonlinear [26–28] or N-piecewise (shown in Fig. 6) [24,29] bond-slip laws have been proposed in the literature. In the current study, the bond-slip law is assumed multi-linear and is obtained indirectly from the experimental pull-out curves following the model proposed by Banholzer et al. [24,29]. In this model, the experimental load-slip curve is divided into n steps. From the experimental test, the pull-out load, Pn, and its corresponding fiber slip, ωn, are known for each load step. The
parameters γ and q, defined as the relative compliance and the normalized pull-out force, respectively, are obtained as follows:
f f m m
1 1
A E A E
= + ... (1)
q= P ... (2) where A is the cross-sectional area and E is the Young’s modulus. The subscripts f and m refer to the fiber and the matrix, respectively. The bond stress, τs, and its
corresponding slip, S, are normalized for simplicity in terms of Ts, which is calculated
as:
(
)
s i i 1 i 1 s
T =m S S− − +T− = d ... (3)
where, Si-1 is the slip at the lower bound of an interval i of the piecewise defined
normalized shear flow versus slip relation. Ti-1 and d are the normalized shear flow
corresponding to the slip Si-1 and the fiber diameter, respectively. mi is the slope of the
N-piecewise linear normalized shear flow-slip relation in an interval i and is equal to:
i i 1
i 0 0
i i 1
T T
m , T S 0
S S
− −
−
= = =
The procedure is to find the shear stress distribution, τn, or the normalized shear flow,
Tn, along the bonded length in each step. Tn has to be found in an iterative procedure for
a given slip ω= S at x= L and a given pull-out force P= γ-1q. For each load step, n, the introduced slip and its corresponding pull-out load are known from the experimental tests.
The procedure for finding the bond-slip laws can be summarized as follows:
1) At n= 1, P1 and S1 are known from the experimental results, thereby T1 can be
calculated from the following equation:
k k k 1 1 1
2 2 2 2
k k k k 1 1 1 1
m q T m q T
1 1
L ln ln
m T m q m T m q
+ + = = − − ... (5)
L and q are the embedded length of fiber and normalized force in the fiber at location x (q1= γP1), respectively. Based on Eq. (4), m1 depends on T1 that is the only
unknown parameter in Eq. (5). The subscript k refers to the point in which the force in the fiber is zero [24].
2) To determine T2, a value should be initially assumed. Then from Eq. (4), the value
of m2 is calculated. By obtaining m2, the following equation can be solved:
(
)
(
)
(
)
(
)
2 2 2
i 1 i i i i 1 i 1 i i 1 2
2 2
1 2 2 2 1 1 2 1
q q m S S 2T S S
q q m S S 2T S S
− = − − − − − − −
= − − − − ... (6)
If the obtained value of Eq. (6) is negative, the assumed value is correct and one can proceed to the next step. Otherwise, the value of T2 must be changed so that the
amount of Eq. (6) becomes negative. Therefore, this recursive determination of the fiber forces guarantees that there is a point in which the fiber load is zero [24].
n i i k 1
L x x
= +
= +
... (7)where Δx and Δxi can be determined as follows:
(
)
k k k
k
2 2
k k k k
2 2
k k k k k
k
2 2
k k k k
m q T
1
x ln , m 0
m T m q
m q T m q
1
x arcsin , m 0
T m q
m + = − − − − = − − ... (8)
(
)
i i i
i i
i i i 1 i 1
i i i 1 i 1 i
i
2 2
i 1 k i 1 i
m q T
1
x ln , m 0
m m q T
m T q T q
1
x arcsin , m 0
T m q
m − − − − − − + = + − − = − − ... (9)
In fact, by solving Eq. (6), the precise point of the embedded length in which the fiber load is equal to zero is obtained [24].
4) Having T2, the shear stress is calculated by Eq. (3).
5) This procedure is then repeated for the next steps (n= 3, 4 …).
calculating the bond parameters, and verifying the analytical load-slip curve with experimental curve. The parametric study illustrated that the mortar area can be selected between 55 and 100 times the fiber area, though 55 yielded a more accurate answer and it was chosen for the simulations [19] .The bond-slip laws are obtained for each specimen from its experimental load-slip curves and then the average bond-slip law is obtained and presented for each series.
4
Results and discussion
4.1 Material properties
The mean compressive and flexural strength of the mortar at different ages are presented in Table 2. As illustrated, the strength of both mortars increase significantly during the first 30 days and, besides some variations, the changes (particularly for the compressive strength) are not significant after that. The maximum compressive and flexural strength of the mortar M1 are 8.31 MPa and 5.1 MPa, respectively. At the same time, mortar M2 has a comparable compressive strength (9.53 MPa) and a lower flexural strength (2.54 MPa).
The envelope and average tensile stress-strain curves obtained from direct tensile tests on dry fibers are also shown in Fig. 7. The results show an average tensile strength, Young’s modulus, and rupture strain of the steel fiber are 2972 MPa, 189.34 GPa, and 1.88 %, respectively (Fig. 7a). As for the glass fiber, these values are equal to 875 MPa, 65.94 GPa, and 1.77 %, respectively, see also Fig. 7b.
4.2 Effect of embedded length 4.2.1 Steel reinforced mortar
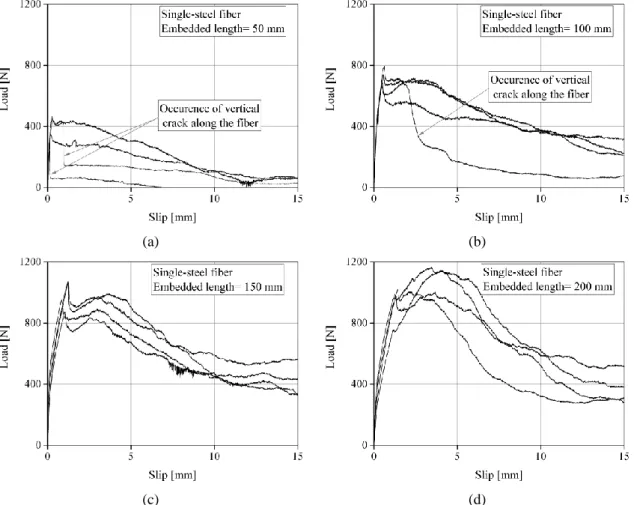
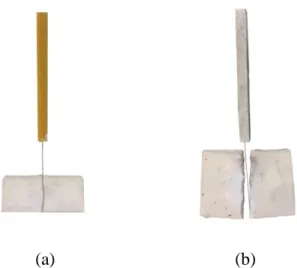
lower than the tensile strength of the steel fibers in all cases. The pullout response consists of the typical elastic, nonlinear, and dynamic stages in all embedded lengths [14,26,28,30,33] with the failure mode being slippage of the fiber from the mortar in all specimens, except for three specimens, in which vertical cracks occurred in the mortar (Fig. 9). The effect of mortar cracking is clearly observable on the pull-out response of the specimens, see Fig. 8a, b.
The pull-out curves show that after the peak load is reached, a sudden drop occurs in the force followed by a slip hardening behavior [34,35]. It can be observed that the slope of the slip hardening increases with increment of the embedded length. It is clear that the pull-out response after the peak load is mainly dependent on the frictional stresses between the fiber and the matrix. A high frictional stress leads to a slip hardening response, while a slip softening is observed when a low frictional stress exists [36,37]. By increasing the embedded length, the total frictional force and consequently the slope of the slip hardening region increase (as shown in Fig. 8). When the applied load or induced transverse stresses exceed the matrix tensile strength, mortar cracking or splitting occurs, which can lead to a sudden drop in the load.
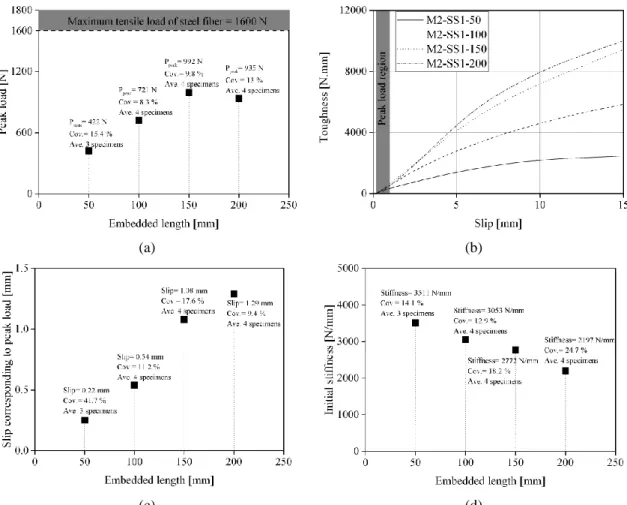
It can be observed that the peak load and its corresponding slip as well as the toughness increase until 150 mm embedded length and do not change significantly thereafter. These are indications of reaching the effective bond length in the range of 150-200 mm, see Fig. 10a-c. This range is also in agreement with the findings of previous experimental studies on similar steel-based TRMs [3,14]. At the same time, a reverse trend is observed for the initial stiffness with increment of embedded length, see Fig. 10d. This phenomenon has also be observed in the experimental results reported in [34,38–42].
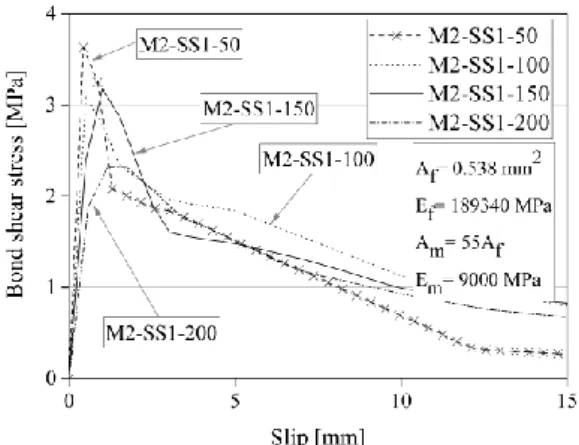
The average bond-slip laws obtained with the aim of the N-piecewise model for different embedded lengths are shown in Fig. 11 and Table 3. Interestingly, the average bond-slip laws are similar (with slight differences) in all embedded lengths. The bond strength is obtained in the range of 3.1-3.6 MPa in embedded lengths smaller than 150 mm and slightly smaller in the embedded length of 200 mm (2.3 MPa). It seems that the shear stiffness of the bond-slip law, κ, decreases (and consequently the slip corresponding to the bond strength increases) with increment of the embedded length. Finally, the residual part of the bond slip law is most probably related to the frictional effect.
4.2.2 Glass reinforced mortar
stages of the bond response (Fig. 12a). In the specimens with 75 mm embedded length (M1-GS1-75) tensile rupture of the fibers occurs after a certain slip and the load-slip curves only consist of the linear and the nonlinear stages, Fig. 12b. Finally, in the specimens with 100 mm embedded length (M1-GS1-100) tensile rupture of the fibers occurs with a smaller slip values and therefore the load-slip curves consist of elastic stage followed by a short nonlinear stage (Fig. 12c).
The changes of the main parameters of the load-slip curves with embedded length are presented in Fig. 13. It can be observed that by increasing the embedded length, the peak load increases until fiber rupture occurs (Fig. 13a). The peak load at 100 mm embedded length (M1-GS1-100) is very near the fiber tensile strength obtained from direct tensile tests. The toughness increases from 50 mm to 75 mm embedded length and then decreases at 100 mm (Fig. 13b). This is expected, as the fiber slipping (that governs the M1-GS1-50 and M1-GS1-75) dissipates more energy than the fiber tensile failure. The changes of the slip corresponding to the peak load with embedded length are also affected by the failure mode in the specimens (Fig. 13c). At the same time, the initial stiffness decreases with increment of the embedded length that is a similar observation to steel-based TRMs, as shown in Fig. 13d.
4.3 Effect of textile configuration 4.3.1 Steel reinforced mortar
The average and envelope of the load-slip curves obtained from steel-based TRMs with different configurations are shown in Fig. 15. The results are presented in terms of the applied load per fiber (load divided by the number of fibers) versus slip to facilitate comparison between different configurations.
It can be observed that although the steel fibers are unidirectional, the pull-out response of single fibers is different than that of the group of fibers. The failure mode of the specimens, as shown in Fig. 16, also changes from fiber slippage in single fiber specimens to mortar cracking and splitting in group fiber specimens. The pull-out curve of the single fiber specimens (M2-SS1-150, Fig. 15a) shows a second peak load followed by a load reduction after complete debonding. This second peak load is not observed in the group fiber specimens (M2-SG2-150 and M2-SG4-150), Fig. 15b, c. which can be due to occurrence of mortar cracking and splitting after the peak load. From the presented curves, it can be observed that in contrast to the single fiber specimens (M2-SS1-150, Fig. 15a), the slip measurements are different from that of internal LVDT measurements in the group fiber specimens. Although this difference does not affect the obtained results, it shows that by increasing the number of fibers the deformation of the resin block used for gripping the specimens becomes significant leading to a large difference between these two measurements.
change of failure modes. Table 5 clearly shows that by increasing the number of fibers, the debonding load, the slip corresponding to the peak load, the toughness and initial stiffness of the load-slip curves decrease. Moreover, as shown in Fig. 17b, by increasing the number of fibers, the energy absorption decreases that is due to the change of the failure mode from pull-out to mortar cracking.
The analytical bond-slip laws are presented in Fig. 18 and Table 3. The analytical modeling of the group steel fibers assumes that a uniform load is applied to all fibers owing to the epoxy resin block; thus, the obtained load from the experimental test is divided into the number of fibers. This assumption seems acceptable when deriving average bond-slip laws for the TRM composites is of concern. The analytical results show that the number of steel fibers does not have a significant influence on the shear modulus and bond strength in the bond-slip laws, as shown in Fig. 18 and Table 3. It can be observed that although the pull-out response of single (M2-SS1-150) and double (M2-SG2-150) fiber specimens show a different behavior after complete debonding (see Fig. 18), the frictional stresses of these specimens are approximately the same. The frictional stress of the group fibers (M2-SG4-150), however, is smaller than the single and the double fiber specimens, which can be attributed to the distributed cracking of the mortar in these specimens. Consequently, by increasing the number of fibers, the failure mode changes from pull-out to mortar cracking. Moreover, the more number of fiber, the more cracking in the mortar; as a result, both peak load and frictional stress decrease.
adapted approach. These differences that are rooted on the analysis method and the made assumptions show that the solution to the mathematical problem of delamination is not unique and different solutions (bond-slip laws) can be obtained when different approaches are followed. In the model utilized in the current study, the pull-out problem is expressed with respect to the slip distribution over the embedded length [24,29], while the model used by the authors in [19], is expressed based on the local shear stresses [19,26].
4.3.2 Glass reinforced mortar
The average and envelope of the pull-out curves obtained from the glass-based TRMs with different configurations are shown in Fig. 19. The difference between the single-fiber and group single-fiber specimens is more significant in this case, which can be attributed to the effect of transverse elements. The main parameters of the pull-out curves are also summarized in Table 7.
The effect of transverse elements on the bond response has also been previously reported in [46] by comparing the bond behavior in the fabric and the single yarn polypropylene. The results illustrated that transverse elements increase dramatically both the peak load and its corresponding slip. Meanwhile in the current study, the presence of transverse elements has only caused an increment of slip hardening. This different observation shows that depending on the properties of the fiber and mortar, the effect of transverse elements on the bond response can be different. Therefore, it can be concluded that the transverse elements work as an anchorage, leading to an enhanced strength and ductility.
It seems that the slope of the slip hardening in M1-GG2-50 specimens is higher than M1-GT1-50, which is due to the higher stiffness of the transverse elements in these specimens, Fig. 20a. It can be observed in Table 7 that although a larger slip corresponding to the peak load slip and toughness is obtained in the group and “single+ transverse” specimens compared to single fiber specimens, the peak stress and the initial stiffness have negligible changes. The toughness, or the absorbed energy, is almost the same until the slip of 3.5 mm (Fig. 20b). Thereafter, the transverse elements cause the energy absorption to increase 22 % and 36 % for the M1-GT1-50 and M1-GG2-50 specimens, respectively.
cause the maximum shear stress to increase gradually about 5% and 16% for M1-GT1-50 and M1-GG2-M1-GT1-50, respectively, compared to M1-GS1-M1-GT1-50.
5
Comparison of pull-out and single-lap shear tests
Recent investigations on mechanical characterization of TRM-based composites have been mostly focused on mechanical tests for characterization of the tensile response of TRM composites or of the TRM-to-masonry bond behavior [14,47]. Single or double-lap shear bond tests have been extensively used for characterization of the TRM-to-substrate bond behavior, similar to that of FRP-strengthened masonry. However, the critical differences between these two composite materials in terms of the nonlinear response and failure modes suggest that these tests are not suitable for constitutive modeling and extraction of bond-slip laws. Fiber-to-mortar pull-out tests seem to be a more suitable testing method, but have received a very limited attention.
compressive load and the fiber bear tensile load. On the other hand, in single-lap shear tests, the mortar is free and only the substrate is fixed causing different stress distributions in the top and the bottom mortar layers. Moreover, the type of test setup causes both the mortar and the fiber to be under tension stress but the brick bear the compressive stress [3]. These observed differences in the load-slip curves suggest that a different bond-slip law will be obtained in each case and therefore application of these laws in numerical simulations should be done with special care and attention. While the stress distribution and the possible failure modes in the TRM system are similar to the results of single-lap shear test, the pull-out test is suitable test for investigating the bond behavior between fiber-to-mortar. It is worth noting that the obtained results of pull-out tests only depend on the bond between fiber and mortar and the stress state in the mortar; while the load-slip curves gained from the single-lap shear tests depend on other interacting parameters as well including the mortar-to-substrate bond, cracking of the top mortar layer and unsymmetrical loading conditions on the mortar. Hence, for simulating the bond behavior of fiber-to-mortar in the TRM system, the bond-slip law extracted from the pull-out test is suggested.
6
Conclusions
• Steel-based and glass-based TRMs had significantly different effective bond lengths. This value seemed to be in the range of 150 mm to 200 mm in steel-based TRM and in the range of 50 mm to 75 mm in glass-based TRMs used in the current study.
• The bond-slip laws obtained from the pull-out tests were not significantly different in different embedded lengths unless a different failure mode occurred (e.g. when tensile rupture of the fibers occurred).
• By increasing the number of steel fibers in pull-out tests, the failure mode changed from pull-out (for single fiber) to pull-out and mortar cracking (for group fibers). This change of failure mode could be avoided by increasing the mortar thickness. In addition, the bond-slip laws of steel fiber with different configurations were approximately in the elastic region (until the bond strength). The frictional stress however was decreased by increasing the number of fibers.
• The bond behavior of the unidirectional and bidirectional glass fiber mesh especially in the nonlinear region was completely different. It means that transverse elements had a considerable effect on the bond behavior and consequently the bond-slip laws of TRM composites. The toughness was also increased dramatically due to presence of transverse elements.
the fibre-to-mortar bond response in the pull-put tests. The stress state in the TRM composite in single-lap shear tests is more similar to reality, but interpretation of the experimental results should be performed with care. Meanwhile, the pull-out tests are more suitable for characterization of the fiber-to-mortar bond behavior and
slip laws for using in numerical
-present an opportunity for extraction of the bond simulations.
7
Acknowledgements
8
References
[1] Carozzi FG, Poggi C. Mechanical properties and debonding strength of Fabric Reinforced Cementitious Matrix (FRCM) systems for masonry strengthening. Compos Part B Eng 2015;70:215–30. doi:10.1016/j.compositesb.2014.10.056.
[2] de Felice G, De Santis S, Garmendia L, Larrinaga P, Lourenço PB, Oliveira D V, et al. Mortar-based systems for externally bonded strengthening of masonry. Mater Struct 2014;47:2021–37. doi:10.1617/s11527-014-0360-1.
[3] Razavizadeh A, Ghiassi B, Oliveira D V. Bond behavior of SRG-strengthened masonry units: Testing and numerical modeling. Constr Build Mater 2014;64:387–97. doi:10.1016/j.conbuildmat.2014.04.070.
[4] Papanicolaou CG, Triantafillou TC, Papathanasiou M, Karlos K. Textile-reinforced mortar (TRM) versus FRP as strengthening material of URM walls: in-plane cyclic loading. Mater Struct 2007;40:1081–97. doi:10.1617/s11527-006-9207-8.
[5] De Santis S, de Felice G. Steel reinforced grout systems for the strengthening of masonry structures. Compos Struct J 2015;134:533–48. doi:10.1016/j.compstruct.2015.08.094.
[6] Barr S, Mccarter WJ, Suryanto B. Bond-strength performance of hydraulic lime and natural cement mortared sandstone masonry. Constr Build Mater 2015;84:128–35. doi:10.1016/j.conbuildmat.2015.03.016.
[7] Pavlík V, Uzáková M. Effect of curing conditions on the properties of lime, lime–metakaolin and lime–zeolite mortars. Constr Build Mater 2016;102:14–25. doi:10.1016/j.conbuildmat.2015.10.128.
[8] Lanas J, Perez Bernal JL, Bello MA, Alvarez JI. Mechanical properties of masonry repair dolomitic lime-based mortars. Cem Concr Res 2006;36:951–60. doi:10.1016/j.cemconres.2005.10.004.
[9] Groot C. Rilem TC 203-RHM: Performance requirements for renders and plasters. Mater Struct 2012;45:1277–85. doi:10.1617/s11527-012-9916-0.
[10] Lignola GP, Caggegi C, Ceroni F, De Santis S, Krajewski P, Lourenço PB, et al. Performance assessment of basalt FRCM for retrofit applications on masonry. Compos Part B Eng 2017;128:1–18. doi:10.1016/j.compositesb.2017.05.003.
[11] Yu J, Yao J, Lin X, Li H, Lam JYK, Leung CKY, et al. Tensile performance of sustainable Strain-Hardening Cementitious Composites with hybrid PVA and recycled PET fibers. Cem Concr Res 2018;107:110–23. doi:10.1016/j.cemconres.2018.02.013.
[12] Grande E, Imbimbo M, Sacco E. Numerical investigation on the bond behavior of FRCM strengthening systems. Compos Part B 2018;145:240–51. doi:10.1016/j.compositesb.2018.03.010.
[13] Leone M, Aiello MA, Balsamo A, Carozzi FG, Ceroni F, Corradi M, et al. Glass fabric reinforced cementitious matrix: Tensile properties and bond performance on masonry substrate. Compos Part B Eng 2017;127. doi:10.1016/j.compositesb.2017.06.028.
[14] Ghiassi B, Oliveira D V, Marques V, Soares E, Maljaee H. Multi-level characterization of steel reinforced mortars for strengthening of masonry structures. Mater Des 2016;110:903–13. doi:10.1016/j.matdes.2016.08.034.
[15] Bilotta A, Ceroni F, Lignola GP, Prota A. Use of DIC technique for investigating the behaviour of FRCM materials for strengthening masonry elements. Compos Part B Eng 2017;129. doi:10.1016/j.compositesb.2017.05.075.
[16] Olivito RS, Codispoti R, Cevallos OA. Bond behavior of Flax-FRCM and PBO-FRCM composites applied on clay bricks: Experimental and theoretical study. Compos Struct 2016;146:221–31. doi:10.1016/j.compstruct.2016.03.004.
[17] ASTM C109/C109M-05, Standard test method for compressive strength of hydraulic cement mortars (Using 2-in. or [50-mm] Cube Specimens). vol. 04. 2005. doi:10.1520/C0109_C0109M-05.
[18] BS EN 1015-11, Methods of test for mortar for masonry. Determination of flexural and compressive strength of hardened mortar. 1999.
very-high strength concrete. Am J Eng Appl Sci 2010;3:454–63. doi:10.3844/ajeassp.2010.454.463.
[21] Xu M, Hallinan B, Wille K. Effect of loading rates on pullout behavior of high strength steel fibers embedded in ultra-high performance concrete. Cem Concr Compos 2016;70:98–109. doi:10.1016/j.cemconcomp.2016.03.014.
[22] Tai Y, El-tawil S. High loading-rate pullout behavior of inclined deformed steel fibers embedded in ultra-high performance concrete. Constr Build Mater 2017;148:204–18. doi:10.1016/j.conbuildmat.2017.05.018.
[23] Babafemi AJ, Boshoff WP. Pull-out response of macro synthetic fibre from concrete matrix: Effect of loading rate and embedment length. Constr Build Mater 2017;135:590–9. doi:10.1016/j.conbuildmat.2016.12.160.
[24] Banholzer B. Analytical simulation of pull-out tests- the direct problem. Cem Concr Compos 2005;27:93–101. doi:10.1016/j.cemconcomp.2004.01.006.
[25] Lawrence P. Some theoretical considerations of fibre pull-out from an elastic matrix. J Mater Sci 1972;7:1–6. doi:10.1007/BF00549541.
[26] Naaman AE, Namur GG, Alwan JM, Najm HS. Fiber pullout and bond slip. i: analytical study. J Struct Eng 1991;117:2769–90. doi:10.1061/(ASCE)0733-9445(1991)117:9(2769).
[27] Naaman AE, Namur GG, Alwan JM, Najm HS. Fiber pullout and bond slip. ii: experimental validation. J Struct Eng 1991;117:2791–800. doi:10.1061/(ASCE)0733-9445(1991)117:9(2791). [28] Mobasher B. Mechanics of Fiber and Textile Reinforced Cement Composites. London- New
York: Taylor & Francis Group; 2012.
[29] Banholzer B, Brameshuber W, Jung W. Analytical evaluation of pull-out tests-The inverse problem. Cem Concr Compos 2006;28:564–71. doi:10.1016/j.cemconcomp.2006.02.015.
[30] Sueki S, Soranakom C, Mobasher B, Asce M, Peled A. Pullout-slip response of fabrics embedded in a cement paste matrix. J Mater Civ Eng 2007;19:718–28. doi:10.1061/(ASCE)0899-1561(2007)19:9(718).
[31] Sujivorakul C, Wass AM, Naaman AE. Pullout response of a smooth fiber with an end anchorage. J Eng Mech 2000;126:123–31. doi:10.1061/(ASCE)0733-9399(2000)126:9(986).
[32] Alwan JM, Naaman A, Hansen W. Pull-Out work of steel fibers from cementitious composites : analytical investigation. Cem Concr Compos 1991;13:247–55. doi:10.1016/0958-9465(91)90030-L.
[33] Shannag J, Brincker R, Hansen W. Pullout behavior of steel fibers from cement-based composites. Cem Concr Res 1997;27:925–36. doi:10.1016/S0008-8846(97)00061-6.
[34] Robins P, Austin S, Jones P. Pull-out behaviour of hooked steel fibres. Mater Struct 2002;35:434–42. doi:10.1007/BF02483148.
[35] Butler M, Mechtcherine V, Hempel S. Experimental investigations on the durability of fibre-matrix interfaces in textile-reinforced concrete. Cem Concr Compos 2009;31:221–31. doi:10.1016/j.cemconcomp.2009.02.005.
[36] Yang E-H, Wang S, Yang Y, Li VC. Fiber-Bridging Constitutive Law of Engineered Cementitious Composites. J Adv Concr Technol 2008;6:181–93. doi:10.3151/jact.6.181.
[37] Lin, Z.; Li VC. Crack Bridging in Fiber Reinforced Cementitious Composites with Slip-Hardening Interfaces. J Mech Phys Solids 1997;45:763–87. doi:10.1016/S0022-5096(96)00095-6. [38] Portal NW, Perez IF, Thrane LN, Lundgren K. Pull-out of textile reinforcement in concrete.
Constr Build Mater 2014;71:63–71. doi:10.1016/j.conbuildmat.2014.08.014.
[39] Tuyan M, Yazıcı H. Pull-out behavior of single steel fiber from SIFCON matrix. Constr Build Mater 2012;35:571–7. doi:10.1016/j.conbuildmat.2012.04.110.
[40] Alberti MG, Enfedaque A, Gálvez JC, Ferreras A. Pull-out behaviour and interface critical parameters of polyolefin fibres embedded in mortar and self-compacting concrete matrixes. Constr Build Mater 2016;112:607–22. doi:10.1016/j.conbuildmat.2016.02.128.
[41] Wang B, Jin H, Man T, Wang Q. Study on the mechanical property of textile reinforced self-stressing concrete sheets. Constr Build Mater 2016;107:1–10. doi:10.1016/j.conbuildmat.2015.12.167.
[42] Zhang XB, Aljewifi H, Li J. Failure behaviour investigation of continuous yarn reinforced cementitious composites 2013;47:456–64. doi:10.1016/j.conbuildmat.2013.05.022.
[43] Pacios A, Ouyang C, Shah SP. Rate effect on interfacial response between fibres and matrix. Mater Struct 1995;28:83–91. doi:10.1007/BF02473175.
[45] Naaman AE, Shah SP. Pull-out mechanism in steel fiber-reinforced concrete. J Struct Div 1976;102:1537–48.
[46] Sueki S. An analytical and experimental study of fabric-reinforced, cement-based laminated composites. Arizona State University, 2003.
List of Figures
(a) (b)
(a) (b) (c)
Fig. 2. Materials mechanical characterization tests: (a) mortar compressive test; (b) mortar flexural test;
(a) (b) (c)
(d) (e) (f)
Fig. 3. Details of specimens for investigating the effect of fiber configuration on bond properties: (a)
(a)
(b)
(a) (b)
(c) (d)
(a) (b)
Fig. 9. Cracking failure mode obtained for: (a) two specimens of 50; (b) a specimen of
(a) (b)
(c) (d)
(a)
(b)
(c)
(a) (b)
(c) (d)
(a)
(b)
(c)
Fig. 15. Pull-out response of steel-based TRMs with different configurations: (a) SS1-150; (b)
(a) (b) (c)
(a)
(b)
(c)
(a)
(b)
(c)
(a) (b)
(a) (b)
List of Tables
Table 1. Nomenclature for test specimens.
Group Objective Mortar Fiber Fiber configuration
Bond length
[mm]
Name of
specimens N*
Embedded bond length
Effective bond length
M1 Glass Single fiber
50 M1-GS1-50 5/5 75 M1-GS1-75 4/5 100 M1-GS1-100 5/5
M2 Steel Single fiber
50 M2-SS1-50 4/5 100 M2-SS1-100 4/5 150 M2-SS1-150 4/5 200 M2-SS1-200 4/5
Fiber configuration
Effect of fiber configuration
on the bond behavior
M1 Glass
Single fiber
50
M1-GS1-50 5/5 Single fiber
+ transverse M1-GT1-50 4/5 Group
(2 fibers) M1-GG2-50 5/5
M2 Steel
Single fiber
150
M2-SS1-150 5/5 Group
(2 fibers) M2-SG2-150 5/5 Group
(4 fibers) M2-SG4-150 5/5 * Number of reported results to the number of tested specimens
Table 2. Mortar mechanical properties.*
Mortar Test 3 days 7 days 14 days 28 days 60 days 90 days
M1 Compressive strength [MPa]
0.91 (4.5) 3.77 (5.4) 5.91 (9.2) 7.07 (10.5) 8.31 (12.2) 7.84 (4.7) Flexural strenght [MPa] - 2.51
(8.1) 4.03 (3.6) 4.71 (7.8) 5.10 (3.2) 4.66 (8.9) M2
Compressive strength [MPa] 3.88 (8.5) 6.46 (7.8) 8.76 (7.8) 9.53 (11.1) 8.81 (13.8) 8.89 (5.9) Flexural strenght [MPa] 1.4
(3.3) 1.53 (4.0) 1.79 (13.5) 2.54 (9.6) 2.09 (8.3) 2.33 (10.6) *CoV of the results are given in percentage inside parentheses.
Table 3. Bond-slip law properties in steel-based TRM.
Specimen M2-SS1-50 M2-SS1-100 M2-SS1-150 M2-SS1-200 M2-SG2-150 M2-SG4-150
τmax [MPa]* 3.6 3.1 3.2 2.3 3.1 2.8
Smax [N]* 0.4 0.5 1.0 1.7 1.0 1.0
κ [N/mm3]* 8.4 6.7 5.0 3.4 5.6 5.6
Table 4. Bond-slip law properties in glass-based TRM.
Specimen M1-GS1-50 M1-GT1-50 M1-GG2-50 τmax [MPa]* 1.8 1.9 2.1
Smax [N]* 1.9 6.9 6.4
κ [N/mm3]* 4.0 2.2 3.2
* τmax: Maximum shear stress, Smax: slip corresponding to maximum shear stress, κ: bond modulus.
Table 5. Changes of bond properties in steel-based TRM with fiber configuration.*
Specimen Slip corresponding to peak load [mm]
Peak load/ per fiber [N]
Toughness until peak load/ per fiber [N.mm]
Initial stiffness/ per fiber [N/mm]
M2-SS1-150 1.08 (17.6) 992 (9.8) 730 (23.2) 2772 (18.2)
M2-SG2-150 0.89 (26) 815 (14.2) 538 (29.8) 2863 (30.3)
M2-SG4-150 0.74 (43.8) 700 (15) 340 (57.1) 2058 (61.6) Single-lap 1.05 (15.0) 875 (8.7) 674 (16.9) 2600 (34.3) *CoV of the results are given in percentage inside parentheses.
Table 6. Comparing the bond-slip law between two different methods in M2-SS1-150 specimens.
Method κ
[N/mm3]
τmax
[N/mm2]
Slip at full debonding [mm]
Slip corresponding to the τmax [mm]
multi-linear bond-slip law
proposed by [19] 39.5 4.6 0.92 0.12
N-peicwice model 5.0 3.2 - 1.0
Table 7. Changes of bond properties in glass-based TRM with fiber configuration.*
Specimen Slip corresponding to peak load [mm]
Peak load/ per fiber [N]
Toughness until peak load/ per fiber [N.mm]