COMMISSION
OF THE
EUROPEAN
COMMUNITIES
Directorate-General for External Relations
COMMUNITY
TRADE
in
L97
5:
CHANGES AS COMPARED
§I/ITH
T974
I! I rr €
I.
CONIENTS
The
Conrounit-vand
world.
trade
in
1975A.
1.
l{or1d.trade
inoluding
intra-Coumunity
trade
2.
Trade
balanoes
3.
heakd.own
of
worLd.trade by
area
or
country
III.
Intra-Connurit.v
trade
in
1q751.
Develolment
of
intra-Comnunity
trade
in
L9752.
Relative
shares
in
intra-Comnr:nity trad.e
in
L9753.
Intra-Conmunity
trade
surpluses
and
deficits
in
19754.
Structr:re
of
intra-Conmrxrity
trade
by
conrnod.ity group
rv.
Coununity
trade
with the reÉt
of
the
world.
in
1975L
Developnent
of
Connunity
trade
with
non-+enber
conntries
tn
L9752.
Geographical
structr:re
of
Comnr:nity
trade with
non-rember
countries
in lll)
3.
Commr:nitytrad.e balances
with
non-netrber
countries
by
trading
area
Structr:re
of
Conmr:nitytracLe
with the
rest
of
the
world
by
connodity
group
-
d.evelopnent
in IlJl
trade
balance
with
non+enber
cowrtries
by
class
of
prod.uctPapes
10
10 10
11
t2
L4
t4
L4
t5
1B
20
I
3
4
B.
1.
lùorld.
trade
exoluding
intra-Coronunity
trade
52.
Distribution
of
wor1d.trade by
area
or
by
country
5II.
Conmr:nit.ytrade
in
eeneraL
in
1Q?5(intra-Comnrrnit.v
tra.d.eand.
trade
with the
rest of
the
world)
61.
The
relative
soale
of
general
trade
in 1975
62.
Coographioal
stnrcture
of
general
trade
Ln
L975
83.
Stnrcture
of
general
tratle
by
comnodity
group
94.
General
trad.e flrrplus,es
and.tleficits
by
product
94.
A][I{-.E]XES
1.
Communityimports
in
t975
and
volume
indices
L975h4
2.
Connr:nity
errports
Ln
1975 and volr:me
indices
L975h4
3.
Geographical
structr:re
of
general
trade
tn
L975(r)
Imports
(u)
E:rports
4.
Stnrcture
of
general
trade by continent
-
L9755.
Structure
of
general
Comrnunitytrade
in
L974
a.nd1975 by
conmod.ity
group
and.by
trading
area
(")
In million
EUR(r)
rn
f"6. (")
Trade
between
lvlemberStates
in nillion
E{JR,uith indi.",
(t975h+)
(U)
Tra.debetween
MenberStates
in
L975
-
(/")7.
Sr:rpluses antl
d.eficits
in
intra-EC
trade
in
L975
by
connod.ity
group
B.
Cieographical
stnrcture
of
ertra-EC
trade
in
L975(")
rmports
(l)
Exports
9.
Exbra-EC
trade
in
1975
by
conmodity
group
(r)
In
mil-lion
EIIR-t-I.
TITE COMMUNTTY AIID WORLD TRADEIN
1O7q*4.1
tlorld. trad.e
includine
intra-Comrnunit.y
trad.e
There
are
statistical difficulties in
presenting
the
deveropmentof
worrd
trade.
Given an
equal
voh:me
of
good.s,
its
varue
d.iffers
accord.ing
to
r.rhether
it is
expressed.
in
cument
us
dolrars
(the
varue
of
which has
not
been
constant
since
1971)
or
in
EUR, whosevalue
is still
0.8886708 grams
of fine
gpld
(equivalent
to
the
/
terore
1971).
The
convòrsion
of
national
cumencies
into
EURis
nader
for
cumencies
within the
coumunity
exchangp
rate
systen,
on
the
basis
of
centraL
rates; for
other
currencies,
conversion
is
on
the
basis
of
narket
rates
in
relation
to
the cr:rencies within
the snake.
currency
exchange
rates
are
carculated.
and. ptrbrished.by
the
SOEC.The
average
annual
rates
are:
L974
rEuR=
it.z5
t975
IErJR=
/t.32
The
following table
gives
figr:res
in
us clorlars
and
EURfor
world
trade
in
L975
cornparedwith
1974:riORLI TR4DEì
IN
1o7q BY AREA 0R BY COUNTRY TABLE 1I
È.,
I
tt
_1974
lEURruS
j5xcluding
trade
lOrganization of
'Not
included
in
flt.zSi
1915 1 EIIR=
us
É1,32.of
European and. Asia"nState-trad.ing countries.
PetroleurnExporting Counlriss
(including
Venezuela,iolumn
1. 770.879E.7
103
765
787 .4
103
616.6
605 .1
98
612.4 596,5
98
EXPORTS
IN
USfl
TOOOMilliON
Japan
IFTA
ILatin
er]-ca
USSR3
293.1 299.2 102
275,4 296.5
108
235,5 226,6
96
2?0.3 224.6
102
97 ,1
106,2
109
mil-lion
3?.2 51.5
160
122,3 112,1
92
25,E 39,0 1sl
Ii.IPORTS
IN
USd
IOOOMilliON
11:'^il',::;:
I
l:l:;
Itl,
lrri
60 .5 62.3
103
19.5 52.9 't07
48.1
47 .2
98
52,6 54,3
103
19 ,1
47.6
97
24.9
37.O
149
146.5
104
1 50.0
111
32,9
3'.1.9
97
55,5 55,8
101
?5.9 26.0
100
49.7 43,8
88
42,1
41 .1 9E
27.4 33.3 122
19,9 28,0
141
IMPORTS
IN
TOOO EUR*112.4
|
108,0111.0
1113.1
e9 |
10577.7 80.4
103
97,8 84.9
87
21.9 25,2
115
?6,3
144 ,439.6
| 39,3?4
,3
l.42 .340.1
I 36,0szle5
101
1
e2110.7
EXPORTS
IN
r00Omillion
EURUni.ted Stat es trior1d1
Tota t
1974
1975
1974
=
1OO't974
1975
1974
=
1OO1974
1975
1974
--
100 19741975
1974
=
1002..
Trade balancesl'fith
the
exception of
balances
of
the
other
ulfavourabLe trend.
in
-3-the
OPECcor:ntries
andthe
tradir4:
area,§or
countries
1975
as
conparedwif}r
1974United
Statgs, the
trade
showed
a
moreor
less
-
seeTable
2
below:TASui- 2 Trade
balances
in
1000million
EUR-15.2
I-16,E
+0.4
I
-5,3
I-8,6
-1,E
I
-1,5
l-7.1
+45 19Ext ra -EC
-
4-3.
Brea,kdolrnof
world
trade bv
area
or
countr:v
The
d-istribution
of
world- trad.e
anong
the
main
trad.ing
areas
or
countries
is
as
follows:
TAsLE
]
Area
or
country
II{PORTS H(PORtrTI
't974 1975 1974 1975
World
EUR-9
of
which:
Int
ra-EC Ext ra-ECUnited. States
Canada
Japan ffi'TA
USSR
Latin
America
OPEC
100
38,1
18,0
20. 1
13,9
4.?
9.1
7.9
3.?
6.9
4,2
100
37.6
19.? 19.1
12.9
4.3
7.3
7.8
4.6
6.8
6.5
100
35.9
18 ,3
17.6
1?.7
4.3
7.2
6.5
3,6
6,4
16.0
100
37.6
18.6
19,O
13,4
4,0
7,16.7
4rZ6.0
-5-. 1-5-.
Wor1d.trade
excLudinA intra-Cornmunit:rtrade
In 1)lj,
i.rorld,trade,
excluding
intra-Conrmrrnitytrad-e,
lras
as follows:
.IA3I,E 4
-1
'Exòluding
trade
of
the
State-trad-ing countries
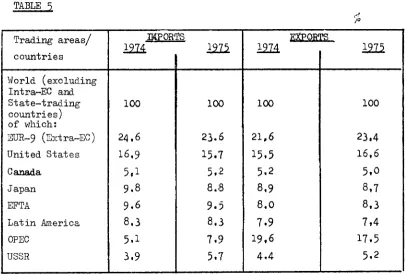
r2. Distribution of
viorld.trade bv area
or
by
cowttr^,'The
shares
of
the
different
trad,ing
areas
or
countries
in this
defi-nition
of
lvorld
trad"eare as follows:
TABLE q
Tra.d.ing
ar.arf
countries
IUPORSS
lq74
1.q75I
FYPORTS .
te74
1:7r
rr,lorlC (excluCing
Intra-EC
and.State-trading
countries)
of
which::iUR-9
(Ilxtra-lC)
United.States
Car:ada
Japan
EtrTA
Latin
AmericaOPEC
USSR
100
24,6 15.9
5rl
9.8
9,6
9.3
5.1 3.9
toc
21.5 15,7
5,i2
8. ì9
9,t.i
8..]
7 ,l)
5,'l
100
21,6 15,5
5.2
8.9
8.o
7,9
19,6
4,4
100
23,4 15,5
5'0
8r7
8,3
714 17,5 5,2
Tables
4
andj
i.enonstrate
a certain
,iecrease
in
-bjreshare
of
petroleu,,r-prod.ucing
coultries in
l"roric'Le:cports
in
1975as
compared r,.rith 1!lzl .2
Wor1d,1
9
(Extra-EC)WorId
(E:ttra-EC)
.
I}{PORIISÉ
tooomillion
653,9 154,4
toOO
milli.on-flJB
495,4 116,9
1474
=
10O103
99
1974
=
rO0É
toOo
E'I(PORTSmillion
640,9
r50.0
r000
ririllion
EUR 485,5113.7
,1a74
=
100103 111
ìq?4
=
10o 97]0,
[image:8.580.56.462.474.748.2]-
6-II.
IN
]NI
TRANE AI{DWITH THd BEST OF tù0RtD
1.
The
relative
scale
of
qeneral
trad.e
in
-1475In
1975,
the
Coronr:nityts
inports
of
227
40Onillion
EURrtpresented
Z7Ày'o
oi its
gross donestic
prod.uct (Cnp)
(as
agains+,
2*
400
million
EIIRand 25.5/"
in
L974) and
its
e:cports
of
22!
6OOnittion
EIJRrepresented.
22.L/o
of
GDP(zzo
ooo
million
EtIRand
24f"
in
t974).
Ibom
1974
fo
L975
in
the
Conrnunity,
inports
per
capita
d.ecreased-by
29
EtiR
(880
EURtn
L975
as
a6ains+
9O9U:n
in
T97O
ana exports
increased
by
16
EUR(869
EURin
L975
as a6ainst
853
u:n
rn
L)l!).
Developnents
in
the
United.
States over
the
saue
period. were
similar
to
those
in
the
Comnunity
(see Table
5).
In
1975t
the
Connr:nityrs
trade
balance inproved.
appreciably
a^ndis
nowvirtually
in
balance
(a
deficit of
2
866
nillion
E{IRas
a6ainst
a
d.eficit
of
14
{02
nil-Iion
EURin
L974).
The
rate
of
cover
of
e:rports
by
inports
ts
)flo
as agains+
94'/,in
L974.
Tlris
overall
balance,
however,masks
inbalances
at
MenberState
level.
OaIy
Ger"mamyhas
achieved.
aTABI.,E 6
Germarry-
(rR)
fhance
ftaly
Netherl-ands Belgium/
Luxembourg United. Kingdom
Ireland
Denmark
ELA-9
USÀ
Japan
RELAT]VE SCALE
(at
cument
oF
TRA.DEIlù
ffiImR^L
IN
1975prices
and
exchangerates)
IMPORTS
Import/export
ratio
/" roo0
miLfion
EUR
GDI'1 EUR Der
.ta
57.2
40 -1
29.1
2AS
?3.2 40.2 2.8 7.9
227 .4 78.0 43.9
17 .9 15.9
22 -1 43 -3
48.5 23.3
47 .5
29.4 2?.3
6.8
11 .8
I
--l
I
lGDP
=
Grossdonestic
prod.uct.;??i,",
l/,
*,'
I
*:
EIJR---
I
lcaPita
Balance
nillion
EIIR926
767
521 911
280
721
911
551 880
365
395
68,8 38,9 26.4 26.6 ?1.7 33.1 ?.4 6.6
?1 .5 15.4 20.3 43.5 4s.3 19.2 10.7 21.5 ?2.1'
7.0
11 .3
1113
738
t;73
1947
?136
590
768
1304
869
376
381
+11 577
-1
571-2
735+1 30
-1
442-7
145-435
-1
215-?
866+3
173-?
037120
96
91
100 94 82 86
84 99
'103
-8-2.
Geo$aphical
struqtuxe
of,
general
trad.e
in
1o?5The
breakd.ownby
origin
and.d.estination
of
the
Corrnr:nityrs gpneral
trade
for l)l{
and.}975
is
as follows:
TA3LE 7
For
the
geographical
analysis
of
general
trade
@
I,'lemberState,
see
Aruaexl.
dl io
Origin*/fostination
IMPORTS EXPORTSt974
t975
t974
t975
I
(rntra-EC)
I(Extra-EC)
Ich:
I.,
(industrialized
'
cor:ntries
)
|2 (d.eveloping
Icor:ntries
)
|3
(state-tractinj
cor:ntries
)
|
ttrorId EtiR-9 EUR-9
of
whi
CIass
Class
CIass
100 47
53
24 25 4
1.00
48
,2
25 23 4
100
5i
49
29
I5
5
r00
49
51
26
t8
-9-3.
Structr:re
of
general
trad.e
hr
commodity
goup
Ln
L)IJ,
general imports
comprised
43/"
(M/,
in
1974)
of
primary
products
(agricurtr:rar
prod.ucts, raw
nateriars +
seni-ma,nufactures,
energr)
and.>>/"
$S{"
in
L974)
of
rnanufactures;
exports conprised
Zq,'(Z@"
{n'Lg74)
of
prinarSr
products
and.Tfl
fiy/"
i"
L97ù
of
mànufactures'(see
Annexes{
and.5).
4.
General
trade
surpluses
and.d.eficits
by
product
The
following
table
showsthe
surpluses,
deficitsand inport/export ratios
of
generar
Comnunity
trade,
broken
clownby
crass
of
product,
for l!J{
a,ndL975.
TA3I.E B
(million
EURand /,)
s
I
t
c
hod.ucts
tg
Trede
'
balance
nillion
E(IR t4sxp/imp
ratio
/,
1
Tbad-e
balance
nillion
EUR e7-5I
n*p/,i*p
I ratio
lr"
0-9
0+t
3
2+4
5
7
6+3
9
o-4
5-8
frand.
total
Food.,
beverager and.tobacco
Fhel
products
materials
Chemicals
l
ifrzchinery
and. ]transport
Iequipment
Itranufactured.
lgoods
]Goods
A trans-l
actions
not
Iclassified.
elsJ
I
Pninary
|products
I
Marrufactured
Igood,s
II
-tM)2
-7549
l-,,,.,
l-,,,o0
I
|
+etti
+28013
+u95
+353
rwhere
-603?5
+45
6t9
94 74
25
36
t47
t65
1r3
113
42
r36
-2866
-7978
-32L26
-135?8
+77t5
+34E5
+)263
-1008
-53682
+5t824
99
75
27
37
t46
175
115 77
45
-
l0-III.
II.ITRA-COMMTINITY TRTDEII\I
1O7q1.
Developrnentof
intra-Community trad.e
in
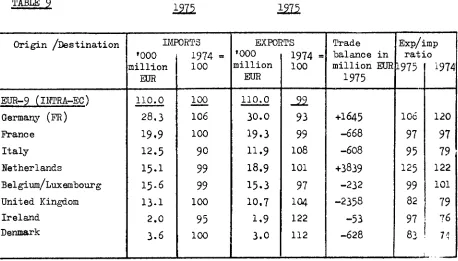
1o75The
following table
showst9742
TABLE O
intra-Corunwrity
trade
in
1975 comparedwith
107E 1075
Relative
shares
in
intra-Community
trade
in
19751975t
Gernarly accountedfor
26/,of
intra-Commr.uritytrade
(25/"in
L974); wasfollowed,
in
descendingorder,
by:Fbance:
\ff,
(unchanged.)Netherlandsc
l5/"
GS/,)BL,EII: 1{/
(unchanged)ftaly:
ll/"
(:uullchanged)United.
Kingdoml Lt/" Oq")
Dennark:
3/,
(uncha-need )frele,nd:
Z/" (:urltcluneed.)(for
the d.etailed pattern
of
intra-Community trad.e
b;r MemberState,
see Annex
6).
2.
In
it
Orig'in
pestination
]MF'000
Imillion
IEUR
IORTS
t974
= 100EXPOI
r000
nillion
EI]R
)ma
t
1974 =I
rooTrad.e baLance
million
t975
in
EUR
uxp/imp
ratio
1975
I
1974I
EUR-9 (rM'RA-Ec) Gernany (r'n)
trbance
Italy
Netherlands
Belgiun/Lr:xembour6
United
KingdomIreIand.
Denmark
110.0 28.3 19,9 12.5 15.1
t5-6
13.1
2,O
3.6
100 105 100
9o
99 99 100
95
100
1t0.0
30.o 19.3 11.9 18.9 15. 310.7 1.9
3.0
c)g
93
99 108
t0i
97
1,04
L22
t12
+t645
468
-508
+3839
-232 -2158
-r3
-628
10é
I
120e7l
s7e5l
7sr25
I
t2z
ee
I
101821
79%!
76 [image:13.584.70.528.195.456.2]-il-3.
Intra-Conmrxrit.v
trade
surpluses
and
deficits
in
Io?ETn
l)lJ,
the
i{etherlantls
and
Ciermarqrachieved.
surpluses
on
intra-Commwrity
ercportsrbut
only
the
Netherland.s recorded.
a
rise in
the
surplus
with the
ioport/e:cport
ratio
going up .by
3
points
(tZ5i,
as
against
L22i',tn
L974.).
In
Ciermarqrthe
import/export
ratio
went
downby
14points QOq
as
against
LzO!,in
1974)',
uhile
in
Belg.iumr/Lucembòrrrgit
was dorrn
2
points
(9fr
",
against
tOL./,:"n't97ù.-
In
t975t
trbancekept 1ts
exports
and.inports
in
balance
and.Irelandr
by
considerably
reducing
its
trade
deficitl
achieved
a
balance
(97%as
against
7q"
in t974.
As-for
ltaly
(95/,
""
against
7f" i" igtù,
mmoark
(834
as against
74',/,in
L97ù
and
the
United
Kingdom
(AZ/,
as
againsi
ly|
Ln
197ù
I in
spite
of
the
inprovement
in
the
import/expori
ratio,
these
corrntries
still
had.intra-Connunity
trade d.eficits.
The
following table
showsthe
intra-Comronnity
trade
sr:rpluses
and.deficits
by
MenberState:
T43LEro
rntra-comnunity
trade
sr.rpluses and
deficits
in
19?5
(mirl-ion
EtiR)D F
It
NLBtEl'
T'KIrl.
DKCiermaaSr
Fbance
trtaly
Netherl-antle
BtEIi
United
Kingfl.omfreland.
EonnarkEUR-9
(rntra-Ec)
E:rp/imp.
ratio
(.{
+II85
-322
-1099
+y9
+980
-22
+574
+L645
r06
i-l171
l.
I
rerz
|
-51'
I*rY
I+6or
l*a
I
*re
k;
-6r
-330
a
_?51
-29
+249-8
-I2I
-608
95
+I36?
+7Ol +414
a
+167 +9OI +26 +263
+3839
L25
-267
+ll1
-31
-L67
a
-34
-13
+168
-232
99
-11,3
-739
-418
-364
+333
a
+252 -27O
-2358
82
J
-3?
-,
fiz
f32
"8o
a
-L4
'53
97
-65:,
&
+l1I
-272
-175
+436
.:o
428
-
t2-4.
Strrrcture
of
intra-Comnwrit.v trad.e
by
coumodity
goup
Cornpared wi-tln
1974,
the stmctr:re
of
intra-Comnr:nity
trade
tn
1975for
the I{iire
as
a
whole vlas
as
follows
(76) :rqT5 la.74
Primary products(o-4)
of
which:
tr'ood
(o)
Beverages
a.nd.tobacco(f
)F\re1
procl.ucts
(i)
Rawmaterials
(Z)Oils
a.nd-fats
(+'lI\ianufactr:rp.d
flgod.s(ru)
of
uhich:
Chemicals(5)
Machinery
and.transport
equipment(?)
Manufactr:red.
good-sclassified
by
naterial(6)
I[i
scellaneous narrufactured.
articles(8)
10
l2
1
n
I
5
1
4
13
z
T 4 1
Goods
and
transactions
not classified. elsewhere(!)
I
IZ
IT
28
22
11
L]
L2
26
25 10
t
The
structr:re
of
intra-Comrnrnity
trade by
class
of
prod.uct
a^nd.by
i,Ierober
state
is
shoun
in
Table
rr
(tne
trad.e
surpluses
and.d.efioits
(*)
TABLI:
11
STRUCTU}ìi OF INIEIA-4OMMINITY TRADEBf
CLASS OF PROIUCTrI{
1q?5
(É)
I
=
importsE
=
exportsI
I
SITC
Seotloa
Gernr
rl
rnyIE
I,
FrancetE
fte
Ir
r1yrE
ltrethe:Ir
I lard.BE
BI
I
,HIIE
UnitedI
KingdonIE
Irel
I
lndEDenu
Ir
nrk
EEU8.
I
-9 Eo-g
Total
trade 100 100 Irì Ì00 100 100 t00 100 100 ]00 Loo 100 100 LOO 100 100 100O+1
3 2+4
5 7
6+8
9
É9
5-8
Foocl, beverages
a.nd tobacco
tr\rel
prod.uctsRaw
materials
Chenicals
Ilachinery
and.transport
eguipmeniI{arufactured. good.s
Goods ard.
trans-actions
not
clas-eified
elsewhere Primary products I{armfactured good e16
t0
i
i0
22
u
3
3l
AI
7 5
4 T}
3B
33
2
t5
83
11 5
4
L2
31 37
20 80
t9
3
7
9
30
3l
l
29 7O
22
4
9
t2
30
22
I
35 64
t2
4
2 6 29
47
1;
82 10
3
4
Lr
30
4t
1
t7
82
?4
l9
6 13
t4
24
4;
5r
L2
I
5
L0
l1
33
1
25
74
11
4 4
t2
22
45
2 19 79
24 7 3
9
28
27 2
v
649 7
,
t2
35 30
2
?t
77
1l
10
3
t4
25 34
2
4
74 52
2 5 6
10
24
I
59
4o
6
t4
2
T2
35 30
L
22
77 49
I
B
4
23
L'
5;
42
Ì5
7
,
1L
28
]l
I
27
-
14-rV.
COÙ!ì,|UMTY TRA.DE I,IITH THE REST 0F THE l{ORtDIN
1o7q1.
Developnentof
Cornmrnit.vtrade
with
nonqembercountries
in
1o75Itre foLlowing
table
showstrade
with
non-membercountries
in
1975 comparedwith
1974:TASLE 12
2.
Geomaohical
stmcture
of
Comsunit-vtrade
with
non+enber
countries
in
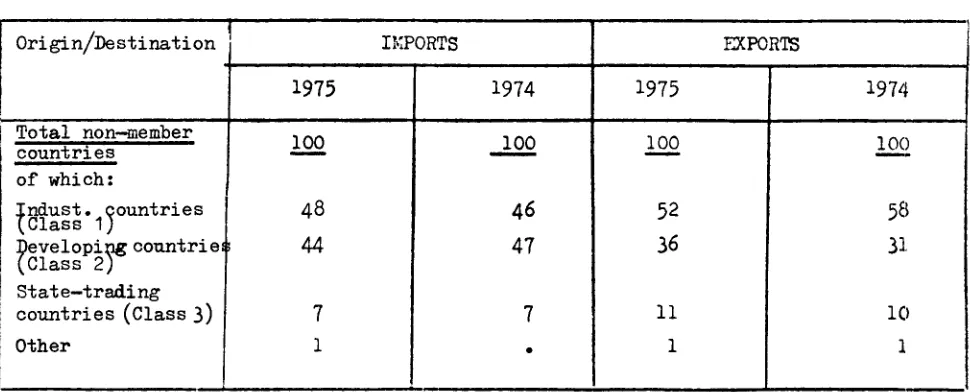
1975-In
1)lJ,
the
pattern
of
Conrmrnitytrade
with
nonaembercountries
was asfollows
by
comparisonwith
1974: TABLE 13Orig'in/Destination
I],lPORTS'000
udl-{
1974-tionEuR
I
foo
I
},XPOR§
1000
milì
1974=
Iion
EIIRI
tooTrade balance
Bp/imp
ratio
(/,)
million
EURTotal
non-membercountries
of
which:Cìass 1
(:-ndust.countri
es )Ciass
2
(d.evelopingcountrles
/Class
3
(State-trading
countries
Miscellaneoustt7.4
56.3 51,4
8.6
1.0
102 140
L+
100 88
l1 3.6
58,4 41,4
12.3 1.5
Iq
93
123
Ì17
106
-3802
+211l
-r0045
+3603
+525
143 150
2L
104
8r
Orig'in/Destination
II.:PORTS rr(P0RI§L975
t974
t975 t974Total
non--nerobercountries
ffir"ht
Ind.ust. countries
(Class
1)levelopipg countrie
(Class
2)State-trading
countries
(cfass
3)Other
100
48
M
7
1
100
46 47
7
100
52 35
1L
t
100
5B
3l
I(t
i
[image:17.585.58.543.557.753.2]-
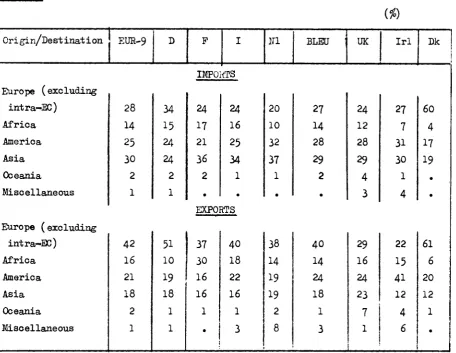
15-The
following
table
gives the
by
Member State:TABLE 14
-geographical
analysis by continent
3.
Conmmitytrade
balances
rrith
no4l.menbercountries by
tradine
area Ananalysis
of the
export/i-rnport
ratio
in
trad.e
betweenthe
Menber States andthe
rest
of the
world. shousa
certain
improvenentin
the
sitr:ation
for
rnost
courrtries:
Total
EIIR-9(Ertra-ffi)
of
ròich:
Gernar5r
Fra.nce
Ita1y
Dennark
Bi,EU
United. Kingd.orn
Netherlands
Ireland
lqTq ZL
134
96
8t
85 84 82 68
57
1074 gz,
r37
77 71 82 84 68 58
,5
(/")Origin/Destination
ErrR-9 D FI
ìn
BtE.II IIKIrl
DKDrope
(excluùing
intra-ffi)
Africa
Arnerioa Asia
Ocgani g
Miscellaneous
Europe ( exclud.ing
intra-tr)
Africa
Anerica Asia 0ceania M:isoellaneous
28
t4
25
30
2
I
42
1b
2t
18
2
I
34 15
zl
?4
2 1
51
10
19
18
I
I
IMPOi
4l
t7
l2Ll
36
I:l
I)(P9r
37
I30l
t5
I I':l
I
.l
TTS
24
r.6
25
v
L
rTs
40
18 22 15
I
3
20 Lo
32 37
1
38 14
19 19 2
8
27 14 28
29 ,.
4O
t4
4
181
3
24
t2
28 29
4
3
29
t6
?4 23
7
I
27
7 31
30
I
4
22 15
4t
l2
4 6
50
4
t7
r9
61 6
20
t2
1
a
[image:18.586.65.522.157.510.2]-t6-Itith
the
r:xception
of
Gernany,
dticb
had
a
surplus
trad.e balance,
nost
MemberSùates recorded
a
drop,
though
to
d.iff,erent
d,eg:nees,in
the trade
deficits
Ln
1975as
comparedwith
1974.
By conparison
with
1974t
the net trade position
by tracling
area
cha.nged.
as
folloln
during
1975tTA3LE.15
-É
Et
R+
(Ertra-m)
Germalgr
E'ra.nce
ftaly
Setherlanès
BLEI'
United.
Kingclonfreland
Denmark
eport/Import
ratio
(/")
Class
1Industr.
countries
Class
I
stateT:Tffns
cor:ntries
r975
1974t975
L914t975
L974l-94
t49
94 105 70 82
B5
6q 9o
111
L77 94
1l_0
85
99 80 7o 91
80
99
89
65
,o
73 84 46
8l
È..ì
JJ-80 60
4O
4I
,7
v
37
62
!&
201
159 113
I06
r36
85
35
6+
g
189 L22
88 103
14t
65
30
65
Class
2ueveloping
-
t7-Tabre
Lb
showsthe
surpluses
anddeficits
in
corunu::itytrad,e
with
the
rest of
world
in \)lJ,
broken
dovnnby
trading
area
or
country
andìy
Member
State:
TART.E 16 TRADE BALANCES
ry
TRADIIIIG AREA 11[1975 (nillion
EUR)Tradir:g
area
or
country
EI.IR-9
D F
I
NL BLEti IJKfrI
DKra-EC
-lB02
+9932 -901-2126
-37q
-i210
4t787 -382 -6r 8of
v;hichClass
1- +2Ì J.)
+719t -5t'T+u2
-1525-1q
-2196 -172 -2r,)EflIA
|
+6219Other
E\:rl
+5356iu.
.onericL -?840ofr,rhich;
|
_ena
.BISÉ"
r
i
-te+o
Class
2
-IO.O\J
+50C4 +2605
-28'
-335 -133 -119 +8.10 +676-1 5:0 -1538 -497 -12r.3 +396 +12!,) -975
-BÌ8
-322-30r9
+333 +276-20t5
-1887 -119 a827 +48 +298 -730 -538 -325 -865 -146 +266 -2139-t578
-177-1 671
_53
-23
-60
-58 -25 -160-t74
+li
-Ì01
-126 -39-Ì71
OverseasI -..
associated.
+/r1
Ot' n*n].CD: i
a.asy |
-r82
+4O6
42
Ner,r
TOI{
I -:i
glbm,gtgg.o! +1530
Other
I.African
|
+1029Central
EjS.
Aneri{a+1i26
l{.
Asia
l-tzSSo
Other |
-.^
class
2 i
-!bz
Class
3 |
+360f-147 -135 +)
-4t
+27 -865 +743+4gt
-341 +2719 +1324 +4r6+29'
-13
+24 +563+ttT1
29'
-4348 +J4l +846|
-t74
|
-,e,
|
+zr|
-tr
I +12
-32
+221 +101-32s|
+40 +2oJ-7t
-81 +14-4
4
+3-78
-L65 -2299 -274 +39 -47 -35 +13-18
-91 +84 +41.I +14-2t2
-213 +4 +3 +13-i9
+l04 +106-e56
l
-1835+103
i
-2t1
+:.80
|
-I91
-18
4
-7
a +L-3
+21 -133-J0
a+l +57-3
+57-o
+L +8 .+40 .f32 -.254 -46 -.:r48Eastern
rEurope
I
+3OqeI
Other
iClass
3 |
+!11+2466 +253 +682 +t6!, +184 +2L o +39 +t75 +5 -205 +14
44
-3
-r(.-r+.r I
lliscellanr
eouÉr I
+525 +1{). -r.9 +346 +6oz +184 -729
-3
-18-.t.
Struct
develooment
in
1975The
following
table
showsthe
trend.
of
Communitytrade
rrith
the
rest of
the
world
in
1975, broken
d.or^mby class
of
productr as
comparedwith
L9742raBr,E
17
or !!q_won!.u_I9f5
-._nnoH
mllN
tr
PR0DUCT(mi1lion
uun ana %)C
Q
T
Products II:,tr0RTS EXPORTS Trade
balance
kp/irop
ratio
lnillion
EIJR 974 100 7o
[trr:.o,
I
EUR 1974=
100nillion
EUR
v9
lro**
external
Itraae
(EIIR-9 )1L7357 94 100 r.t 3555 105 00 -3802 97
Food
I
iBevera6es
and
iitobacco
brud.e
materials
I I
puel
productsI i
heeetable
oils
I
"and
fats
bn"*i".t=
hlrrrrf
,"tlred
sood.sPlassf,t-rect by
haterial
$achinery
and,.$ranspoT-t equ].ploer
h{iscellarreous nanufactured.
lrticles
Goods and
trans-pctions
not
class:i-pied. elsewherePrimary products
:-J-ndustr].al
products
,
5
lo-+
l-a
r){
1t4755
I
iz,i
I
,::oz
Iieroa
I
zs,
I
srss
1,,0,,
I
j+rr:
I
azr:
l**
IuEu,
lot
t,
106
r09
82
90
5o
85
8Z
10?
109
193
91 97
13
I
13
31
t
4
15
I3
7
2
59 39
5855
]r82
211 1
M5t
450
r.2843
248?4
50104
9271
2064
rM99
o7q2
101
107
84
95
100 88
94
120
l03
123
96
r06
t,,
t,,
t:
:
13 85
-8900
+367
-t3256
-319 t7
-312
+7788
+7790
+!A69
+I058
-8To -54038
+51105
4.O
1i,0
t4
T2
;q
2i4
1,46
320
ll3
70
.21
-
19-structure
of
the
communityls
trade
with the
rest of
the
world
in
1975-by
group
of
products
4
-
rmports
lll)
Total
i
tSl
000
rnillion
=
1gg/oB
-
kpor+s L)lJ
\
t-O+ CL
EF
§.-t.L
\:,
c
Q' EI CL
S
ET
o.
w)
ft;'",:b
yL
*"0
fli1""4
I**
*tott"t"
ilachlnery and transport
equl plent
0ther nanufactur
{r*,
l{anufactured goods class.
By mterl al
To*aI $
ryo
ooOmilli
on
=
!o@oo,
-
20-Dr:ring L974;
the stnrctr:re
of
trade
by
prod.uct
changed.as below:
NYIPORTS
EXPORTS1o75
lo74 1q75
Lo740-l
Total
erbernal
tra.de
(tIun-g)
O-{
Prinpr.y oroducts
0
FoodI
Beverages
and.tobacco
3
I,\re1
products
2
Crr:dematerials
4
Oils
and,fats
!-B
Manufactured.
good.s!
Chemicals6
lvlanufactured
goods
classified.
by material
7
lliachinery
and.transport
eguipmentB
MiscellEuxeous
manufactured
articles
!
Goodsand
transactions
not
classified,
elsewhere
kinary
products
Manufactured.
good.s100
10052
6013
1111
31
3213
1511
100
I00
].1
a
56
1I
44
23
o.4
09!
13
J9
95
511
16
22L2
4468
12
4
L5
13
7
Z
24
39
B 2
(Anrrexe
!
gives
the
composition
by class
of
product
for
the
MemberStatee)
5.
Trad.ebalance
with
non-mernbercountries
b.vclass
of
prod.uctln L)lJ,
the
Comrnr:nityrstrade balance
in
manufactured.
products
improved.consid,erably and
in
primary
prod,ucts varied,
litt1e.
The
erport/inport
ratios
vJere:1q75
2L
ZtL
Lq74
20
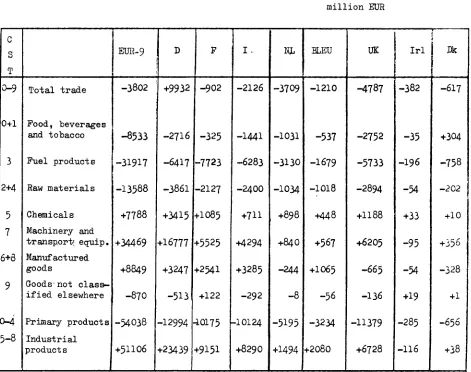
-2t-Table 18 shows
the trade
balancesby
class
of
productT4ntElg
coifi'fiIi]Tr
rRADE BALA]iCES rjrrH NoN-irrfl{BER coUNtRrES BrCLASS OF PRODUCT
]N
1q7qmilLion
EURT
EUrì-g D F
I,
N,t I[,EU I.KIrL
DK0+I
3
2+4 5 7
9
o-4
,-8
trade
Food, beverages
and tobacco
FueI products
Raw
materials
Chenicals Machinery and
transportl
eguip. Manufacturedgood s
Goods'not
class-ified
elsewherePrimary products
lndustrial
product s
-3802
-85r
-31917
-13588
+7788
]
+3M5s
I I
+8849 I
-*.
I-54038
|+51106 |
+9932
|
-zve
I I
-6417
-3861
+1415
+t6777
+3247
-51 3
-t2994
+23/39
+02
I
-3'5
l-7723
l-,,*
I
i+toB5
+552'
+2/L
+122
-r017,
+!111.
-2r26
-LMI
-6283
-24OO +711
+4294
+3285
-292
-tot24
+B2go
-1709
_Ì031
-31 30
-1034
+B9B
+B4o
-244
o
-519'
+t494
-1210
-537
-t679
-1018
+448
+567
+J.06l
-56
-32y
+2080
4787
-2752
-5733
-2894
+1188
+620J
-665
-1:e
-11379
+6728
-382
-3'
-196
-v
+33
-95
-v
+19
-285
-r.15
-6t7
+304
-758
-202
+10
+j)5
-328
+1
-656
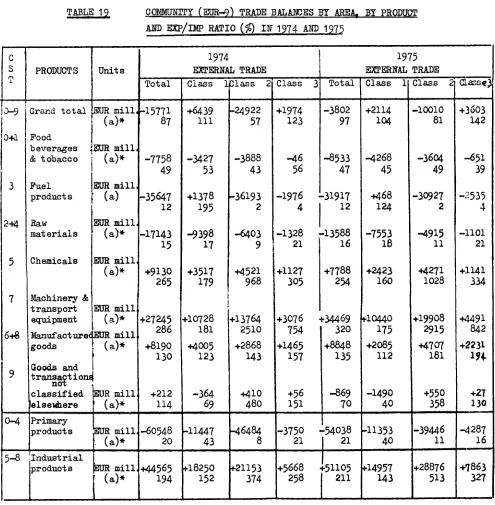
[image:24.585.59.530.167.539.2]-22-The
pattern
of
trad.eby
tradlng
area andby class
of
proiluct
has d.eveloped. asfollows:
TABLE
10
COMMUNITY (EI'R-O) TR.IDE BAI,AIOES BY ANE4 BY PRODUCTa§p
EP/.Eg
RArro(0
.rJ19T4
Ai,rp loTEC
a
T
PRODI'CTS Units
1974
EMERIIAL TR.ADE
r975
E]SERNAI, TRADE
Total
Ciass
lr lassClass
3l
Tota1 ClassClass
,l
Gaosq;.H
0.t1
À14 3
5
7
6{8
9
Grand
total
I
Food
Ibeverages
,i&
tobacco
i
Fuer
Iproducts
iRaw
Inaterials
tI
Cheuicals
I I
Machinery
&l
transport
Iequipnent
t
lGnufactured
goods
IGoods
ana
I transactiondnot
ì
lclassifled
IlerEeròere
iEUR nitr1
(,)*
EIJR
nltl
(')*
EUR
uilI
(r)
[image:25.585.45.540.146.651.2]EUR
nil1
(")*
EIIR
nill
(
")*
EUR
niII
(.)*
EIIR
nill
: (a)*
R
nill
(")*
lt577t
iez
-7758
49
_35647
t2
-u143
r5+9130 265
+2745
286
+8190 130
+212
114
+6439
r11
-y27
53
+1378 195
-9398
u
+3517
t79
+1.0?28
1BT
+4005 123
-364
69
lugzz
r57
I
-3BBB 43
-36193
2
-(,403
9
1452L 968
+t1764
4510 +2868 143
I I I
I
*+roI
+eo46
56
-L976
4
-1328
2L
+lL2l
305
I-8»r
1,,,1;
t"
-r.3588
r6
+?788 254
+1974
l-$oz
123
I
gt
+3075
+34/.69754 I
320+L465
l*Saas157 |
135-869
7O
+56
r5I
+2114
r04
4268
45
+468 L24
-75r3
18
+423
160
11Ofio
t75
+2o8J 112
-1490
40
-I0010
B1
-3604
49
-3q27
2
49t5
I}
*427t
Ì028
+19908 29L5
+47sI r81
I
+550I»s
+3603 L42
-65Ì
39
-,7535
"1
-I101 2t
+,I141 334
+149I
u2
+223L
rr+
+27
Ilo
w
Prfuoaryproducts EUR
niII
(")*
-6054820-tt447
43
-464U
I
I
3750
-540382t121
-113534039M6
II
-4287Ì6
5-8
fun
n*r
I
(")*
1{r'565t94
118210
t52
r2).1113741r,,0,
I
zrr
+5668 258
ù4957
143
+28876 513
+?863
327
-Report ing countri es
0rl gl n
tUR-9 ll F I ilL BTEU UK
lrl
DKEIIR
lli o 7517\ Hi o EUR 751ru llio Elfr ?sl7\ lit o EUR 75/7ò ìlllo EUR Tslt lll o tUR Tslt\ lli o EUR 75ltq lli o EUR 75/7+ lli o EUR
tsl7l
IIORLD
I ilIRA.EC EUR.g
EXIRA.EC EUR-g
CLASS I
EF IA
OTHER I{TSITRI{ EUROPT
IIORTH AI{ER I CA
OTHER CLASS I
CLASS 2
OVERSTAS ASSOCIATES
of uhlch AASl,l DE PARII.IE iITS TERRITORIES
TIEII IERRITORIES
OTHER AFRICA
CETITRAL & SOUTH A}IER.
I'ESIERtI ASIA
OIHER CLASS 2
CTASS 3
ilSftm'EURoPf
)THER CLASS 3
tiltffibbtÈt8t'
2?7 3ffi
110 038
11 7,357 56 281
17 009 7 198 2?.65'.1
I
t23 51 4055.399
2 822
2+6
tm
372
I
0776 53?
2t 198
6 19{
8 618
7 9r7
702
1 02t
97 100 9r 100 99 93 98 111 88 88 78 119 127 165
n
n
91 102 102 103 9+ 1105? 2{{ 28 339
28 905
11 701
11 +4?
851 r53 10 76 ,n 3 0f0
1 988
3 [7r
2 087
2 688
2 \7?
211 ?3
rs3
2 326
{
9632 r{8
101
$
93 129 ,IA' 83 95 85 118 103 102 122 139 103 106 100 10?'t 08
10{
100 127
E2
40 +29
IJ J+J 20 {8{
I
1392 037
1 f3{
3 \27 1,212
1 996
1 119 193
210
?2
1 613
7S
5 929
610
1 128
1 .280
t.lt 19 898 10 97 100 10{ 93 95 90 89 82 11? 13r ,AA ?4 89 96 93 117 120 9r 133 9? 100 9{
29 089
6 {r3 1 683 805
2 96r
99'l
8" 576
651
365
3
35
2
1 671
1 097
r
739[18 12 r89
16 599
1 570
1 {70
100 11 89 90 89 1m
$
78 100 110 81 79 ?s 52 8l 82 60 85 91 7t 97 97 IUJ 11715 089
11 {32 5 119
1.232
s13
2 8{5
529 5,6t8 r58 2+6 0,5 88 36 757 685 3 029
718 520 666 601 65 0,f 26 105
s
91 111 111$
106 8{ 193 231 267 67 101 103 106 111 115 80 20 100 99 101 166 5s5 611 573 f3rI
9 10 330 3971 601
285 50{ 467 37
I
?3 15 7 3 1 1 3 912 200 376 n2 62r 186 98 9S 9[ 66 61 312 221 170 8t 87 9[$
101 102 86 82 101 1'.!1 95 97 100 86r0 2t8 13 051
2t 191
1 r.6r0
3 95+
1 362
5 997
3 321 10.3n 755 18? 1 60 ?nA
1 53r
1 {07
r
79{1 882
1 307
1 185 122 879 93 100 90 c2 89 79 92 105 8l 92 70 116 R 1q2 68 95 82 97 89 91 1E IJ 116 850
1 97t
8?9 +n 111 5? 235 11 297 37 11 8 0.1 ? 2? 21 163 t7
n
69 3 33 2 93 95 91 92 8t ?6 96 109 91 101 3s2 IS 1+ 151 79 69 96 88 90 91 6l 85I
850 8503 6ù1
r
2r92
1 825
Coomunttv exoorts tn ì9?5 and volume tndlces 1975/i[
Reportl ng
coun trl es
Destlnati on
tUR.9 D F I IL BLEU UK
lrl
0kllio
EtlR frs/ zr tlio tUR ?sl7+ }1iO EUR tsl7+ lti o EUR 7517\ ttio tUR 75lt+ llio EIJR 7511{ llio TUR 75111 Hio EUR 7517\
;1 o EUR 't511\raoRl.I)
IIITRA.EC EUR-g
E)(TRA-EC EUR-S
CLASS I
$TA
OTHER }IESTERII EUROPT
I{ORTH AITERICA
OTHER CTASS I
CLASS 2
dlEF§Eis ASSocTATrD
of vhlch AASI{ DEPARTIIEIITS
TERRITORIES
IIEII IERRITORIES OIHTR AFRICA
CIIITRAL T SOUTH AIIIER,
IIESTERII ASIA
OTHER CLASS 2
quss 3
EAS.IIRII EUROPT
oTrff cl-ASS 3
}II SCELLANEOUS
I'IICLASSIFIED
224 530
tì0
q75il3
55558 395
23 2r8
12 551
1t 811
7 783
{1 359
6 110
2 6{0
652 398
n1 10 106
7 66r 11 61? 5. 832
12 251
11 039
1 212
1 5{9
r02 99 r05 93 96 101 8[ 89 123 11t 11r 119 95 100 139 103 1r9 10r 1'.t7 117 12\ 106
68 82r
I
967r
932{
6782 315
r1 323
70{
31?
19
35
?2
2 175
? ?3?
3 965
1 ?16
5 {07
{
9r3{6r
215 29 98r 38 837 892 2l 96 93 98 90 93 102 ?8 81 11r 92 95 130 58 95 130 8? 160 90 ilu 109 115 95
38 858
I 9"276
t9 582
7 ,623
2, 877
2 110
1. 891
?t5
9 68r
3 320
1 .575
+87 196
16
2 787
1 015
1 582
951
2 273
1S2
311 1 13r ll5 121 119 102 8? 115 111 115 151 152 ì08 99 tì8 96 98 10{ 89 92 153 1{8 10726 35{
ìt
881t{
r736 78r
2 079 2 0r8
1 989
668
5 5s7
\1i 202 2r 23 15 21r
1 198
1 532
r59
1 775
1 65r
i21 35? t08 t09 109 95 98 98 95 83 129 101 101 103 111
n
103 128 1{6 102 125 12r 133 922 821 387 161 15 8{ 32 680 520 730 505 ?0s
t8 92?
7 723
6m 10{
603
26 650
3 59{
1 566
789 830 {10 ì0t 8? 93 95 71 87 118 105 119 117 93 117 136 91 111 115 106 99 177 116 ì01 ì00 724 203 21 3
lrs
322lo+or
68{
6t3
42
193
1 2{8
6?l
982
298
2
322361 222 8 12 1?+ {3+ 503 635 388 96 97 9{ 8{ 90 103
n
77 110 93 95 9i 88 112 127 88 133 107 97 9? 98 135 33 ì03r0 693
22 110
12 r{3 3 808
1 628 3 858
3 150
8.701 708 1r8 15 tQ 171
1 9r5
1 2r1
2 959
1 668
1 115
979 136 150 ì0{ 109 r07 98 101 10{ 91 99 129 116 't?0 187 119 112 152 123 r6 101 116 122 86 88 13? 18 2 0,8 0.3 2 t8 21 30 17 26 {ì5
I
9t8 {97 305 51 33 175 16 ? 26 0,09 30ll5
122 9r 8t 98n
78 86 113 160 130 lIS ?0 59 283 {5 185n
10t 10r 198 150 605 5512 973 3 632
2 6
1 652
Arrnex
ì
-25-GeoAraphical
strrrcture
of
generaltrade
in
1o75(")
rMPoRrs(/ù
t975 ErrR 9 D F
I
NL BLEI.I UKIrI
DKworld
i
Intra-EC
EuR-g
I* *t"*
] Germar5r France
ftaly
Netherlands Belgiun-Lux. United, KirgdonIreland
DenmarkIntra-E
EUR-g".t -.."",
IClass
1
|EIrA
lOther
Europe
INorth
Anerica
iof
vùrichrUSA
I
Other Class
1
I
g.I"s,g-_a
Ioverseas aseociatesl Other
Africa
Cen.
&
Sth. America illestern
AsiaOther Class
2
|Class 3
Eastern Eìrrope
Other Class 3
@,
100&A
t2.g
8.85.'
8,2 6.6 4.5 0.8 1.2 5l .6,L9
7.'
3.2 :ro.o 8.5 4.1 22.6 2.4 4,O 2.9 IO.62.'l
f,.9
3.5 0.3 0.4 r.00 44.§ 12.0 9.3 14.0 8.5 3.8 o.4 1.5p,2
25.7 8.7 4.O 8.2 7.74.3
20.0r.5
5.3 3,4 5.1 3.6L7
O'14,3
0.4I
E-4q.3 19.0 8.9 6.3 9.64.8
0.32.I
50.720.
r
5.o
3.1 8.5 7,6 3.1 27.0 4.9 4.O 1.9t4.7
r.5
Jé
o 3.2 o.4 r00 42,qu.l
13.3 4,7 3.2 3.3 o.?l.l
57.L22.t
5.8 2.7r0.2
8.7 3.420. q
2.2 5.7 3.8 16.3 1.4
,A
5.1 o.3 0 t00 56.q 25,17.6
,:5
14.0 5.7 0.2 0.7 43.1ta.3
4.6
1.9 10.7 919 2r0 21.3t.7
2.9 2.6 1.1'4
2.72.\
2.3 or2 o 10067.t
2?.O 17,4 3,9 16.8 6,2 0.3 0.53a.2
Ì6€
5,2].6
7,4 6,4 2.7u.g
2.5 1,4 L.7 6,g 1.2?.3
2.O 0,2 0 Ì00 3214 8.1 6.7 3.4 5,5,:o
É3,
9.8 3.4 14.9ll
.3 8.3 ?2-9.Ì,9
3.8 3.5 11.9 4.78.
2.9 0.3 2.2 3.1 2,5 67.A 100 t00 6a,2 4§.47.0
I
19.?5.1
I
:.a
2.5
I
?,53.2
I
S.a1.8
I
3.548.8
!
|
ro.l
0.1
o.8i
-3o,8
|
:+.1
it6.L
i:e.l
4.0
I,r..
2.0
I
l.z
9.2
16.5
'l.,2
I
6.:.2,5
|
2.4ro.4
I,r.e
;t,-
o.g
I
r,3
o.g
t,
z,q5.7
lt,9
1.6
I
'.,'
L2
L"É
2,4
I
:.0
0.1
I
o.al-
-26-Georraphical
stmcture
of
teneraf
trade
in
laTE(r)
nxponrs
(/)
Arurex 3
!975 EUn-9 D F
I
NL BI,EU IJKfrI
*
World
Intra-EC
ELIR-9-of
whichOerma^ngr
hanoe
Ita1y
[etherland.s
lelgiun-Lux.
Uaited
KingdonIreland.
Denrnark
Ertra-EC
EUR-q100
4ai4
12.29.2
5.'
7.L7'O
5.9
o.g 1.5 qo.5 26,O 10.45.6
6.6
5-5
3-4 18.a2.7
4.5
3.4
5.2
2.6
5-54.9
0.5
o.7
100 43.6]1.7
7'3
10.o
7,5
4.6
o.3
2,1 56.4 31.8 14.57'2
5,8
5'9
3.3
t6.4
1,0
3.24.0
5,8
?.5L-2
7:2
0.7
9s1t@
4q.6 16.79.8
5,?
lo.3
6,,
0.3
0.7
50.4t9$
7.4
5,4
4.9
4,Ol'9
24.q8,,
7,2
2r74'1
2145.q
5.0
o.B 100 4q.1 19,7 13.34'?
3'4
416 o.2 0.7 64.q 25c77.9
7.8
7.5
6.52.5
21. L
1r8
7r2
4.5
5rB1.7
6.7
6.3
0.4
1".
ì
100
7t.
o 30.1 10.2 5.O 14.69.r
0.,3 1.7a.o
1J:5 5.,93.0
3.12.'l
'lE tt) 10.6 1.42.6
2.O2.7
1.9 ?r§.2.2
0.4
2.ì
roo 70.5 22,319.I
4.o
17.1 6.5o.2
I.3
29.5t4.7
5.7
3.14.5
4.1
1.4 10.7 1.72.0
2.3
2.9
1.9
lÉ
3.0
0.2
o.9
100 32,3 6,4 5.92.8
5.6
4.7
4162.2
67,7 100 7q.48.0
4.4
2.8
6.0
3.7 54.20.3
20.6 1004q.o
13.53.2
4,8
2.8
1r5 18.80.J
55.0 38.7 25.O5,2
6.?5.J
2'J
12.l
2'o
2.2 3.33.e
1.54.0
3.50.5
oof
rhich
Clags
1 EF'TAOther
Europeforth
Anericaof
whioh USAOthor
C1aee 1Class
2Overseas associates
Other Afrlca
Cent .& Sth . Aneri ca
llestel:tr Asia
Other
Class
2Gless
I
*"-"*, Europe
IOther Claeg
,
I
Iiscellaneous
ISTRUCfl'NE OF CENERAL IRADE
Br
COIITrI{EI{T1eT5 (%)
EUR-9
Gema.r5r F rance
Ita1y
tretherland.r BLEIIUnited
K i ngdom I re Iand Denmark
Imp. Ex p. Imp. Exp. Imp. Exp. I mp. Exp. I mp. Exp. Imp. Ex p. rmp. Exp. Imp. Exp. Imp. Exp.
ITORLD 100 100 100 100 100 100 100 100 100 '100
100 100 100 100 100 100 100 100
Europe
Africa
'Anerice
Asia
Ocea.nia
Other
63
7 13 16
1
70 8 11
9
1
1
67
8
12 12 1
72 6 11
10
1
61
9
1',l
18
1
68
15
8
8
1
57
I
14 19 1
67
10 12 9
1
1
66
4 14 16 0
82-4
6
5
1
2
76
4
9 10
1
E2 4
7
5
1
1
49
8 19
?o
?
2
52
11
16
16 c
78
2
9 9
1
1
84
3
8
3
1
1
78
2
9 10
1
79 3 11
7 0
I
r\9
{
I