White Rose Research Online
Universities of Leeds, Sheffield and York
http://eprints.whiterose.ac.uk/
This is an author produced version of a paper published in Journal of Atmopsheric and Solar-Terrestrial Physics.
White Rose Research Online URL for this paper: http://eprints.whiterose.ac.uk/4060/
Published paper
Brown, B.H. (2008) Short-term changes in global cloud cover and in cosmic radiation,Journal of Atmopsheric and Solar-Terrestrial Physics, Volume 70 (7), 1122 -1131.
Short Term Changes in Global Cloud Cover and in
Cosmic Radiation
1 2 3 4 5 6 7 8 9 10 11 12 13 14 15 16 17 18 19 20 21 22 23 24 25 26 27 28 29 30
Brian H Brown†
Abstract
Galactic cosmic rays (GCR) have been suggested as a possible contributory
mechanism to cloud formation. If these are significant then, in addition to the
similarity between long-term(years) changes in GCR and cloud cover, there
should also be a similarity over shorter(days) time scales. This paper reports an
analysis of changes in global cloud cover and GCR recorded at three hourly
intervals over 22 years. There is a significant correlation between short-term
changes in low cloud cover over northern and southern hemispheres, consistent
with about 3% of the variation arising from common factors. However, GCR is
not a major factor responsible for cloud cover changes. There is an association
between short-term changes in low cloud cover and galactic cosmic radiation
over a period of several days. This could arise if approximately 3% of the
variations in cloud cover resulted from GCR.
Keywords: cloud cosmic global correlation
†Professor Emeritus
Medical Physics University of Sheffield Royal Hallamshire Hospital Sheffield
S102JF
1. Introduction
12 3 4 5 6 7 8 9 10 11 12 13 14 15 16 17 18 19 20 21 22 23 24 25
This paper addresses two questions: firstly, do measurements of global fractional cloud cover show evidence of short-term (a few days) external or global influence? secondly, is there evidence of a short-term association between galactic cosmic rays (GCR) and fractional cloud cover?
The context of these questions is the possibility that galactic cosmic rays might affect the weather. Ney (1959) first made this suggestion and thought that
ionisation by cosmic rays within the lower atmosphere could be a possible mechanism. It has been suggested that ionised particles could act as nuclei for cloud formation and hence be a plausible explanation for a correlation between GCR and cloud cover. Alternative explanations include the electro-freezing effect on clouds due to vertical currents induced by the interaction of the solar wind with the magnetosphere (Tinsley, 1996) , the indirect cloud modulation by UV- heating of the stratosphere consequent changes in global circulation patterns (Haigh, 1996) and changes in total solar irradiance (Kristjansson et al 2002).
close correlation between GCR and low cloud cover which they attributed to
problems experienced by ISCCP in inter-calibration of satellite measurements during 1994 and 1995. The approach adopted in the research now reported of looking at short term changes should minimise the effects of possible long term calibration problems.
1 2 3 4 5 6 7 8 9 10 11 12 13 14 15 16 17 18 19 20 21 22 23 24
The publications referred to in the previous paragraph gave rise to many criticisms. Most of this criticism arose from the conclusions that had been drawn about how the measured changes in cloud cover might affect global climate. Gierens and Ponater(1999) made several criticisms and pointed out that the correlation
between cloud cover and cosmic radiation had only been made for data collected over the oceans and excluded data from the tropics. More recently Usoskin et al (2006) showed that spurious correlations can arise between cloud at certain levels and GCR as a result of the strong correlations between cloud cover at different levels. The effect of these spurious correlations varies geographically. These spurious correlations will not produce a correlation between GCR and cloud where none exists but they will make interpretation of geographically variable correlations very difficult.
Harrison and Stephenson(2006) inferred cloud cover over the period 1951-2000 by using the ratio of diffuse to total solar radiation and showed a correlation with days of high GCR. To avoid problems in the use of temporal data they used a scatter plot and a local polynomial fit to emphasize the non-linear relationship
Research into how GCR might affect global climate is still a controversial area. Most of the research has been based upon correlations between cloud and cosmic radiation time-series. Unfortunately the attachment of an appropriate statistical significance to time-series correlation is difficult, although methods of dealing with this have been suggested. One of the difficulties is that the existence of a significant correlation does not imply any causal relationship between the two variables and indeed the correlation may be an artefact. A second difficulty is a particular problem when time series are correlated and concerns how to attach a statistical probability to the result.
1 2 3 4 5 6 7 8 9 10 11 12 13 14 15 16 17 18 19 20 21 22 23 24 25
The problems in attaching a probability to a correlation coefficient between two time series were recognised a long time ago. A simple test of significance makes the assumption that the observations are normally distributed and that successive observations are independent. The first assumption has been shown not to be
calculating an ‘effective’ sample size based upon the first moments of the
autocorrelation functions of the two time series. All these papers appear to have been based in part upon the work of Bartlett
1 2 3 4 5 6 7 8 9 10 11 12 13 14 15 16 17 18 19 20 21 22 23 24 25
(1935) in which the variance that can be expected by chance on the correlation between two time series is discussed. This is the method that has been adopted in this paper.
The continuity of data from the ISCCP project gives a growing data base that should enable some firm conclusions to be drawn. The purpose of the research described in this paper was to take a critical look at the suggested relationship between GCR and global cloud cover and to see if short-term correlations exist. Global data on changes in cloud cover and GCR at 3 hourly intervals over 22 years are analysed.
2.
Methods
Data on cloud cover, GCR and geomagnetic variations were obtained at 3-hourly intervals over the period 1983-2005. In all cases the data were filtered to remove spurious correlations. A high-pass (4 cycles per annum) version of the data was derived in order to investigate short-term(periods between 6 hours and 3 months) changes in the variables.
2.1 Cloud
The D1 data is produced every 3 hours on an equal-area map of 280km resolution and merges the results from separate satellites with data on atmospheric humidity,
temperature and on ice and snow. 1
2 3 4 5 6 7 8 9 10 11 12 13 14 15 16 17 18 19 20 21 22 23 24 25
The D1 data were downloaded from the British Atmospheric Data Centre (2007) and from the Atmospheric Science Data Center(2007). These data were downloaded for the period 1st July 1983 to 30th June 2005 and occupy 320 MByte per month.
D1 data contains 202 parameters for each of the 6 596 cells that cover the globe. The ratio of parameters 11(total number of pixels) and 12(number of cloudy pixels) was used to produce the fraction of cloudy pixels. The sum of parameters 28(number of IR-cloudy pixels 680<PC(Cloud top pressure)≤800 mb or hPa) and 29(number of IR-cloudy pixels 800<PC≤1000 mb) as a fraction of parameter 11 was used to give the fraction of low cloud pixels (IR-cloudy pixels between 680 and 1000 mb). Low cloud top temperature was derived as the mean of parameters 111(Mean TC(Cloud top temperature) for IR-cloudy pixels 680<PC≤800 mb) and 112(Mean TC for IR-cloudy pixels 800<PC≤1000 mb). In all cases the parameters were calculated separately for the northern and southern hemispheres.
In order to reduce spurious correlations caused by the presence of a regular daily variation in all the measured parameters a band-stop filter was applied to all the data. This digital filter was applied in Matlab® and was applied to the fundamental frequency plus the first two harmonics and was a 5th order Chebyshev filter with a
sets filtered in this way were given the extension _HP. A 10 day stretch of unfiltered and filtered data is shown in Figure 2(a).
1 2 3 4 5 6 7 8 9 10 11 12 13 14 15 16 17 18 19 20 21 22 23 24 25
2.2 Cosmic radiation
Proxy data on GCR were obtained from the Moscow neutron monitor(2006) as this gives continuous coverage over the period 1983 to 2005. The data were downloaded as hourly data and then an average of the counts per minute taken over 3 hourly intervals to give data in the same format as that for cloud cover. The intensity of GCR is a function of geomagnetic latitude with an approximately 10% increase from the equator to the latitude of the Moscow monitor (53o N). The data downloaded was already corrected for atmospheric pressure variations and the same temporal filters were applied as were used for the cloud data to provide the derived parameters Cosmic and Cosmic_HP. These vectors were of the same length as those for the derived cloud parameters.
2.3 Geomagnetic variations
1 2 3 4 5 2.4 Analysis
As discussed in section 1. there are considerable problems in the use of correlation coefficients in the analysis of time series where successive data points are not independent. In this paper this problem has been approached by using an ‘effective sample size’ (see Meko(2005)) N′ given by:
6 7 ) 1 ( ) 1 ( 1 1 1 1 y x y x r r r r N N + − = ′ 8 9 10 11 12 13 14 15 16 17 18 19 20 21 22 23 24
where, N is the sample size and r1x and r1y are the first order autocorrelation
coefficients of the time series x and y.
The statistical comparisons use a two-tailed t test.
3. Results
The data were analysed separately to identify first long-term(years) and then short-term(periods between 6 hours and 3 months) changes.
3.1 Long term changes in cloud cover and cosmic radiation
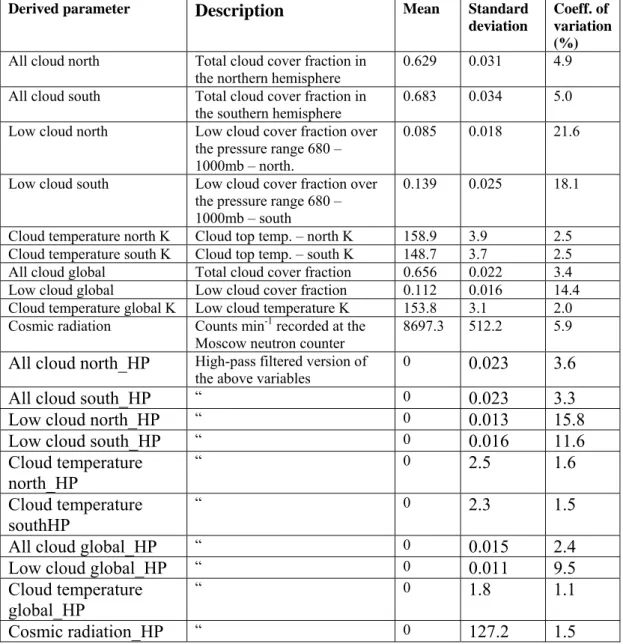
Long-term data were recorded at 3 hourly intervals over 22 years, with a band-stop filter applied to reduce daily variations and with an anti-alias filter applied. No high-pass filter was applied. Basic statistics on the cosmic and cloud derived parameters are given in Table 1. The names of the derived parameters given in the first column will be used throughout this manuscript.
in the two hemispheres. In order to identify any similarity the correlation coefficients between the data for the two hemispheres were calculated. All cloud north and All cloud south give a negative correlation (-0.033) but the number of degrees of freedom is only 13, even though the number of data points is large (64 288). Low cloud north and Low cloud south give a positive correlation (0.071) with 213 degrees of freedom. Cloud temperature north and Cloud temperature south give a positive correlation (0.338) with 6 degrees of freedom. None of these correlations reaches a 5% level of significance because of the low number of degrees of freedom. The degrees of
freedom were calculated using autocorrelation coefficients in the way described in the methods summary.
1 2 3 4 5 6 7 8 9 10 11 12 13 14 15 16 17 18 19 20 21 22 23 24
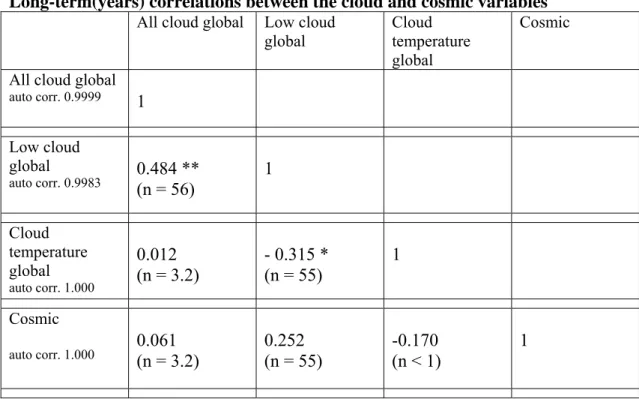
In order to identify any long-term similarity between GCR and cloud data correlation coefficients were calculated and are shown in Table 2. Again the
calculated values of the number of degrees of freedom to be used are also given. The correlation between All cloud global and Low cloud global is significant with p<0.01. The correlation between Low cloud global and Cloud temperature global is also significant with p<0.05. None of the correlations between the cloud parameters and GCR reach a 5% level of significance. The correlation coefficient between low cloud global and GCR (0.252) has a p-value of 0.06. In order to check the consistency of this result the correlation coefficients were calculated for the first and second halves of the time series. These were 0.32 and 0.41 respectively.
403 days and corresponds to the changes in cloud cover preceding the changes in GCR.
1 2 3 4 5 6 7 8 9 10 11 12 13 14 15 16 17 18 19 20 21 22 23 24
3.2 Short term changes in cloud cover and cosmic radiation
The short-term(periods between 6 hours and 3 months) data is that recorded at 3 hourly intervals over 22 years, with a band-stop filter applied to reduce daily
variations and with an anti-alias filter applied. In addition this data was also subjected to a high-pass filter at 4 cycles per annum as described in Methods. Basic statistics on the high pass filtered cosmic and cloud derived parameters are given in Table 1.
term(1-3 days) correlation. This is particularly obvious as a negative correlation for the All cloud parameter.
1 2 3 4 5 6 7 8 9 10 11 12 13 14 15 16 17 18 19 20 21 22 23 24 25
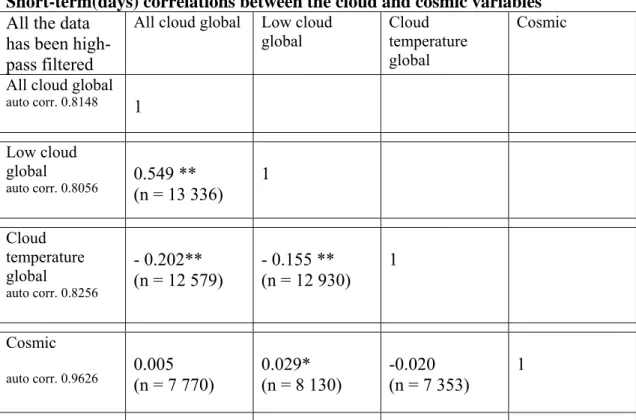
In order to identify any similarity between the high-pass filtered GCR and cloud data correlation coefficients were calculated and are shown in Table 3. The correlation between pairs of the three cloud parameters show very significant correlations (p<0.01). However, only the low cloud changes show a significant correlation (0.029) with the changes in cosmic radiation (p=0.04). In order to check the consistency of this result the correlation coefficients were calculated separately for the first and second halves of the time series. These were 0.031 and 0.027 respectively. The possibility of a difference between the correlations for the northern and southern hemispheres with cosmic radiation was also considered. The correlations between low cloud and GCR for the northern and southern hemispheres respectively gave
coefficients of 0.035 and 0.010.
The cross correlation function of the low cloud data used in Table 3 is shown in Figure 3. The positive peak is not very clear even though the zero delay coefficient is statistically significant. The curve shows a lag correlation with the maximum at a time delay of about 2 days, with the changes in GCR occurring before the cloud changes. The zero delay correlation of the lower curve could arise if approximately 3% of the variations in low cloud cover were the result of GCR.
3.3 Geomagnetic and Cosmic radiation variations
1 2 3 4 5 6 7 8 9 10 11 12 13 14 15 16 17 18 19 20 21 22 23 24 25
4. Discussion
The first question posed in the Introduction asked if there was evidence of a short- term(days) common or external influence on fractional global cloud cover. This question was addressed by comparing the changes in cloud cover over the northern and southern hemispheres. Statistically significant positive correlations were observed in both low cloud and cloud temperature but total cloud cover gave a significant negative correlation. Inspection of the cross correlation function (Figure 2) shows why this negative correlation arises. In addition to a very short-term positive
correlation in both low and all cloud fractions, there is also a negative correlation over a period of a few days in the fraction of both low and total cloud. One possible
explanation for this is the migration of large weather patterns across the equator perhaps linked to the Intertropical Convergence Zone. Such a migration might give transient opposing changes in the two hemispheres and so appear as a negative correlation. However, there are relatively few major weather patterns that cross the equator so this is an unlikely explanation for the negative correlations over a few days. An alternative explanation is seasonal cycles that would be in anti-phase between the two hemispheres. This cannot be excluded as a possibility although the negative correlation shown in Figure 2(b) only last for a few days which is a short period for seasonal changes to occur. Caution should also be exercised when interpreting the relative changes in low and total cloud cover in the light of the paper by
Usoskin(2006) which was discussed in the Introduction.
influence over both hemispheres over this time scale. The results can be interpreted as showing that approximately 4% of the short term variations in low cloud cover and 3% of the variations in total cloud cover are the result of an extra-terrestrial or global influence.
1 2 3 4 5 6 7 8 9 10 11 12 13 14 15 16 17 18 19 20 21 22 23 24
The second question posed asked if there was evidence that short-term changes in GCR are associated with similar global changes in cloud cover. Table 3 presents the relevant correlation coefficients. There was no significant correlation between GCR and total cloud cover but there was a significant positive correlation (p<0.05) between the global changes in low cloud cover and GCR. The associated cross-correlation function (Figure 3) shows that this positive correlation occurs over several days with the maximum correlation consistent with the GCR changes
preceding the low cloud changes by about two days. The cross correlation function can be interpreted as showing that approximately 3% of the variations in global low cloud cover could be the result of changes in cosmic radiation.
Interpretation of correlations is not easy. No conclusions concerning causality can be reached. However, the answers given to the two main questions do appear to be fairly robust. When the data for the period 1983 to 2005 was split into two halves very similar correlations were found for the correlation coefficients between the low cloud and GCR time series. Care was taken to exclude artefacts from the filtering and from edges of the data. Care was also taken to reduce noise on the data and to exclude spurious correlations resulting from daily and annual changes.
1 2 3 4 5 6 7 8 9 10 11 12 13 14 15 16 17 18 19 20 21 22 23 24
The unfiltered long term data does not show any correlations with cosmic radiation that reach a 5% significance level. However, the correlation between global low cloud and GCR (Table 2) is significant at the 6% level. Svenmark and Friis-Christensen(1997) and Marsh and Svensmark(2000) used data excluding the tropics and over land mass, whereas our data were for the whole globe. The fact that the cross-correlation function between global total cloud and GCR shows a maximum corresponding to the changes in cloud preceding the cosmic changes by 403 days is not consistent with a long term causal relationship. However, it is worth noting that peaks in the 11-year cycle of total solar irradiance(TSI) occur 1-2 years before the minima in GCR so that TSI could give a better zero-lag correlation.
The long term records of cloud and GCR shown in Figure 1 appear to show a reduction of 2-3% in the fraction of global low cloud over the period 1983 to 2005. Assessing the significance of this in the context of global temperature changes is not easy as clouds have both negative and positive effects on the global thermal balance. 1
2 3 4 5 6 7 8 9 10 11 12 13 14 15 16 17 18 19 20 21 22 23 24 25
It would appear that there is a significant correlation between the short term changes in low cloud and GCR. Possible mechanisms for this have been discussed by many researchers. The first to be raised was that of the Wilson cloud chamber (Wilson, 1912) which clearly links high energy cosmic radiation with droplet formation.
However, it has been pointed outby Harrison and Aplin (2001) that the Wilson cloud chamber operates with air in a very highly supersaturated condition which is probably not found in the atmosphere. Wilson used a piston to produce an adiabatic expansion of water vapour saturated air at room temperature to produce a supersaturated medium. He used expansions of the order of 30% before particle tracks could be seen.
about 6 hours to several days are consistent with the mechanisms proposed by
Carslaw et al (2002). There is certainly neither, agreement on the ways in which GCR might affect cloud formation nor, on the significance of this to global cloud cover. Kirkby
1 2 3 4 5 6 7 8 9 10 11 12 13 14 15 16 17
(1998) at CERN has proposed the CLOUD project in order to investigate water droplet formation inside a large cloud chamber simulating a range of atmospheric conditions. The CLOUD project is still in progress.
1 2 3 4 5 6
Acknowledgement
References
12 3 4 5 6 7 8 9 10 11 12 13 14 15 16 17 18 19 20 21 22 23 24
25
Atmospheric Science Data Center, 2007
http://eosweb.larc.nasa.gov/HORDERBIN/HTML_Start.cgi.
Bartlett, M.S. 1935 Some aspects of the time correlation problem in regard to tests of significance, J. Roy. Statist. Soc. 98, 536-543.
British Atmospheric Data Centre, 2007, http://badc.nerc.ac.uk/cgi-bin/_browser/data_browser/badc/isccp_d1/data.
British Geological Survey, 2007, http://www.geomag.bgs.ac.uk/gifs/apindex.html.
Carslaw, K.S. Harrison, R.G. and Kirkby, J. 2002, Cosmic Rays, Clouds and Climate, Science, 298, 1732-1737 (doi:10.1126/science.1076964).
Dawdy, D.R. and Matalas, N.C. 1964, Statistical and probability analysis of
hydrological data, part III: Analysis of variance, covariance and time series, in Ven Te Chow, ed., Handbook of Applied Hydrology, a Compendium of Water-resources
Technology: New York, McGraw-Hill Book Company, p. 8.68-8.90.
Gierens, K. and Ponater, M. 1999, Comment on ‘Variation of cosmic ray flux and global cloud coverage – a missing link in solar-climate relationships’ by H Svensmark and E Friis-Christensen(1997), Jn.of Atmospheric and Solar-Terrestrial Physics, 61,
Haigh, J.D. 1996, The impact of solar variability on climate, Science272 (5264), 981.
1
2
3 4 5 6 7 8 9 10 11 12 13 14 15 16 17 18 19 20 21 22
Harrison, R.G. and Stephenson, D.B. 2006, Empirical evidence for a non-linear effect of galactic cosmic rays on clouds, Proc. R. Soc.:Math., Phys. & Engineer. Sci.462,
2068, 1221-1233.
Harrison, R.G. and Aplin, K.L. 2001, Atmospheric condensation nuclei formation and high-energy radiation, Jn. Atmospheric and Solar-Terrestrial Physics, 63,
1811-1819.
ISCCP, 2007, http://isccp.giss.nasa.gov.
Kirkby, J. 1998, Beam Measurements of a CLOUD (Cosmic Leaving Outdoor Droplets), CERN-OPEN-2001-028.
Kristjansson, J.E., Staple A., Kristiansen J., 2002, A new look at possible connections between solar activity , clouds and climate. Geophysical Research Letters, 29 (23),
2107.
Marsh, N.D., Svensmark, H., 2003, Galactic cosmic ray and El Niño—Southern Oscillation trends in ISCCP-D2 low cloud properties: Journal of Geophysical Research, 108, NO. D6, 4195:doi: 10.1029/2001JD001264.
1 2 3 4 5 6 7 8 9 10 11 12 13 14 15 16 17 18 19 20 21 22 23
Meko, D. 2005, Applied time series analysis: 9, Correlation, http://www.ltrr.arizona.edu/~dmeko/geos585a.html .
Mitchell, J.M. Jr., Dzerdzeevskii, B. Flohn, H. Hofmeyr, W.L. Lamb, H.H. Rao, K.N. and Wallen, C.C. 1966, Climatic change: Technical Note No. 79, report of a working group of the Commission for Climatology; WMO No. 195 TP 100: Geneva,
Switzerland, World Meteorological Organisation, 81p.
Moscow neutron monitor, 2006, http://cr0.izmiran.rssi.ru/mosc/main.htm.
Ney, E.R. 1959, Cosmic radiation and the weather, Nature183, 451-2.
Orcutt, G.H. and James, S.F. 1948, Testing the significance of correlation between time series, Biometrika, 35, 397-413.
Svensmark, H. and Friis-Christensen, E. 1997, Variation of cosmic ray flux and global
Tinsley, B.A., 1996, Correlations of atmospheric dynamics with solar-wind induced changes of air-earth current density into cloud tops, Journal of Geophysical Research ,
101, 29701.
1 2 3 4 5 6 7 8 9 10 11
Usoskin, I.G., Voiculescu, M., Kovaltsov, G.A., and Mursala, K., 2006, Correlations between clouds at different altitudes and solar activity: Fact or Artifact?, Journal of Attmospheric and Solar-Terrestrial Physics, 68, 2164-2172.
Wilson, C.T.R. 1912, On an Expansion Apparatus for Making Visible the Tracks of Ionising Particles in Gases and Some Results Obtained by its Use, Proc Roy Soc A,
Basic statistics on the cloud and cosmic parameters
Derived parameter Description Mean Standard deviation
Coeff. of variation (%) All cloud north Total cloud cover fraction in
the northern hemisphere
0.629 0.031 4.9
All cloud south Total cloud cover fraction in
the southern hemisphere 0.683 0.034 5.0 Low cloud north Low cloud cover fraction over
the pressure range 680 – 1000mb – north.
0.085 0.018 21.6
Low cloud south Low cloud cover fraction over the pressure range 680 – 1000mb – south
0.139 0.025 18.1
Cloud temperature north K Cloud top temp. – north K 158.9 3.9 2.5 Cloud temperature south K Cloud top temp. – south K 148.7 3.7 2.5 All cloud global Total cloud cover fraction 0.656 0.022 3.4 Low cloud global Low cloud cover fraction 0.112 0.016 14.4 Cloud temperature global K Low cloud temperature K 153.8 3.1 2.0 Cosmic radiation Counts min-1 recorded at the
Moscow neutron counter 8697.3 512.2 5.9
All cloud north_HP High-pass filtered version of
the above variables 0 0.023 3.6
All cloud south_HP “ 0 0.023 3.3
Low cloud north_HP “ 0 0.013 15.8
Low cloud south_HP “ 0 0.016 11.6
Cloud temperature north_HP
“ 0 2.5 1.6
Cloud temperature southHP
“ 0 2.3 1.5
All cloud global_HP “ 0 0.015 2.4
Low cloud global_HP “ 0 0.011 9.5
Cloud temperature global_HP
“ 0 1.8 1.1
Cosmic radiation_HP “ 0 127.2 1.5
Long-term(years) correlations between the cloud and cosmic variables
All cloud global Low cloud global
Cloud temperature global
Cosmic
All cloud global
auto corr. 0.9999 1
Low cloud global
auto corr. 0.9983 0.484 ** (n = 56) 1
Cloud temperature global auto corr. 1.000
0.012 (n = 3.2)
- 0.315 * (n = 55)
1
Cosmic
auto corr. 1.000 0.061 (n = 3.2) 0.252 (n = 55) -0.170 (n < 1) 1
Short-term(days) correlations between the cloud and cosmic variables
All the data has been high-pass filtered
All cloud global Low cloud global
Cloud temperature global
Cosmic
All cloud global
auto corr. 0.8148 1
Low cloud global
auto corr. 0.8056 0.549 ** (n = 13 336) 1
Cloud temperature global
auto corr. 0.8256
- 0.202** (n = 12 579)
- 0.155 ** (n = 12 930)
1
Cosmic
auto corr. 0.9626 0.005 (n = 7 770) 0.029* (n = 8 130) -0.020 (n = 7 353) 1
Legends
Figures
Figure 1 Long-term(years) cloud and galactic cosmic radiation(GCR) data.
(a) Low cloud global. (b) GCR. (c) Cross correlation function of (a) and (b). The zero delay gives a correlation coefficient of 0.252. This has an associated number of degrees of freedom of 55 and does not reach a 5% level of significance. The
maximum correlation has a value of 0.304 and is reached with a time shift of 403 days.
Figure 2 Short-term cloud data. (a) The upper trace is of the unfiltered 3-hourly
record of low cloud cover over the northern hemisphere. The lower trace is the same data but after filtering. See section 2.1 for a description of the filters applied. (b) The
cross-correlation functions are shown between the northern and southern hemisphere cloud data. The lower curve appears to show a negative correlation over a period of a few days but a positive correlation for more rapid changes. Indeed all three curves show some evidence for both changes.
Figure 3 Short-term cloud and cosmic radiation changes. This shows the
cross correlation function between Low cloud_HP and Cosmic radiation_HP.
Tables
Table 1 Basic statistics on the cloud and cosmic parameters. The coefficient of
variation is the standard deviation expressed as a percentage of the mean value of the parameter. In every case the variables were vectors of 64 288 points at intervals of 3 hours.
Table 2. Long-term correlations between the cloud and cosmic variables. A
correlation coefficient matrix for the three global cloud parameters and the cosmic radiation parameter. In every case the first coefficient of the auto correlation function is given in the first column and n, the associated number of degrees of freedom, in the subsequent columns. The correlation coefficients that reach statistical significance are marked with a single asterisk if the 5% level is reached and with two asterisks if the 1% level is reached.
Table 3. Short-term correlations between the cloud and cosmic variables. A
83 85 87 89 91 93 95 97 99 01 03 05 6000
6500 7000 7500 8000 8500 9000
Year
N
eut
ron c
ounts
-22 -18 -14 -10 -6 -2 0 2 6 10 14 18 22 -0.3
-0.2 -0.1 0 0.1 0.2 0.3 0.4
Years shift
X C
or
re
la
tion f
unc
tion
83 85 87 89 91 93 95 97 99 01 03 05 0.06
0.08 0.1 0.12 0.14 0.16
Year
L
ow c
loud f
ra
ct
ion
(a)
(b)
Low cloud fraction v Cosmic counts
0.15
-5 -4 -3 -2 -1 0 1 2 3 4 5
-0.1 -0.08 -0.06 -0.04 -0.02 0 0.02 0.04 0.06
Time delay (days)
cloud temp.
all cloud low cloud
C
ro
ss co
rr
el
at
io
n
0 1 2 3 4 5 6 7 8 9 10
-0.05 0 0.05 0.1
Days
L
ow c
loud
nor
th
unfiltered record
filtered record