An Application to Two Countries
Anne Elizabeth Hawke
A thesis submitted for the degree of Doctor of Philosophy of the Australian National University
Apart from the assistance indicated in the acknowledgments, this thesis is my own original work.
I would like to thank my supervisor Professor Bob Gregory for his helpful advice, encouragement and useful comments. The assistance of my other supervisors Raja Junankar and Trevor Breusch is also valued. Also, the practical advice and encouragement provided by Anne Daly and Bruce Chapman is appreciated. I wish to acknowledge my fellow PhD students for comments made at seminars at the Economics PhD Seminar Series, ANU.
This thesis investigates the extent of the wage differentials between females working full- and part-time in Australia and the United States, the causes of these differentials and the effect these differentials have on the aggregate ratio of female to male wages in both countries.
The thesis contributes to existing knowledge in three ways. Firstly, it documents the magnitude and sign of the male/female wage ratio and the full/part-time wage ratio for countries which include Australia and the United States. For both Australia and the United States, the average male wage per hour was estimated to exceed the average female wage per hour. For the United States, consistent with evidence from other international evidence, wages of full-time workers were estimated to exceed those of part-time workers. However, for Australia, part-time hourly wages were estimated to exceed full-time hourly wages by around 20 percent.
inducing ’better' quality workers into the part-time labour market. Unexplained differences (such as discrimination and productivity differences) were also found to be important in explaining the wage differential between females working full- and part-time in the United States, but not in Australia. This finding lead us to examine the role of occupations and institutions in explaining the full- and part-time wage differential.
Chapter Page
1. Introduction
1.1 Introduction 1
1.2 Structure of the thesis 11
2. Evidence and explanations of full- and part-time work and wages
2.1 Introduction 12
2.2 Empirical Findings 12
2.3. The wage differntial between full- and part-time workers 15
2.4 Why do wages differ between individuals ? 17
2.4.1 The human capital model 18
2.4.2 Criticisms of the human capital model 22
2.4.3 Segmented labour market theory 26
2.4.4 Efficiency wage models 28
2.5 Differences in occupations : an overview 31
2.5.1 Choice of jobs which offer less pay 32
2.5.2 Direct discrimination preventing groups from working
in high pay jobs 34
2.5.3 Underpayment as a result of over representation 37 2.6 The role of institutional factors in Australia and the
United States 38
2.7 Conclusions 44
3. Overview of part-time work in Australia
3.1 Introduction 46
3.2 What does part-time mean ? 47
3.3 Demographic characteristics of part-time workers in
Australia 50
3.7 Part-time work and unemployment 67
3.8 Cross-section data 70
4. Employment status in Australia and the United States
4.1 Introduction 73
4.2 Trends in full- and part-time work 74
4.3 Modelling employment status 81
4.3.1 A dischotomous outcome : full- or part-time work 82 4.3.2 Employment status equation results for a
dichotomous choice model 84
4.3.3 A trichotomous outcome : full- and part-time work
and not working 88
4.3.4 Employment status equation results for a
trichotomous choice model 90
4.4 Conclusions 95
5. Relative returns to full- and part-time work
5.1 Introduction 98
5.2 Full- and part-time wages of females in Australia and the
United States 98
5.3 Alternative specification for a full- and part-time model 101 5.4 Results
5.4.1 Wage equations for full- and part-time workers in a
dichotomous model 104
5.4.2 Wage equations for a trichotomous choice model 110 5.4.3 Estimation of wage equations for full- and part-time
workers with a trichotomous selection term 113 5.5 Decomposition of the wage differential between females 115 5.6 Estimation of the full- and part-time wage differentials for
females 119
6.1 Introduction 126 6.2 Occupational representation of females, by labour force status 128 6.3 Explaining factors which affect the wages of part-time worker 132
6.4 Effect of occupational attainment on wages 139
6.5 Decomposing the full- and part-time wage differential: inter- and
intra-occupational effects 144
6.6 Conclusions 147
7. Part-time work effects on the gender wage differential
7.1 Introduction 149
7.2 Background to the gender wage differential 149
7.3 Methodology 150
7.4 Wage equation results for males 156
7.5 Results from the decomposition of the gender wage
differential 164
7.6 Conclusions 172
8. Conclusions
8.1 Overview 175
BIBLIOGRAPHY 178
APPENDICES
A : Definitions of variables used in regression equations for
Australia 195
B : Definitions of variables used in regression equations for
D : Sample means for regressors
D1 : Sample means, dichotomous emloyment status model, Australia
and the United States, 1986/87 202
D2: Sample manes for trichotomous wage equations, Australia
and the United States, 1986/87 203
E : Estimates of Australian full- and part-time wage equations
under an alternative estimate for experience 204
F : Estimates of United States full- and part-time wage
equations using an alternative estimate for experience 205
G : Appendix to Chapter 6 :
G6.1 Extension of model to include industry effects 206
G6.2 Why are industries important to wages ? 208
G6.3 Regression results of female wage equations, by
occupation and employment status, Australia 211
G6.4 Regression results of female wage equations, by
occupation and employment status, United States 219
H: Appendix to Chapter 7
H7.1 Maximum likelihood estimates, Male Employment
Equation, Australia 227
H7.2 Maximum likelihood estimates, Male Employment
Table Page 1.1 Size and composition of part-time employment, 1979-90 4 1.2 Australian and United States' employment growth, by
sex, 1981-89 5
1.3 Actual hours worked per employee, by full- and part-time
status, by sex, 1980-88 7
1.4 Female wage ratios, by occupation, Australia and the United
States, 1968/87 9
1.5 Ratio of part- to full-time hourly earnings 10
2.1 Recent Australian estimates of the full-time gender wage
differential 13
2.2 International estimates of the full-time gender wage
differential 14
2.3 Estimates of the wage differential between full- and
part-time workers 16
2.4 Equal pay and equal employment opportunities policies,
Australia and the United States 41
3.1 Casual loadings in a sample of Australian awards 49 3.2 Age profile of full- and part-time workers, Australia, 1980 52 3.3 Family status of females working full- and part-time,
Australia, June 1986 53
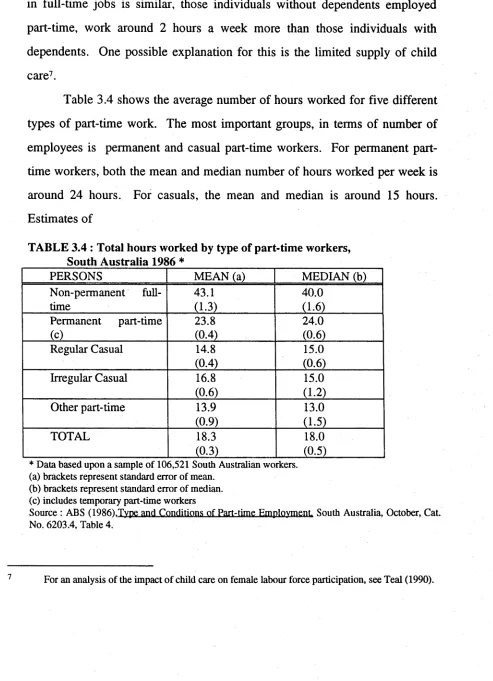
3.4 Total hours worked by type of part-time worker, South
Australia, 1986 54
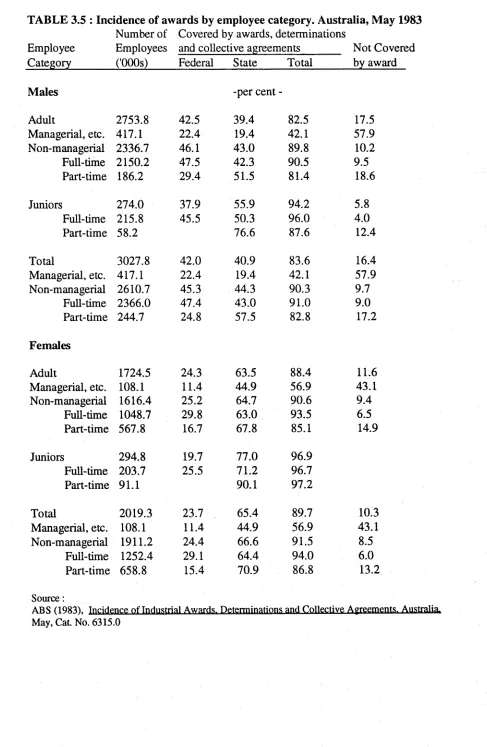
3.5 Incidence of awards by employee category, Australia,
May 1983 57
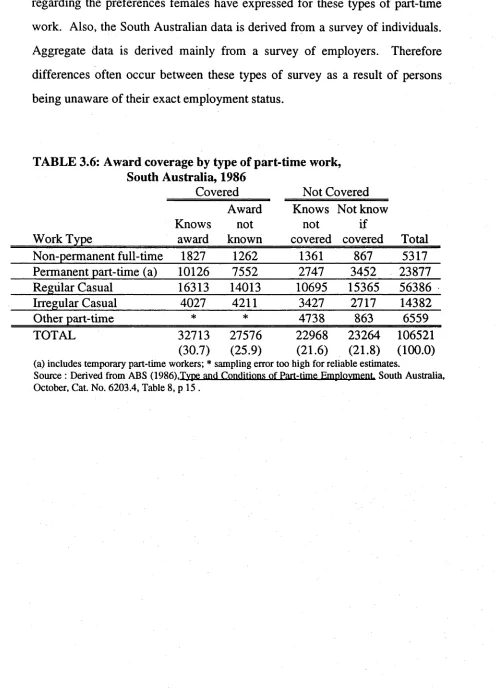
3.6 Award coverage by type of part-time worker, South
Australia, 1986 58
3.7 Type of part-time work, by age and sex, South
Australia, 1986 59
3.8 Preferences of females for casual or permanent work, by
usual hours worked per week, Australia, 1982 60 3.9 Female employees receiving fringe benefits by hours of
full-United States, 1968/87 71 4.1 Cyclical fluctuations in part-time employment, by sex,
Australia and the United States 77
4.2 Cyclical fluctuations in involuntary part-time employment,
by sex, Australia and the United States 79
4.3 Dichotomous employment status equation of females,
Australia and the United States, 1986/87 85
4.4 Employment probability of females working full- or part-time,
Australia and the United States 86
4.5 Maximum likelihood estimates of trichotomous employment
status equation of females, Australia 91
4.6 Changes in the cumulative densities of trichotomous employment
status equation, Australia 92
4.7 Maximum likelihood estimates of trichotomous employment
status equation of females, United States 94
4.8 Changes in the cumulative densities of trichotomous employment
status equation, United States 95
5.1 Wage equations, by sex, Australia and the United States,
1986/87 100
5.2 Full- and part-time wage equations, with and without
dichotomous choice selection, females, Australia 105 5.3 Full- and part-time wage equations, with and without
dichotomous choice selection, females, United States 106 5.4 Full- and part-time wage equations, with trichotomous choice
selection, females, Australia 116
5.5 Full- and part-time wage equations, with trichotomous choice
selection, females, United States 117
5.6 Summary of decomposition of the female wage differential between full- and part-time workers, Australia and the
United States 120
6.1 Predicted wage changes under various scenarios, Australia and
the United States 138
6.2 Occupational choice model, Australian females 141 6.3 Occupational choice model, United States females 142 6.4 Actual and predicted occupational distributions, Australia
7.1 Male wage equations, Australia 157
7.2 Male wage equations, United States 158
7.3 Gender wage differential summary table, Australia and
the United States 169
G6.1 Full- and part-time wage equations, including industry
effects, Australian females 209
G6.2 Full- and part-time wage equations, including industry effects,
United States females 210
G6.3 Regression results of female wage equations, by
occupation and employment status, Australia 211 G6.4 Regression results of female wage equations, by
occupation and employment status, United States 219 H7.1 Maximum likelihood estimates, Male Employment
Equation, Australia 227
H7.2 Maximum likelihood estimates, Male Employment
Equation, United States 228
LIST OF FIGURES
Figure Page
1.1 Female part-time employment trends; 1967-1991 2 4.1 Australian part-time employment trends, by sex, 1978-91 75 4.2 United States part-time employment trends, by
sex, 1968-1987 76
4.3 Female part-time employment trends; 1967-1991 80 6.1 Australian female occupaitonal distribution, by labour
force status 129
6.2 United States female occupaitonal distribution, by
labour force status 130
6.3 Australian female industrial distribution, by labour
force status 131
6.4 United States female industrial distribution, by labour
CHAPTER ONE
INTRODUCTION
1.1 Introduction
This thesis investigates the extent of the wage differentials between females working full- and part-time in Australia and the United States, the causes of these differentials and the effect these differentials have on the aggregate ratio of female to male wages in both countries. The issues involved may be identified by six stylised observations.
First, part-time work represents one of the fastest growing (and perhaps most significant) segments of the Australian labour market. Between 1966 and 1991, full- time employment of women, adjusted for the growth of the population, increased 3.7 per cent but part-time employment increased 143.0 per cent1. Part- time jobs have increased from one job in four to two jobs in five with the trend continuing upwards. The United States experience has been quite different. Part-time employment for females has grown quickly, but not at a significantly faster rate than full time employment. In the United States, women employed part-time represent around one in four of all employed women. Figure 1 provides a useful basis for comparison of the respective growth of part-time jobs in both countries for females between the years 1967 and 1991.2 It is interesting to note that the trends of both countries began to diverge in the 1973-1975 period when equal pay for equal work of equal value was introduced in Australia. After these changes, Australian part-time employment started to increase quickly.
i
2
Derived from Australian Bureau of Statistics (ABS) (various issues), Labour Force Survey. Cat. No. 6203.0
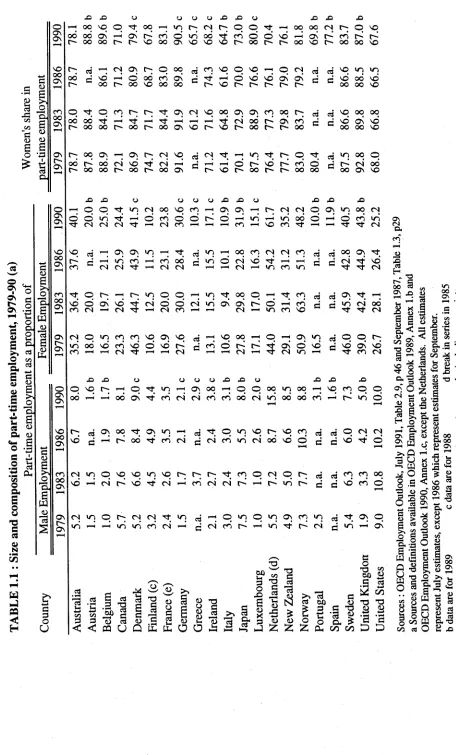
Second, although the majority of part-time employment in both countries is undertaken by females (see column 9, Table 1.1), male part-time employment growth in Australia, has been significantly higher than male full-time employment growth for most of the last decade (with 1988 being a unique exception, see Table 1.2). For the United States, there is no obvious trend, in some years full-time employment grows fastest, in other years, it is part-time employment which has the fastest growth. Nevertheless, for both Australia and the United States, part-time work is dominated by females.
Figure 1. 1. Female part-time employment trends; 1967-1991
- * Aust
r ^ C O O T O r C S J D T l O L O N C O C n O T C M C O T L n U D N C O m O r -C D -C O -C D N S N N N N N N N N O D -C D -C O -C O O D -C O -C O -C O -C O -C O T O T
Sources:
For the United States, U.S. Department of Labor, Bureau of Labor Statistics (1988), Labor Force Statistics Derived from the Current Population Survey. 1948-1987. August, Table B-19; and Employment and Earnings (various issues). For Australia, DX database series derived from the Australian Bureau of Statistics (various issues), Labour Force. Catalogue No. 6301.0.
a. For the United States, represents females working in non-agricultural industries aged 20 years or more. For Australia, represents females working in any industry (except defence or diplomatic appointments) aged 15 years or over. Part-time is defined as those individuals who usually work less than 35 hours per week, and who did so during the survey week. The graph represents the proportion of working females who undertaken part-time work.
jobs, but at this stage there is no equivalent Australian analysis. Among the distinguishing features of these less desirable jobs is that in comparison with other jobs, they have lower rates of remuneration, are less likely to have fringe benefits and may not provide for career progression. However, for both Australia and the United States, part-time work also provides flexibility in the timing and number of hours worked, additional income, and an important mechanism for individuals to continue their labour force attachment whilst pursuing other activities (such as family responsibilities and education). Table 1.3 provides evidence on the relative changes in the average hours of work per employee by sex for Australia and the United States. The hours worked per week by female part-time workers in Australia and the United States has remained relatively stable in the 1980’s. However, the average number of hours worked for female part-time workers is lower by around 3 hours per week in Australia compared to the United States. For men, the average number of hours worked per week on a part-time basis has fallen through the decade in Australia, whilst for the United States the respective figure has increased. As for females, males work a higher number of hours per week in part-time work in the United States than Australia, although the difference is smaller.
Fourth, for both Australia and the United States over the last two decades there has been a relatively consistent ratio between female full- and part-time hourly wages within each country, although over time the ratio of female pay has varied relative to that of males. For Australian females in 1986, the ratio of part- to full-time hourly wages is 0.8. A comparable estimate for the United States is 1.33.
T A B L E 1.1 : S iz e a n d c o m p o si ti o n o f p a r t-ti m e e m p lo y m e n t, 1 9 7 9 -9 0 (a ) ___________________ P a r t-ti m e e m p lo y m e n t a s a p r o p o r ti o n o f ____________________ W o m e n 's s h a r e i n C o u n tr y M a le E m p lo y m e n t_______________ F e m a le E m p lo y m e n t _________ = = p a r t-ti m e e m p lo y m e n t 1 9 7 9 1 9 8 3 1 9 8 6 1 9 9 0 1 9 7 9 1 9 8 3 1 9 8 6 1 9 9 0 1 9 7 9 1 9 8 3 1 9 8 6 1
r~- jw —< cn os r-» o
oo 3 no - d od cd
r - x h oo vo oo
O P O CO t ; P_
OO OG P —' P —' P r - oo oo r - oo r - oo
ON NO NO NO C~~ OO {"■•
oo ^ co vo o no —«
On ß d Ö d d
oo t-" no r-" r - t-~
On CN no oo On OncO
h h h T t c i od 6
on no r - no r - oo r-»
oo o oo oo
q <n d d q q q On On d d NO OO NO r-~ r-- oo oo no
q q d d q oo oo ON CO d d NO On NO t"- oo ^ oo oo no
p oo on p on p cn no d ^ 7 ^ t ^ P 7 d q q oo r - o d o i d d cm —’ - ' d d d d d d d d c 6 c i oo r ^ - o o o o r ' O o c ^ - o o o N r ^ N o r - o o r ^ r - ' o e o c ^ oo on no
Ü £ £ X X
p p P U-N CN d d d d o
P CN CM CN P —I (N CO oo q co cd d o
'—^ On on ■—; p cn cn o on in oo cm
d o d d d i r i o d d d o d d
— ^ v o c c ^ - H - i ^ N t c N
q d m
q q q p p . d q p °® q q q q d d - i d oo d ^ ^ ° i d P —i CN CN P CN CN T| CO ITi
d d oq q p d d ^ P qP P CN
p O c-- —' r-- »n o o —> i n p oo o p cn d d ^ P N d ö o N N O p c N Ö ö c N c n O N O N r ^ ö —< c d c e *d cn oo CO CN CN P CN CO
CN p CO CO CO NO ON NO
d o o N o d d d d h
CO —I — CN p '—' ■—1 <N
CO) CO NO
d p q oo —« p p on i n c d o d d d d d d
‘- ^ ^ c N ^ P C N i f l r J
x x o o o o x x o x
0 ' 0 > ^ p t l C l H O V O O H p p l » I C O O H
OO '—‘ '—< OO ON P CO CN CN CO CO OO CN i d oo oo cd
P P CN
d q q p d NO ON NO
P CO CN
X X
NO CO p P —• d i d Ö
r - d q OO p q q p d P p q q t p q CO d d p CN CN NO d oo p cd CN d CN cd i d CN OO NO d
!■ H d d NO P d
CN q p q NO q q P p p P CO p CN p p d d CO CO oo NO > 1 ^ CN NO p CN cd CN CN i d d d NO cd d
CN q p t ; CN CN P q d p q p q q CO q d P q p i d cn cn cd CN —1 d CN cd *d p CN d i d ON
ON CN Q. cd ü X a H oo cn U. 3 s a Q. OJ oo I<U < ON OO
| 5 1
$ 3 "= o. s -S
q o g
CN
lO 00 Os
_c
s '5 c -c
S <u
OJ C/3
a, c <o P ” 3 «o Si
<5 -o cd w D. •c s o o 00 _c ‘■3
a « 3
ü X c/3 g Z u
>> Q. £
5 I I x a>
cu b oo „ a, oo
q oj on
[image:16.553.71.527.49.804.2]_ g | s i O | s s
| - B < S g
2 1 2 s. t
i ' f * 3
— . Q . ON £
2 e3
> » Q
3 U
TABLE 1.2 : Australian and United States' Employment growth, by sex, 1981-1989
1981-83 1983-85 1986 1987 1988 1989
A u s tr a lia
Total
Full-time -1.5 2.6 3.1 0.8 3.6 3.3
Part-time 1.9 5.0 8.5 8.2 4.1 8.7
Men
Full-time -2.0 2.2 2.2 0.6 3.0 2.8
Part-time 4.3 2.5 10.5 12.8 -3.5 15.5
Women
Full-time -0.2 3.7 5.3 1.2 5.2 4.3
Part-time
U n ite d S ta te s
1.3 5.8 8.0 6.9 6.3 7.0
Total
Full-time -0.6 3.7 2.2 2.7 2.4 2.2
Part-time 3.9 0.3 2.4 2.2 1.4 1.1
Men
Full-time -1.2 3.1 1.5 1.9 1.9 1.9
Part-time 5.8 -0.9 3.0 2.5 1.5 -0.4
Women
Full-time 0.5 4.6 3.4 3.8 3.2 2.8
Part-time 3.0 0.9 2.2 2.0 1.3 1.8
[image:17.553.44.531.85.802.2]Fifth, although the ratio of female part- to full-time hourly wages have been constant over time, female wages relative to males has changed significantly over this period in Australia. The returns Australian females receive for part-time work is approximately 0.9 of the full-time male wage. For the United States, the comparable statistic is 0.6. This difference is very marked. For Australia, in 1989 the ratio of female to male wages is approximately 0.8. For the United States, for the same year the ratio is approximately 0.64.
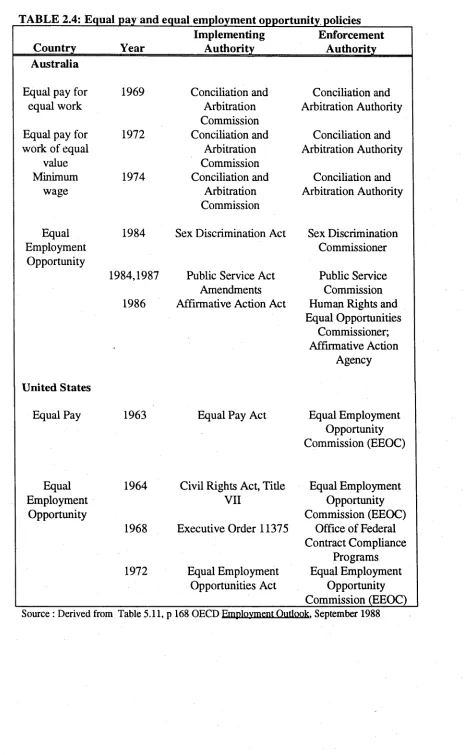
Sixth, in the Australian industrial relations system and the United States legislative system mechanisms have been implemented to ensure that there is no difference in the rates of pay between groups doing identical jobs. Thus, where differences in the average wage between males and females do occur, this difference may reflect either non-compliance with the industrial law or differences in the representation of groups into occupations and industries.
For both countries, female part-time representation by industry and occupation is generally more concentrated than full-time workers, with the service sector being a significant employer of part-time workers in both countries. More interesting, however, is the other types of part-time work undertaken in both countries. Compared to their United States counterparts females working part-time in Australia are more strongly represented in the semi-professional and professional groups5.
Derived from Table 31, Current Population Reports. Consumer Income. Series P-60. Number 172, for all males and females mean incomes.
TABLE 1.3: Actual hours worked per employee, by full-and part-time employment and sex, 1980-88
Australia United States
1980 1983 1988 1979 1983 1988
All employed
Total 38.4 37.8 38.0 38.9 38.3 39.4
Full-time 42.7 42.4 43.5 43.1 43.0 43.8
Part-time 16.4 16.4 16.4 19.0 19.1 19.8
Men
Total 42.3 41.7 42.8 42.0 41.2 42.4
Full-time 43.7 43.3 44.8 44.6 44.4 45.3
Part-time 17.3 17.5 16.0 18.6 18.6 19.4
Women
Total 31.5 31.3 30.9 34.5 34.5 35.7
Full-time 40.0 40.1 40.4 40.3 40.6 41.4
Part-time 16.2 16.1 16.5 19.2 19.4 19.9
Source : OECD Employment Outlook. July 1990, Table 1.6, p26-27
This thesis analyses the determinants of all these stylised
observations, b u t focuses upon four particular issues. Firstly, w hy is it that
Australian females working part-time are paid around 20 per cent more per hour than their full-time counterparts, and females working part-time in the United States are paid over 20 per cent less per hour than females working full-time? The magnitude of these numbers are not trivial. For example, for a typical Australian female working part-time in 1992, if her pay ratio is equal to the United States, she would earn $47.726 per week less - that is 20 per cent. Furthermore, because United States females are badly paid relative to females in Australia, she will be paid a further $256.157 per
Based upon the average weekly total earnings of Adult females, from ABS (1992), Distribution and Composition of Employee Earnings and Hours. Australia, May, Catalogue No. 6306.0, Table 22.
[image:19.553.68.497.92.342.2]week less relative to the average Australian male wage of $581.90. It might be expected that differences of this magnitude will affect a whole range of social and economic responses including family income distribution, time devoted to raising children, marital status and poverty. For example, if the relative wage between full- and part-time work is higher in Australian than the United States, we may expect to observe a higher proportion of females working part-time.
Secondly, from the observed relative returns to working full- or part- time in both countries, the role of human capital and other factors including institutional differences in explaining these differences is estimated. The human capital model explains earnings in terms of differences in endowments such as experience, educational qualifications and marital status. Thus, where a wage differential between females working full- and part-time remains after controlling for observable factors, this component is often interpreted as providing some indication of the impact institutional factors exert upon the determination of wages8. It has been conjectured that most of the Australian differential may be explained by institutional factors. Understanding the role of institutions is very important in the current Australian policy debate as both major political parties and trade unions are planning to institute changes to our institutional wage setting practices.
Thirdly, utilising these results, an analysis of the role of occupational and industrial distributions in explaining relative wages both within and between countries is undertaken. Table 1.4 indicates the differences in the relative wages between full- and part-time workers in
different occupational categories for both Australia and the United States9. It is clear from this table that the occupational distribution of workers, will have important implications for the average wages of full- and part-time workers.
TABLE 1.4 : Female wage ratios *, by occupation, 1986/87
Occupation Australia United States
managers and administrators 1.5 0.79
professional 1.22 0.91
para-professionals 1.34 0.85
trades persons 1.57 1.02
clerks 1.35 0.81
sales and personal service workers 1.42 1.04
plant and machine operators 2.05 0.86
labourers and related workers 1.30 0.81
TOTAL 1.31 0.84
* ratio is (In Wpt / In Wft)
Fourthly, the wages of females working full- and part-time are compared to males in order to determine the effect part-time wages have on the wage differences between males and females, and the roles of human capital, sample selection and discrimination in explaining this difference. The United States experience on relativities between full- and part-time workers appear to be more typical of most OECD countries than Australia. Table 1.5 provides some evidence on OECD comparison of the hourly
remuneration of part-time workers relative to full-time workers for both men and women.
It is noteworthy that only in Australia and the Netherlands do females working part-time have higher earnings (on average) than those working full-time. Additionally, Australia is the only country for which the part-time earnings per hour for men exceed full-time earnings.
Table 1.5 : Ratio of part- to full-time hourly earnings*
Country Year Men Women
Belgium 1972 85.0 99.7
France 1972 91.8 92.8
Germany 1972 81.8 95.2
Italy 1972 93.9 96.5
Japan 1977 n.a. 81.4
Luxembourg 1972 80.1 80.5
Netherlands 1972 83.5 119.0
United 1981 n.a. 91.9
Kingdom * manual workers
n.a. represents not available Source:
OECD (1983) Employment Outlook September
The main advantage of undertaking this analysis within a two- country framework has been discussed in the full-time context by Gregory
1.2 Structure of thesis
Following this introduction there are seven chapters. Chapter 2 analyses the competing theories which attempt to explain wages and participation of particular types of workers. Three broad theory groups are discussed : the human capital theory, efficiency wage theory and segmented labour markets theories. Chapter 3 provides a background of the institutional framework and aggregate time series and cross-sectional data of Australia and the United States. Since the primary focus of this thesis is cross-sectional evidence, this chapter attempts to place this evidence within a historical context.
EVIDENCE AND EXPLANATIONS OF
FULL- AND PART-TIME WORK AND WAGES
2.1 Introduction
The purpose of this chapter is to identify some of the international evidence on wage differentials between workers on full- and part-time schedules, and place these findings in the context of competing theories which have traditionally been used to explain average earnings of individuals. The three theories discussed are the human capital, segmented labour market, and efficiency wage theories. An overview of existing explanations relating to occupational segregation and wages is also provided. Although these theories are identified separately, they share many similarities.
2.2 Empirical Findings
In Australia and the United States wage differentials between males and females who work full-time are well documented1. However, most analysis ignores what is an increasingly important component of the labour force - part-time work. This thesis goes some way towards offsetting this limitation and extends the existing literature to include an analysis of wage differentials between full- and part-time workers, and then estimate the overall differential between males and females, after accounting for part- time work.
For Australia, in 1986 approximately 79 per cent of part-time workers were female. Approximately 40 per cent of females who worked did so on part-time schedules. For the United States in the same year,
approximately 67 per cent of part-time workers were female. Approximately 27 per cent of females who worked were part-time workers2.
These estimates clearly identify that to understand the role part-time work has in the labour market, it is necessary to come to terms with female participation in part-time work. This thesis attempts to contribute to the existing evidence on part-time work in three ways. Firstly, it establishes the sign and order of magnitude of the wage differential between females working full- and part-time work in Australia and the United States. Secondly, to explain why the wage differential differs between the United States and Australia. Thirdly, to determine the impact of part-time participation on the average wages males and females receive.
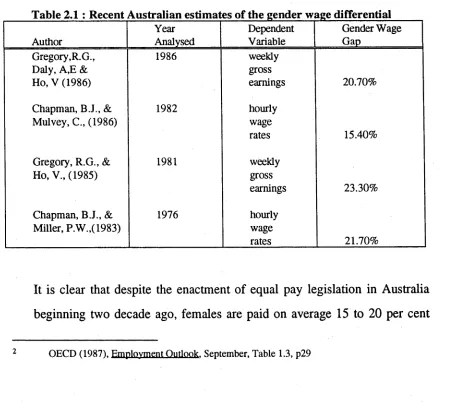
Table 2.1 details the evidence from Australian studies on the extent of the gender wage differential.
Table 2.1 : Recent Australian estimates of the gender wage differential A uthor
Y ear A n alysed
D ependent V ariable
G ender W a g e G ap
G re g o r y ,R .G ., 1986 w eek ly
D a ly , A ,E & g ro ss
H o, V (1 9 8 6 ) earnings 2 0 .7 0 %
C h ap m an , B .J., & 1982 hourly
M u lv e y , C ., (1 9 8 6 ) w a g e
rates 15.40%
G reg o ry , R .G ., & 1981 w eek ly
H o, V ., ( 1 9 8 5 ) gross
earnings 23 .3 0 %
C h ap m an , B .J., & 1976 hourly
M iller, P .W .,(1 9 8 3 ) w age
rates 21 .7 0 %
It is clear that despite the enactment of equal pay legislation in Australia beginning two decade ago, females are paid on average 15 to 20 per cent
[image:25.553.55.505.387.789.2]less than males. However it is necessary to recall a study of the gender wage differential by Haig (1982) who utilised data collected before the 1972 Equal pay decision, and found evidence to support the existence of a gender wage differential of 46 per cent. This provides some evidence to support the hypothesis that the gender wage differential has narrowed as a result of Australia's institutional framework. Indeed, Gregory et.al. in their analyses (which are all conducted after the full implementation of the equal pay legislation for Australia) often assume that Australia's pay structure provides a non-discriminatory control against which international evidence may be related.
From Table 2.2 it is clear that whilst Australia has made approximately a 30 percent reduction in the level of inequality between the wages of males and females between 1960 and 1980, the United States ratio has remained constant. For most other countries, some reduction in the level of inequality between male and female wages would appear to have been made. During the 1980's, the gender wage differential began to narrow in the United States, but to date the change is not as great as that observed in Australia.
Table 2.2 : International Estimates of the full-time gender wage differential *
Country 1960 1980
Australia 0.59 0.75
Britain 0.61 0.79
Canada 0.59 0.64
France 0.64 0.71
Germany 0.65 0.72
Italy 0.73 0.83
Japan 0.46 0.54
Sweden 0.72 0.90
United States 0.66 0.66
USSR 0.70 0.70
Although the existing literature has provided a valuable contribution to the debate on the underlying influences upon the gender wage differential, there exists two deficiencies in the approaches used.
Firstly, most studies exclude part-time workers from the analysis. Since around 40 per cent of Australian females and around 10 per cent of men are working on part-time schedules, it is important to understand the effect of explicitly including these groups from the gender wage differential.
Secondly, as a result of the exclusion of part-time work from models to estimate the gender wage differential, the role of non-random sample selection effects in a three way choice between working full- and part-time and not working, has to be conducted. This thesis contributes to the existing literature on the gender wage differential by quantifying the role these two factors have upon the overall estimate of the gender wage differential.
2.3 The wage differential between full- and part-time workers
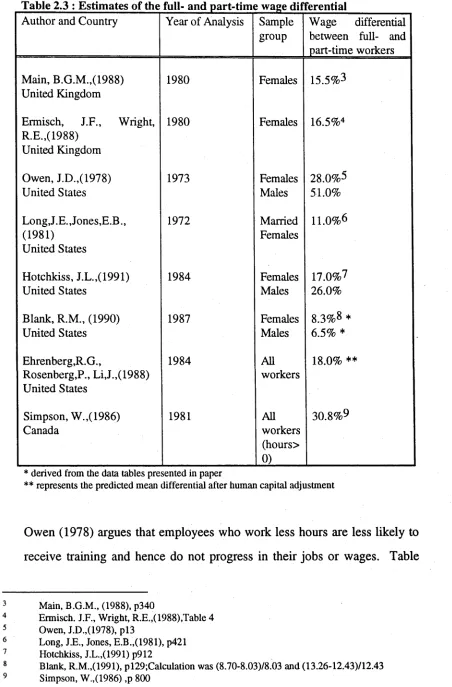
Although no studies exist for Australia, there are several studies for the United States which analyse the wage differential between full- and part-time workers. Owen (1978) estimated that full-time employed males earned approximately 30 per cent more than males employed part-time, and the comparative estimate for females was 17 per cent. Long and Jones (1981) focussed on married women and found an 11 per cent wage differential which favoured full-time workers.
Table 2.3 : Estimates of the full- and part-time wage differential
A u th o r a n d C o u n tr y Y e a r o f A n a ly s is S a m p le
g r o u p
W a g e d iffe re n tia l
b e tw e e n fu ll- a n d
p a r t- tim e w o r k e r s
M a in , B .G .M .,( 1 9 8 8 )
U n ite d K in g d o m
1 9 8 0 F e m a le s 1 5 .5 % 3
E r m is c h , J .F ., W rig h t,
R .E .,( 1 9 8 8 )
U n ite d K in g d o m
1 9 8 0 F e m a le s 1 6 .5 % 4
O w e n , J .D .,( 1 9 7 8 )
U n ite d S ta te s
1 9 7 3 F e m a le s
M a le s
2 8 .0 % 5
5 1 .0 %
L o n g ,J .E ., J o n e s ,E .B .,
( 1 9 8 1 )
U n ite d S ta te s
1 9 7 2 M a rr ie d
F e m a le s
U . 0 % 6
H o tc h k is s , J .L .,( 1 9 9 1 ) U n ite d S ta te s
1 9 8 4 F e m a le s
M a le s
£ £ O O r-4 's d (N
B la n k , R .M ., ( 1 9 9 0 )
U n ite d S ta te s
1 9 8 7 F e m a le s
M a le s
8 .3 % 8 *
6 .5 % *
E h r e n b e r g ,R .G .,
R o s e n b e r g ,P ., L i ,J .,(1 9 8 8 )
U n ite d S ta te s
1 9 8 4 All
w o r k e r s
1 8 .0 % **
S im p s o n , W .,( 1 9 8 6 )
C a n a d a
1981 AH
w o r k e r s
( h o u r s >
0 )
3 0 .8 % 9
* derived from the data tables presented in paper
** represents the predicted mean differential after human capital adjustment
Owen (1978) argues that em ployees who work less hours are less likely to
receive training and hence do not progress in their jobs or wages. Table
Main, (1988), p340
Ermisch. J.F., Wright, R.E.,( 1988),Table 4 Owen, J.D.,(1978), p l3
Long, J.E., Jones, E.B.,(1981), p421 Hotchkiss, J.L.,(1991) p912
[image:28.553.62.514.63.750.2]2.3 provides details of the extent of the full- and part-time wage differential for the United States, Canada and the United Kingdom10.
Estimates of the wage differential between full- and part-time workers differs significantly between countries. On average the magnitude of the full- and part-time differential is higher than the gender wage differential. Additionally, in each of these countries part-time wages are lower per hour than full-time rates. Australia, therefore, is an unusual case. In Australia, part-time workers receive more per hour than full-time workers.
The empirical findings on the gender wage differential and the full- and part-time differential have provided an interesting basis for comparison. In subsequent chapter an attempt shall be made to estimate the full- and part-time differential for Australia and the United States as well as the gender wage differential after explicitly accounting for part- time work, for both countries.
So far, two question have been focussed upon - why do males earn more than females ? and why do full-time workers earn more than part-time workers in the United States but not in Australia ?
2.4 Why do wages differ between individuals ? 11
Many factors have been suggested to explain why wages differ between individuals. They include ability, motivation, family background, chance, educational qualifications, experience, age and the type of job. Perhaps the first attempt to reconcile wage differences between individuals was Adam Smith in his Wealth of Nations. He stated
ii
Australia is not represented in this table, as, to date, there does not exist any analysis specifically targeted at explaining the full- and part-time wage differential.
[t]he five following are the principal circumstances which, so far as I have ben able to observe, make up for a small pecuniary gain in some employments, and counter-balance a great one in others: first, the agreeableness or disagreeableness of the employment themselves; secondly, the easiness or cheapness, or the difficulty and expense of learning them; thirdly, the constancy or inconstancy of employment in them; fourthly, the small or great trust which may repose in those who exercise them; and, fifthly, the probability or improbability of success in them 12
This thesis does not propose to examine the wages of individuals which may be explained on the basis of differences in their risk behaviour such as individuals who accept low paying jobs in the hope of becoming a superstar13. Instead, an analysis of why wages differ between individuals when their wages are not subject to significant volatility as a result of extreme risk profiles is undertaken. Three theories are discussed in the context of explaining individual's wages - human capital, segmented markets and efficiency wages.
2.4.1 The human capital model
The human capital model forms the basis for several explanations of individuals earnings. This theory assumes that individuals invest in human capital (which includes education, training, health care and migration) in the expectation of participating in both labour and non-labour market activities. The type and quantity of the investment determines an individual's wage (including reservation wage for non-workers). The individual is assumed to maximise lifetime earnings given the costs and benefits associated with the investment in human capital.
12 13
The model is derived from papers of Ben-Porath (1967), Mincer (1974) and Becker (1975). Following Mincer and Polachek (1974), the human capital earnings function may be stated as
(1) Et = rCtl
where Et is the gross earnings in period t, Ct_i is the dollar amount of investment in period t-1 and r is the average rate of return to an individuals human capital.
Rewriting (1)
(2) E, = £ „ + r §
J-E ,-,
Re-writing (2)
(3) E, = E,.i + E, . i r k,.i = E,,(1+ r k j
where kt. \ is the ratio of investment expenditure to gross earnings in period t-1. Following a simple expansion of (3), and assuming that r is a constant 14, and noting Et=Eo(l+rk0)(l+rki)....(l+rkt_i), may be approximated by the logarithmic statement In (1+rk) ~rk, then
t - i
(4) £, = £„ + r 5 > ,
School and post school experience may be separated as follows
(5) £ , = £ 1 + r X k 1 + r ^
i=0 i=s
where kj and kj are investment ratios during and after school respectively. Imposing the assumption that the investment ratio in school equals one, the earnings function becomes
t —1 (6) Et = E0 + rs + r ^ JkJ
j = s
We may now estimate this equation as (7) Wi = X'ß + e
where is the hourly wage rate for individual i, and X represents a vector of endowments which include educational attainment (which may be either years of schooling or, as is done in this paper, dummy variables for each classification allowing for different returns to each level of education), experience is labour force experience (using the Mincer approximation of age in years - age left school)15, as well as occupational, demographic and other human capital terms. As returns to experience are not thought to be constant over an individuals lifetime, a quadratic experience term is also included in the specification of the earnings function.
Productivity improving investment in human capital may take two forms- formal education and on-the-job training. In the case of formal schooling, individuals pay the direct costs of tuition and forgo current earnings in order to raise their future productivity which in turn leads to higher wages than they would be otherwise able to achieve. For on-the-job training 16 Becker (1975) identified two types of training - general and specific. He argued
[g]eneral training is useful in many firms besides those providing it..[and]..[e]mployees pay for general on-the-job training by receiving wages below what they would receive elsewhere 17
Contrasted to this is
A discussion of this specification of the experience term is conducted in Chapter 5. Additional regressions which attempt to demonstrate the sensitivity of other regressors to the specification o f the experience term is undertaken in Appendices F and G.
Arrow (1962) proposed that " technical change in general may be ascribed to experience, that is the very activity of production which gives rise to problems for which favourable responses are selected over time". That is, Arrow argues increases in total labour productivity may arise from factors other than physical capital investment changes.
[completely specific training [which] can be defined as training that has no effect on the productivity of trainees that would be useful to other firms18
For specific training, the costs and benefits are shared between the employer and employee.
The shares of each depend on the relations between quit rates and wages, layoff rates and profits, and on other factors....such as the cost of funds, attitudes toward risk and desires for liquidity19
Training may not be completely specific nor completely general. Becker argued that both type of training have a similar effect on productivity.
The predictions of the model with respect to the investment in human capital for full- and part-time employment suggest that individuals who intend to work in part-time work rather than full-time work will invest in lower levels of human capital if the rate of return to effort are the same for both groups. This results from an individual evaluating the lifetime returns to human capital investment. Since costs, unlike benefits, of education are not dependent upon the intensity of labour force participation20, the number of years of workforce experience required for an individual to break-even regarding their investment in human capital is longer for individuals working part-time rather than full-time. Thus, in cost-benefit terms, part-time workers would be expected to undertake lower level of education than full-time workers21.
Also, individuals who treat part-time work as a short-term proposition before or after undertaking full-time work (such as the young, old and those with young dependants) will be more closely related to full time workers than those not in the labour force with respect to their human
Becker, G.S.,(1975),p26
Becker, G.S.,(1975),p30. An extension of this single period model to a two period model is analysed in Hashimoto (1981).
For a discussion of recent changes to student fees in Australian higher education see Chapman, B.J., Chia, T.T.,(1992)
capital endowments. Part-time work may also be viewed as a means to lower the rate of human capital depreciation which would be observed if the individual withdrew completely from employment.
In summary, the simple predictions from the human capital model with respect to part-time workers may be summarised into three. Firstly, part-time workers are predicted to have less education than full-time workers since their expected labour force commitment is lower. Additionally, the education part-time workers obtain will depreciate a higher rates than full-time workers due to reduced workforce exposure. Secondly, since part-time workers has a smaller hours schedule than full time workers, employers are less likely to provide training for part-time workers, and hence their productivity is predicted to be lower than that observed for full-time workers. Thirdly, by its very nature, part-time workers will obtain less workforce experience than full-time workers.
2.4.2 Criticisms of the human capital model
The most significant criticism of the human capital theory has developed from sociological studies. Fischer (1987) criticises human capital theory on the basis that the institutional forces and existing economic incentives that affect and limit the range of occupations open to women 22 are not explained by the theory. Indeed, it is argued that human capital theory merely rationalises the existing gender wage and participation structure rather than providing an explanation. Supporting this conclusion Daymont and Andrisani (1984) state that
..after many empirical attempts spanning more than a decade, researchers are still unable to account for more than about half of the male-female differences in earnings through differences in productivity related variables23
22 23
England (1982)
The implicit assumption of the human capital theory of free occupational choice is questioned on the grounds that sexual stereotyping limits female choices prior to labour market entry. Rather than concentrating on ex post labour market performance, it is argued that ex ante conditions should be examined and explained24. It is argued that social conditioning of women for the labour market is different than that for males and that this effects occupational outcomes.
The social conditioning is said to encourage females into nurturing roles and household related work without the "male" traits of aggressiveness, physical activity, and mathematical aptitude. As a result of these conditioned roles, when females do enter the workforce they are encouraged into occupations such as social work, teaching, nursing and clerical work. Conversely jobs which require the traits which social conditioning portrays as "male" as a result of their quantitative nature, supervisory positions, physical activity and time-consuming high energy demands such as engineer, gardener, executive or mechanic are under represented by females and dominated by males25.
England (1984) argues that the allocation of domestic roles to women itself perpetuates social stereotyping and male self-interest creates impediments to prestigious male occupations26 whilst allowing an easier transition for women into occupations which are complementary to their socially conditioned traits. Stephan and Levin (1983) studied USA PhD graduates and found that fields of study are consistent with socially conditioned traits. Other authors27 have viewed occupational choice a result of "anticipatory socialisation" whereby future choice is somewhat
See Corcoran and Courant (1985) (1987), Killingsworth (1985); England (1982) (1984); England and McCready (1986).
Chadorow (1978) and Monk-Tumer(1984).
See Daniel, A.,(1983), Quine, S.,(1986) , Jones, F. L. (1989) for the determination of prestigious occupations for Australia.
predetermined by societies role in the formative development of an individual's tastes which include perceived opportunities and costs of working. As society determines different roles for males and females, so the tastes which impact on work decisions also differ for males and females. Lehrer and Stokes (1985) empirically analyse the role of stereotyping on occupational outcomes. Their study failed to find evidence of stereotyping affecting occupational outcomes.
Additional criticisms of work undertaken which utilises the human capital approach fall into four broad categories. Firstly, the wage may not reflect the entire reward for the job. That is, factors such as prestige and fringe benefits will not be included in the wage for that job. This of course is not a criticism of the theory but of the available data and analysis which fails to account for these effects.
Secondly, although the productivity differences are assumed to be measurable, and perhaps are measurable for jobs involving the production of physical goods, differences in productivity for most other jobs are virtually impossible to measure. Thus, although researchers28 have attempted to estimate the productivity of an individual using differences in their stock of human capital (which may be represented by education, training, work experience and health), no evidence exists on the degree to which these factors proxy the true productivity level of an individual.
Thirdly, some researchers argue that factors other than worker productivity affect wages such as union strength and the international competitiveness of an industry or firm29. The human capital model does not include such factors as explanators of wages, and hence any effect from such factors will be residuals to any decomposition, and hence incorrectly attributed to discrimination.
28 29
Fourthly, factors such as experience, are themselves often proxied by Mincer's formulation (age-years of schooling-6)30, and even if this number were an accurate representation of experience, any effect experience may have in the determination of wages may simple reflect seniority31. A related issue is whether years of schooling is an appropriate indicator since it does not account for variations in quality. For example, one would expect a degree holder with a distinction average to have a greater earnings capacity than another student with that same degree who has a pass average. Again, this point represents a criticism of the empirical application of the theory rather than the theory itself.
Specific criticisms which relate to part-time work may be summarised into three points. Firstly, the human capital model does not account for the differences in the hours of work between full- and part-time workers. Thus, the motivation and skill required for the first hour of work is assumed to be equal to the thirtieth hour. Secondly, whilst the experience proxy (age-years of schooling-6) may not be a good measure of actual experience for full-time workers, it is likely to be less accurate in its estimation of a part-time worker's experience32 as a result of them spending less time on-the-job. Thirdly, as is discussed in the following chapter, trade unions do not target part-time workers as potential members. Thus, the benefits associated with unionisation which accrue to full-time workers, will be less likely to flow through to part-time workers.
A recent Australian study by Lambert, S.,( 1991) tests the results from different proxies for experience and finds in a comparison of actual experience in a wage equation (as is the case for this analysis), Mincer's proxy produces different, although similar results. The effects of different measures of experience in the estimation of human capital earnings functions of full- and part-tim e workers is undertaken in appendices E and F.
Edwards (1977) argues experience should be interpreted as a proxy for seniority rather than experience. Daly (1990) analyses the relationship between experience and wages over the life-cycle for Australia, the United States and Britain.
2.4.3 Segmented labour market theory
According to this theory, institutional factors such as wage arbitration, unions and non-competitive product markets divide the labour market into two - a primary and secondary market. In the primary labour market, conditions are good for both employees and employers. For example wages are relatively high and relatively high amounts of training occur. In this market, there exists a set of labour markets internal to each firm where specific rules and institutions (for example seniority) govern the allocation and cost of labour. This market retains its advantages by limiting entry of individuals.
The secondary labour market may be stereotyped as offering poorly paid jobs, relatively poor conditions and few opportunities for training. Taubman and Wächter (1986) have argued that if training does exist in this market, it may actually "scar" individuals future earnings.33
Secondary labour market theories pervade many other theories of labour markets. Bulow and Summers (1986) develop a dual labour market based upon the idea of efficiency wages whereby workers in the primary labour market are paid above their alternative wage while workers in the secondary market are paid a competitive wage. Akerlof (1982) characterises the primary labour market as that part of the economy where the 'gift' of hard work by workers is reciprocated by the 'gift' of higher wages. In Akerlof s secondary labour market, 'gifts' are not exchanged and competitive wages apply.
The demarcation between primary and secondary labour markets beyond the generalities presented here have been difficult to ascertain.
33 Taubman and Wächter, (1986), p 1185. It is also suggested that training in this market may
Taubman and Wächter (1986) suggest research in the United States aimed at finding this demarcation has been relatively unsuccessful34.
In their paper on dual labour markets, Dickens and Lang (1985)35 identify that dual labour markets consist of a
distinct low wage (secondary) labor market in which there are no returns to schooling and workers do not receive on-the-job training, and that there are non economic barriers that prevent at least some secondary workers from obtaining better (primary) jobs.... Dual market theorists have maintained that jobs can be roughly divided into two groups : those with low wages, bad working conditions, unstable employment, and little opportunity for advancement (secondary jobs), and those with relatively high wages, good working conditions and opportunities for advancement into higher paying jobs (primary jobs)...Advocates of this view have argued that primary sector jobs are rationed, and that, in particular, women, blacks, and other minorities find it difficult to obtain primary employment.'36
Most studies which have attempted to analyse the degree to which a labour market may be characterised by some form of duality, compare the job/worker characteristics37 or compare the wages of occupations and
industries38.
Doeringer and Piore (1971) argue that as a result of technology which requires specific skills, and hence significant on-the-job training, employers attempt to minimise turn-over by creating structures within the firm which reward length of service - such as pay increments based upon seniority and promotion up a well-defined job-ladder. Although the supply and demand of the labour and product market affect employers decisions, one primary aim is to minimise training and hiring costs through a reduction in labour turnover. Thurow (1975) suggests higher wages are
Sloane (1985) also supports this conclusion. Dickens, W.T., Lang, K.,(1985)
Dickens, W.T., Lang, K.,(1985), p792 Gordon, D. (1971)
needed to 'bribe' more experienced workers to pass on their skills to new entrants. Gordon (1972) and Stone (1975) argue there exist many different job ladders, each with several rungs which may divide workers through factors such as sex, race, disabilities, ethnicity and age thereby minimise the bargaining power of workers. Edwards (1979) argued that management creates internal job markets to provide incentives for workers to perform well in their job. Kahn (1976) uses case study evidence on a firm in which the union was able to transform the workplace into one which allowed employees to receive added benefits through seniority increments and employment stability.
In each of the internal labour market explanations, as the level up the job ladder increases, so does the effect on wages of the internal arrangements. Through a reduction in the supply of labour external to the firm, existing workers are able to achieve the benefits such as wage ladders, which increase the wage to above the competitive minimum.
Primary and secondary labour markets relate directly to full- and part-time work, respectively, when we consider that full-time work generally attracts higher wages39, higher levels of training, higher degrees of unionisation, permanency in employment and access to benefits such as superannuation and fringe benefits relative to part-time work40.
2.4.4 Efficiency Wage Models
Human capital predicts that individuals are paid on the basis of their investment in factors such as skills, education, and age. These human capital endowments attract higher remuneration as a result of workers with
39
40
Except of course, for Australia where full-time wages per hour are lower than part-time wages per hour.
these attributes being seen as having higher levels of productivity. An alternative hypothesis to the relationship between productivity and earnings is collectively known as efficiency wage models. Efficiency wage theory suggests that rather than human capital leading to increases in productivity it is earnings which exhibit a direct causal link with productivity.
The foundations for efficiency wage theory can be traced back to Adam Smith who, noting the existence of efficiency wages for goldsmiths, stated that
The wage for goldsmiths and jewellers are every-where superior to those of many other workmen, not only of equal, but of much superior ingenuity; on account of the precious materials with which they are entrusted 41
Efficiency wage theories were also used in development economics literature where higher wages were justified on the basis that higher levels of nutrition increase the productivity of the workforce.
More recent contributions to efficiency wage theories 42 have been
used to explain differences in inter-industry wage levels. Three explanations of efficiency wages are commonly offered as :
In one case, firms pay higher wages than the workers' reservation wage so that employees have an incentive not to shirk. In a second version, wages greater than market-clearing are offered so that workers have an incentive not to quit and turnover is reduced. In a third version, wages greater than market-clearing are paid to induce loyalty to the firm.43
Differences in inter- and intra-industry wages, and similarly for occupations, are addressed by efficiency wage theory.
If all firms were identical, one would not expect to see different firms paying different wages even if efficiency wage considerations were important. But when there are differences in their ability to
Smith, A .,(1776), p l2 2
Krueger and Summers (1988), Katz (1986), Dickens and Katz (1987), Stigliz (1986) and Akerlof and Yellen (1985)
bear the costs of turnover, to supervise and monitor their workers, or to measure labor quality, either because of differences in management capacity, or because of differences in the technology of production then the optimal wage to pay will vary. Thus efficiency wage models unlike standard competitive formulations can explain why characteristics of firms that do not directly affect workers' utility can affect wage rates.44
From this quotation it is clear that unlike the human capital model, efficiency wage theory emphasises firm differences (unobserved and observed) in the explanation of wage differentials rather than individuals endowment differences (observed and unobserved).
In summary, efficiency wages differ from traditional human capital, neo-classical earnings differential explanations by emphasising the demand side factors which affect wages. The contribution of efficiency wages to understanding wage differentials beyond the human capital endowment- productivity effect provides justification for observed industry and occupational wage differences in that the more educated tend to be in occupations/industries where monitoring costs or labour turnover is highest. The wages of individuals with lower human capital endowments may be set by employers at a competitive rate whilst the more highly skilled worker may receive an efficiency wage premium thereby leading to the occupational/industrial wage differential even allowing for differences in skills. As occupational/industrial structure is seen as an important consideration in the understanding of full- and part-time wage differentials this explanation is incorporated into the overall findings.
Efficiency wage theory has direct implications for full- and part- time work. Firstly, if part-time workers are regarded as 'bad' workers in terms of motivation and skill, then it is predicted that the wages part-time workers receive would be lower than full-time workers. Secondly, since the training costs of part-time workers are at least equal to full-time
workers, firms are likely to attempt to recoup any difference by lowering the wage of part-time workers relative to those working full-time. Thirdly, since part-time workers have non-standard hours the costs of monitoring would be higher than for full-time workers. Finally, as discussed in Chapter 3, some jobs by their very nature (such as having a peak periods of demand) lend themselves more readily to part-time work. Other jobs have a constant, stable demand for attendance (such as supervisory/managerial jobs) and thus lend themselves more readily to full-time work. This leads
to occupational segregation between full- and part-time workforce.
2.5 Differences in occupations : an overview45
Occupational segregation refers to "a situation where groups, ... tend to work in a different set of occupations."46 One measure of occupational segregation is the index of segregation47. This measure has one limitation in that it does not account for variations from within occupations. For example, in the professional category, males are well represented as engineers, dentists, veterinarians whilst females are poorly represented in these groups and well represented in categories such as librarians, teachers and nursing.
Obviously the degree of segregation is subject to the level of aggregation of occupational groups. A number of studies have estimated the degree of segregation which exists when a large number of occupational categories are analysed48. The approach adopted in this thesis is to investigate the effects of occupational distributions on wage
Derived from Blau, F.D., Ferber, M.A.,(1986), pl52-181 Blau, F.D., Ferber, M.A.,(1986), p 158-59
outcomes49, rather than simply estimate an index of occupational segregation based upon sex and labour force status.
Job segregation differs from occupational segregation in that individuals may be equally represented in an occupation but not share the same jobs. Blau (1977) conducted a study which revealed that within clerical occupations which are integrated by sex, males were more likely to be found in high-wage firms. If institutions are important then two opposite effects may be occurring. First, customs and traditions may stereotype females into certain jobs. Second, legislative controls may encourage more diversity than the perfect market would normally produce. The stylised facts are that part-time workers are more likely to have less diversity in their jobs, and females are likely to be more segregated than males.
Three broad reasons are presented to explain why certain groups are concentrated into specific segments of the labour market. First, if one group earns less than the other, it may be argued this results from their choice of occupation. Second, it could be argued that certain groups are explicitly excluded from certain jobs. Finally, the wages which accrue to a particular job are low (high) as a result of the type of employees concentrated in that job. Each of these explanations will be discussed further.
2.5.1 Choice of jobs which offer less pay
As noted by Treiman et. a l (1981) there are four basic reasons why females may choose jobs which have lower pay than those chosen by males.