THE SAMPLING AND IDENTIFICATION OF COMPONENTS
IN VOLATILE ORGANIC MIXTURES
by
R.B. Chesterman, Utp. App. Chem.
Submitted in partial fulfilment
of the requirements for the degree of
Master of Science
UNIVERSITY OF TASMANIA
HOBART
December 1982
Except as stated therein, this thesis contains no material which has been accepted for the award of any other degree or diploma
in any university, and that, to the best of my knowledge and belief, the thesis contains no copy or paraphrase of material previously published or written by another person, except when due reference is made in the text.
ACKNOWLEDGEMENTS
I wish to gratefully acknowledge the advice and
encouragement of my supervisors, Professor H. Bloom,
Dr. B.V. O'Grady, and Dr. I.R.C. Bick, who offered many
helpful suggestions during the course of this work.
I am also indebted to Mr. C. Richards of the Chemistry
Department workshop for the construction of the prototypes
of -the sample desorption equipment; and to Mrs. H. Hen,
Mrs. B. Dix and Mrs. B. Thompson of the secretarial staff
who assisted with the preparation of the diagrams and
figures, and who answered once again with patience,
questions concerning preparation of the text that must
have been put to them many hundreds of times before.
The assistance of the staff of the Central Science
Laboratory for help with mass spectral and information
processing of material is gratefully acknowledged.
The help of Dr. J. Madden, and the staff of the CSIRO
Forest Research Section at Cambridge, for logistic and
other support is.. gratefullyacknowledged. For the help of
my wife Lynne with the typing, and her understanding of the
curtailment of family life associated with part-time
CONTENTS
Page No.
CHAPTER I
INTRODUCTION.
1
CHAPTER II EXPERIMENTAL TECHNIQUES FOR THE
CONCENTRATION AND ANALYSIS OF VOLATILE
ORGANIC COMPOUNDS.
2
A.Concentration and Trapping Techniques. 3
B.Direct Headspace Collection. 15
C.Separation and Analytical Techniques. 17 •
D.Detection and Analytical Techniques. 25
E.Sources of Error in Trace Volatile
Analysis.
29
CHAPTER III DEVELOPMENT OF A SAMPLING SYSTEM FOR
VOLATILE ORGANIC MIXTURES. 32
A.Selection of a Sample Adsorption Medium. 34
B.Development of Sample Collection
and Desorption Equipment. 40
C.Blank Determinations and Sample
Trap Storage.
47
CHAPTER IV AN EXPERIMENTAL COMPARISON OF VOLATILE
ORGANIC SAMPLING TECHNIQUES. 54
A.Experimental.
55
B.Discussion.
66
C.Summary and Conclusions. 69
CHAPTER V VOLATILE COMPONENTS OF SOME NATIVE PLANTS. 70
A.Components of the Steam Volatile Oil
of Drimys lanceolata. 71
B.Components of the Steam Volatile Oil
of Prostanthera lasianthos
83
C.Volatile Components of
Boronia megastigma 94
CHAPTER VI VOLATILE COMPONENTS OF PINUS RADIATA.
102
A. The Composition of the Steam Volatile
Components of Bark Oil P. radiata 106
B. Collection of Headspace Samples From
the Bark of P. radiata. 110
C. A Comparison of Bark Volatiles From
a Girdled P. radiata
113
D. Composition Changes of Bark Headspace
of P. radiata.
122
CHAPTER VII CONCLUSIONS
126
REFERENCES
129
ABSTRACT
Public awareness of the toxic effects of some volatile organic compounds present in the working and home
environment has created a requirement for the accurate measurement of the concentration of these substances. Similar techniques may be used for the examination of the volatile components of plant material and assist in
determining the optimum economic time for harvesting, and also provide useful information in the areas of plant-insect interaction. This thesis examines some of the sampling and analytical aspects for the determination of trace volatile organic compounds present in air.
A brief critical review of the literature is presented describing concentration and trapping techniques, headspace collection, separation and analytical techniques, detection and measurement of the separated components and the sources of error in trace volatile analysis.
The development of an experimental sampling system for volatile organic compounds in air, based on trials conducted with activated carbon and a porous polymer is presented.
• Two methods of sample desorption are described and the
development of sampling equipment based on Tenax GC, thermal elution with secondary trapping and flash injection into the inlet of a gas chromatograph is described.
iv
from an industrial furnace, and a number of trapping and separation techniques were used to determine the nature of the irritant. The experimental methods used are described, and conclusions are drawn concerning the suitability of the various techniques for trace organic volatile sampling.
The steam volatile components of the oil of two
Tasmanian native plants, Drimys lanceolata and Prostanthera lasianthos are examined using gas chromatography retention criteria on two columns and mass spectral information. A comparison of the volatile components of Boronia megastigma
in the flowers, concrete, and.concrete headspace is described and the application of the technique to the determination of the optimum time for harvesting, is outlined.
ABBREVIATIONS
GC - Gas Chromatograph
FID - Flame Ionisation Detector
MS - Mass Spectrometer
TIC - Total Ion Current
HPLC - High Performance Liquid Chromatography
CW2OM - Carbowax 20M Stationary Phase
OV101 - OV Silicone 101 Stationary Phase
GLT - Glass Lined Stainless Steel Tubing
SCOT - Support Coated Open Tubular (Column)
WCOT - Wall Coated Open Tubular (Column)
MIKES - Mass-analysed Ion Kinetic Energy Spectrometer
PMD - Programmed Multiple Development (Chromatography)
TDL - Toxic Dose Level
ppb - Part per billion
ppm - Part per million
1
INTRODUCTION
The identification of components in complex mixtures of volatile organic substances, plant volatiles, working and living atmospheres, and volatile substances of forensic interest, has been limited by the techniques available for collection and identification.
Identification of compounds in some workday situations has established the presence of a number of carcinogenic, mutagenic and teratogenic agents as well as those known to cause liver and other vital organ malfunctions. An
increasing awareness of the influence of some volatile components on human health has created the need for a generally acceptable group of techniques for their separation and identification.
2 CHAPTER II
EXPERIMENTAL TECHNIQUES FOR THE CONCENTRATION AND ANALYSIS OF VOLATILE ORGANIC COMPOUNDS.
Introduction
The sampling of volatile organic materials in a variety of atmospheres ranging from the confined air in a space capsule [1] to background levels in isolated geographical regions of the earth's surface requires collection,
concentration and identification techniques with varying degrees of complexity.
Individual component monitoring and identification is essential in an enclosed area, such as an industrial site, where the need to recognise the health hazard that specific compounds have for persons continually exposed to volatile organic materials. The tracing, fingerprinting and
identification of odorous volatile components in other areas such as processing plants, sewage treatment works and
abattoirs would also provide information on the degree of risk of exposed persons to hazardous compounds. The
qualitative and quantitative trapping and identification of components would provide some scientific basis for the measurement of odours and some other parameters affecting what is loosely termed "the quality of life" in an
3
A. Concentration and Trapping Techniques
Techniques for the sampling of volatile organic mixtures in the atmosphere necessitate the concentration of
components to a point where separation and measurement is within the capabilities of the analytical instrumentation. The concentration of components by factors of one hundred to . ten thousand are often required.
Trapping or concentration techniques may be considered under three major headings: condensation methods,
adsorption methods and headspace techniques. (i) Condensation or Cryogenic Methods
Earlier attempts to concentrate volatile organic
materials from air involved the passage of litre quantities of air through a stainless steel or glass U-tube immersed in a freezing mixture of solid carbon dioxide/acetone, or
liquid nitrogen [3-5]. Volatiles and semi- volatile
components of cigarette smoke [6] and food products [7] have been trapped utilising this technique. Detection limits of 2 ,ug/m have been claimed [8]. In 1967 Willis [9]
described a trapping system involving the cryogenic
collection of a sample in one loop of a gas chromatograph (GC) separating column. Improved resolution was claimed especially for lOw molecular weight (Cl to C5) hydrocarbons. However, as a rapid routine method of sample trapping there are obvious practical limitations; for example the carriage of cryogenic liquids to remote or awkward situations (such
Baker in a series of articles [10,11], summarised and reviewed some earlier theoretical and practical aspects of trace organic contaminant concentration by freezing. A major problem associated with cryogenic trapping procedures
is the co-condensation of considerable quantities of water and the inherent losses of low molecular weight water soluble compounds upon its removal. Tyson and Carle [12], circumvented this by passing the cryogenically trapped water-organic mixture through a preparative GC to separate the water and then through a gas chromatograph/mass
spectrometer (GC/MS) for identification of components
(Figure 1). High recovery efficiencies were obtained for a selection of terpenes.
Pa " MPAROME
001051
1412 ir
eh !
m 0(110101
511000 FLOW
SECOND
S ACE AA? VENT Two SEW 550,11
I r
I
1i?001000UOVTICAL 00550100VENT
0 (:—:11 1110F1 2.51111.1
,
(4 MAUER.
FLUE SUM I 1qu TO
lassoC4 I 1:11/ATIOI VASS RAP , f SW f
sw MU 01110100 SPECTOONETEI NEM SAMPLE IN FIAST SEW IRA? CRYOGENIC
[image:11.557.60.487.47.667.2]PRECONCENTRATOR PREPARATIVE GAS CHROMATOGRAPH GC—MS
Figure I. Schematic Diagram of a Preconcentration and Analytical System [12].
Cryogenic trapping in conjunction with hydrophobic porous polymers is an effective method for sampling low boiling point organic compounds such as ethylene [15]. Teranishi
[13]
utilised cryogenic trapping procedures for collection of volatile metabolites from human breath and5
urine; and Copier [14] trapped eluent from a GC on cooled glass tubes for subsequent IR analysis.
(ii) Adsorption Methods (a) Carbon Trapping
Carbon in various forms has been widely used for collecting organic compounds from air [16,17] and water [18,19]. Activated carbon has differing adsorption properties depending upon its source material (coconut, bone, coal or wood), and its particle size. The use of activated carbon for the economic removal of trace organic compounds from water has been of increasing importance following legislation introduced by the U.S. Environmental Protection Authority, brought about by the discovery of carcinogenic compounds in New Orleans water [20]. Volatile halogenated hydrocarbon concentrations have been limited by U.S. legislation to 0.5 pg/L.
6
Desorption of trapped components from activated charcoal has been effected by vacuum [23] and steam [24], but the most efficient method appears to be solvent extraction
[25,21,26], using dichloromethane or carbon disulphide.
Rubenstein [27] covers some of the theoretical aspects of sorption using activated carbon as an example.
b) Coated Support Trapping
The equilibrium concentration of trace organic compounds upon a liquid stationary phase has been utilised by a number of authors [32,33], for collection of volatiles from air, and other gases, to enable subsequent identification and quantitation by GC. Quantitative trapping of small
quantities of organic components at ambient temperatures on a support bonded silicon phases has been described in an excellent paper by Aue [34]. The elution method described involved reflux solvent extraction and concentration of solvent before injection into the GC. Loss of volatile fractions is likely to occur as a result of this latter step and this problem is mentioned in the paper. Another
7
ppb in 300mL of air. A system of collecting and transferring amounts as small as 10mg of substances of varying volatilities utilising coated supports is discussed by Bierl et al [35a]. Percentage recoveries varied from seventy to one hundred. However, only single compounds are mentioned and the system described would not appear to have the versatility to trap and recover a wide range of
compounds due to the selectivity of liquid phase on the packing material.
c) Porous Polymer Trapping
Microporous polyethylene was first used as a low temperature support in 1963 by Baum [39]. A number of reviews [40] and papers [41-47], have documented the more recent developments of this packing and trapping material. Various types of porous polymers are widely used for
separating water, alcohols and aldehydes [48] ao,s well as for
the analysis of low molecular weight gases [49,50].
Authors differ in explanations as to the mechanism of adsorption and desorption of porous polymers when used for trapping and elution of organic compounds. Hollis [40]
8
Dave [53] reviewed and summarised the information
available on porous polymers up to 1969. (Table 1).
Porous Polymer Surface Area m 2/g
Average Pore Dia. (Angstrom)
Water Affinity
Temperature Limit (Isothermal)
°C
Chemical
,
Composit•ion
"Chromosorb" 101 30-40 3500 Hydrophobic 300 STY-DVB
"Chromosorb" 102 300-400 85 Hydrophobic 250 STY-DVB
"Chromosorb" 103 15-25 3500 Hydrophobic 250 STY-DVB
Porapak N 437 - Hydrophobic 200 -
Porapak P - - Hydrophobic 250 DVB-STY
Porapak Q 840 74.8 Hydrophobic 250 EVB-DVB
Porapak Q-S - - Hydrophobic 250
Porapak R 780 75.6 Hydrophobic 250 NVP
Porapak S 670 76.0 Hydrophobic 300 ?
Porapak T 450 91.4 Hydrophobic 200 EGMA
PAR 1 100 200 Hydrophobic 250
PAR 2 300 90 Hydrophobic 250
Tenax GC 19 720 Hydrophobic 375 DPPO
XAD-2 300 90 Moderate 200 DVB
[image:15.557.66.546.156.606.2]DPPO = 2,6-diphenyl-p-phenylene oxide; STY = styrene; DVB = divinyl benzene; EVB = ethyl vinyl benzene; NVP = N-vinyl pyrrolidone; EGDMA = ethylene glycol dimethacrylate.
9
The development in 1972 by Applied Science Laboratories of a new porous polymer, 2,6-diphenyl-p-phenylene oxide
(Tenax GC) provided a versatile, efficient, thermally stable trapping medium that has been widely used for trapping
volatiles from air [2,54,55,56], water [2,57], and biological samples [54,58].
A number of authors have compared the various types of porous polymers available for sample trapping and have reached different conclusions
[59],
Butler and Burke [60] after an investigation utilising test samples of t-butanol, methyl ethyl ketone, benzene and acetonitrile, concluded that Porapaks Q and R had the best overall samplingcapacities. However, the statement was made that Tenax GC may be the absorbent of choice for samples consisting of high boiling components because of the high temperature limit.and relatively low retention volumes. These
characteristics allow sample components to be desorbed more rapidly from Tenax than from other adsorbents.
- 10-
superior to other sorbents in most cases, percentage
recovery by thermal elution procedures being better than 90% at the 50 and 100 mg level [64].
Another porous polymer, XAD-2, has been widely evaluated [65] and used [66-68], for the trapping of trace amounts of organic materials mainly in water. Claims are made that the concentration range extends from 5 parts per trillion (10 11 ) to 50 ppm [65]. It should be noted that some of the claims made in this paper especially concerning recoveries of some higher molecular weight acids have not been verified in this laboratory [69]; Nevertheless, the method has found many applications in trace organic water analysis [70, 71] despite some of the limitations posed by the removal of water from the organic extract and the losses entailed.
Morrison et al [70] claimed that "thermal desorption makes quantitative analysis difficult". This view contrasts with the opinion of a number of other authors [72 - 74], who have successfully used Tenax GC and thermal desorption
techniques. As a result of the improvement in sample
collection efficiency and the coupling of powerful capillary GC mass spectrometer computer systems, over one hundred volatile components have been collected and identified from atmospheric sources [56] using Tenax GC. Ciccioli et at [75] compared the recoveries of Tenax GC and concluded that a mixture of 0.25g of Tenax GC and 0.45g of Carbopac B
A cryogenic trapping procedure however, was advocated for low boiling point compounds up to the boiling point of pentane.
- 12 -
Compound ' tarbopack B Tenax GC
0.5 L sample 1.5 L sample 5.0 L sample 0.5 L sample 1.5 L sample 5.0 L sample
Methanol 3 0 0 1 0 0
Ethanol' 3 0 0 1 0 0
Methyl chloride 1 0 0 3 1 0
Acetone 5 1 0 68 2 0
Chloroform 100 54 1 100 84 5
Diethylamine 100 80 50 80 50 r
Isobutanol 100 100 25 100 95 16
n-Pentane
_ 100 100 100 100 50 9
Cyclohexane 100 100 100 100 50 9
n-Hexane
_ 100 100 100 100 100 20
Ethyl acetate 100 100 100 100 100
n-Butanol
_ 100 100 100 100 100 35
Benzene 100 100 100 100 100 35
Toluene 100 100 100 100 100 100
*
_ - - - -
ra-C
13 65 65 65 100 100 100
n-C
14 46 46 46 100 100 100
11-C
15 25 25 25 100 100 100
11-C
16 8 8 8 100 100 100
.
11-C17 1 1 1 100 100 100
ri-C
18 0 0 0 100 100 100
*Styrene, ethylbenzene, xylene, pyridine, chlorophenol, alkanes, alkenes
from C
7-C12 had 100%.
- 13 - d) Miscellaneous Adsorption Techniques
Activated alumina [77] and molecular sieve 5A [30] have also been used to trap volatile organic compounds from the atmosphere. However, both materials tend to irreversibly adsorb some of the higher molecular weight labile components and to show the same disadvangages as silica.
(iii) Solvent Trapping
Solvent scrubbing of organic components from air [74] has met with only limited success. The reduction of solvent volume in order to achieve the required final concentration may be accomplished with minimal losses of high boiling components but significant losses of volatile compounds do occur.
The design by Goldberg et al [78], of a closed loop solvent extraction system for trace organic compounds in water, has enbabled the concentration of components by a
factor of 10,000. The system operates with any
water-immiscible solvent, however, the selectivity of the solvent for particular compound classes and the high losses
associated with concentration, as mentioned above, tend to limit the applicability of the method.
- 14 -
Column: 2 m x 1/8" steel column, with 4 % Carbowax 20 M on Chromosorb G. AW-DMCS, 80-100 mesh Column temperature: 65 °C Sampling capillary: 150 °C Carrier gas: Argon 28 ml/min Scavenger gas: 100 ml/min,
95 % argon. 5 % methane Detector: ECD Ni63, 1 nA Attenuation: x 64 Sample temperature: 90 `C Sample: 1 ml pale ale.
injection time 8 sec Components:
1 = diacetyl (approx. 0.08 mg/I) 2 = pentan-2.3-dione
fir Head Space Analysis of Beer
The head space technique has also proved to be a valuable tool for beer analysis. The two chromato-grams shown below demonstrate practical application in routine operation. The left-hand figure (A) gives the detection of the higher alcohols and esters, and the right-hand figure (3) shows the selective detection of vicinal diketones with art ECD.
Column: 2 m x 1/8" steel column, with 15 % Carbowax 1 500 on kieselguhr Column temperature: 60 °C • Detector: FID
Attenuation: x 2 Sample temperature: 40 'C
Use Of the Head Space Technique
for Environmental Analysis
Detection of hydrocarbons in waste water Column: 2 m x 1/8" column, packed
with 15 % polyethylene glycol on kieselguhr Column temperature: 60 'C Detector: FID
Attenuation: x 4 Sample: 10 ml water Sample temperature: 75 'C
B = benzene 0.2 ppm
T = toluene 0.5 ppm
o-X = onhoxylene 0.1 ppm
- 15 -
B. Direct Headspace Collection.
Headspace collection and analysis of volatile organic compounds is applicable if the concentration of the
components is sufficient for direct detection by the analysing system. Hence, for GC analysis, one of the
previously mentioned concentration steps is often employed. Headspace sample collection is a simple, effective method of • analysing volatile components in a closed vessel. A number of automatic and semi-automatic systems for syringe
headspace GC analysis are now available commercially
[80]
following earlier work by Kolb, Novak and others [81-82]. Figure III illustrates applications of the technique to a number of different sample types.
30 A 2'0 1.0 0 mon 15
Figure III. Headspace Analysis of Volatile Components [80].
- 16-
Problems with adsorption onto the septum may be encountered with some volatiles and solvents [85-87]. This effect may be minimised by use of the more expensive but inert PTFE seals.
Injection of total headspace volatiles was undertaken by Loper [88] utilising a heated gas tight syringe in his examination of alfalfa flowers. Many other applications of routine headspace analysis are being developed. The chief advantage being speed in a quality control situation where samples such as blood alcohol, plastic volatiles, obnoxious odours, plant ripening volatiles [80,89] are to be
- 17- C. Separation and Analytical Techniques.
The introduction of capillary GC separation techniques and mass spectrometer-computer data systems, has enabled the separation and identification of complex mixtures of
volatile organic compounds that would previously have been very difficult. Examples include the separation of
automobile exhaust and miscellaneous background volatiles from ambient air [2,75], and human expired air volatiles [73].
Development work is continuing on the coupling of liquid chromatographic systems to the mass spectrometer to extend the variety of sample types capable of being introduced to this sensitive identification equipment [90].
i) Separation Techniques
Efficient separation of closely related chemical
compounds in complex mixtures is a necessary prerequisite to positive identification. Unfortunately it is not always possible to achieve this objective. In many instances therefore, only a probability of component identification can be assigned.
a) Gas Chromatography
- 18-
useful. Opposed to this, glass capillary columns are relatively fragile, require special techniques for preparation that are normally outside the scope of the average laboratory, and require somewhat complicated plumbing arrangements within the GC. Glass capillary columns are usually drawn from borosilicate or soft glass that contain levels of metal oxides that may catalyse stationary phase decomposition at elevated temperatures, resulting in column bleed.
The use of vitreous silica instead of glass as a column material provides the efficiency and resolution
characteristics of glass columns while offering improved inertness, thermal stability, flexibility and mechanical strength [93,94]. The flexibility allows the positioning of the end of the GC column through the GC-mass spectrometer
interface to a point adjacent to the ion source [95] thus reducing the peak broadening effects associated with normal interface systems. Silica capillary columns are being used in diverse areas of medical [96], environmental [97] and flavour analysis [98] to provide resolution of complex mixtures of volatile components. The wide acceptance of silica columns is shown by the number of papers presented on this subject in the 1982 "Pittsburg" Conference held in the U.S.A. [99]. (Five papers from a total of twelve in the subject of Gas Chromatography).
- 19- from packed columns [100].
Temperature programming is usually employed due to the wide range of boiling points represented in complex
mixtUres. Sub-ambient temperature programming has been used by a number of authors [101] for separation of low boiling compounds. The advantages of capacity of packed columns and the efficiency of capillary columns has been utilised by Blass et al [102] in a versatile combined configuration that allows repetitive trapping and a number of other operations within the one GC oven. Figure IV illustrates the
[image:26.557.54.515.28.823.2]connections required to perform packed column operation, capillary column operation, or combinations of the two. A relatively large quantity of a mixture may be injected onto the packed column and some components held by the trap TD for further separation on the capillary column.
Figure IV. Two Column GC System - Packed and Capillary with Valve Switching [102].
PPC - Packed Column. CC - Capillary Column. D 1/2 - Detectors. I - Injectors.
- 20 -
Development of sampling techniques for trace volatile organics from atmospheric sources [54,72,103] complements the recent advances in capillary gas chromatography. Due to the very fine detail discernible in complex mixtures,
capillary columns find a number of applications in
'fingerprinting' or source tracing in forensic science and other fields. Examples include identification of oil spills ' [104], air pollution sources [105] and the origin of
Cannabis plant material [106].
Capillary columns may be considered under two headings - SCOT columns are Support Coated Open Tubular columns with an internal diameter of 0.5mm, where fine solid particles of diatomaceous earth support, coated with a film of stationary phase, are distributed evenly over the wall of the column. They are suited to the analysis of volatile samples
- 21 - b) Mass Spectrometry (MIKES)
The mass spectrometer may be used as an efficient separation/ identification tool when coupled to data
reduction and library search computer facilities. The direct introduction of a complex mixture of volatile components into a MS, the use of computer controlled scanning and selected ion monitoring, has enabled the separation and identification of components [109], and the study of reactions and reaction mixtures [110,111]. The method is based on the mass-analysed ion kinetic energy spectrometer (MIKES) first described by Beynon et al in 1973 [112]. Sample preparation is minimal - in some cases none at all - and the technique is useful for structural elucidation. However, quantitation has been difficult to achieve [113] and further developments are required to make the technique amenable to routine work.
c) High Performance Liquid Chromatography
High performance liquid chromatography (HPLC) has not been widely used An the past as a separating method for volatile organic mixtures. However, recent advances in HPLC technology have made the technique comparable to GC in
speed, convenience and efficiency [114,115]. The chief
advantage of HPLC is the fact that milder solventrand thermal conditions may be employed for the separation of labile components that
may decompose under harsher GC temperatures. Precursers of many volatile components are labile and HPLC .could prove to
- 22 -
disadvantages of HPLC has been that the separation
efficiency of HPLC columns (approximately) 7,000 theoretical plates) has been a lot lower than the 120,000 theoretical plates of silica capillary GC columns. Recycling of the column effluent and the use of microbore columns can improve the resolution [116]. However, peak capacity is reduced and complex mixtures with a wide range of boiling points cannot . be effectively separated by this procedure.
HPLC has been widely used for the separation of polynuclear aromatic compounds in airborne particulate material [117], and to complement and extend the determination of this class of compounds in conjunction with GC techniques [118].
d) Miscellaneous Separation Techniques
Gel permeation chromatography [119] has been used for separation and molecular weight determination of labile substance of similar molecular size [120]. Hendrickson [121] referred to the method as "a new basic tool that could be called a liquid phase size spectrometer". However, this chromatography technique is applicable to compounds of high molecular weight and low volatility.
Liquid-liquid extraction systems are now available commercially as counter- current chromatography apparatus. Claims are made [127] that the method combines the benefits of countercurrent distribution apparatus and liquid
- 23 -
adsorption effects. Other liquid chromatography techniques such as droplet counter- current chromatography [122] have separation efficiencies close to that of GC, but also have limited applicability in trace volatile separations except where, as above, labile components are encountered.
Liquid-liquid fractionation techniques are frequently used as preliminary separation steps where complex mixtures of organic compounds are separated into various classes [123-125]. The combination of chemical information obtained by fractionation, GC and/or HPLC retention data coupled with spectroscopic information is usually sufficient to identify components of complex mixtures with reasonable certainty [126]. The disadvantages of fractionation methods of sample separation are twofold, involving the efficiency of
separation under slightly differing conditions, and problems concerning the formation of artifacts or the introduction of impurities. Many authours fail to provide data on these aspects of the technique [126].
Programmed multiple development chromatography (PMD) is a method of processing thin layer chromatography
-24 -
- 25- D. Detection and Analytical Techniques.
Trace volatile components eluted from a GC are usually identified according to the retention time compared to a standard under identical conditions. Incorrect
identification may result if several compounds elute at the same time, or if a massive amount of solvent alters
conditions in the column.
•The flame ionisation detector combines sensitivity and
versatility for trace compound detection. However a range of on-line spectroscopic detectors is available [133]; and the selectivity of the electron capture [134] and flame photometric
[135] detector
is widely utilised. Development of a helium microwave emission detector [136-138] hasenabled the determination of trihalomethanes in 10 ml of drinking water to levels of 1 part per billion [139].
The most powerful combination for separation, structural determination and quantitation is thecapillary GC/MS - computer system
[21], [91
-92],
[140-144]. This combination is capable of the separation and identification of complex mixtures of volatile organic materials in a variety of matrices [145-146]. The data processing capability allows the storage, retrieval and tentative identification of several hundred component peaks of a complex mixture [147-148], [149-150].. SO Scan
Number rnis
Individual "t
Mass -251
Chromatograms Reconstituted
Mass Spectra 4.5
1St
ORIGINAL GAS CHROMATOGRAM
LS
Mass Reconstituted Gas Chromatogram
Scan Number • 7.
- 26 -
contributions from column and septum bleed that would
otherwise distort the relative intensities of ions in the
mass spectrum [151-153]. The resolving effect relies upon
the distinction between the MS parent ion peaks, which may
be detected even though the original GC peaks were
over-lapping (see Figure V). Usually 5-10 mass spectra can be
collected per GC peak and this provides enough information
for processing and reconstruction of a resolved mass
chromatogram.
- 27 -
Sweeley and co-workers have developed methods for separating complex mixtures using computer programs to control repetitive scanning and selected ion monitoring [154]. They have developed a system that incorporates the use of retention indices with off-line reverse library searching of selected mass chromatograms from repetitive scanning of the GC/MS of complex mixtures. Observed
precision of retention index was 0.2 percent and lower limit of detection lOng. The GC/MS precision was 8 percent within duplicate detection of the same sample and the linear range for quantitative ananlyses was 1,000 fold [155].
The most significant, advance in techniques in this field have been the combined utilisation of the developments of splitless sample injection, the preparation [156], and evaluation [157] of the operation and performance of WCOT columns, open split injection [158] and direct connection of the GC capillary to the ion source of the mass spectrometer.
Other detection and analysis techniques for monitoring volatile components include; Fourier transform spectroscopy [159-161] using folded path optics for the measurement of 10 ppb levels of hydrocarbon and other species; infrared
spectrometry coupled with microprocessor control [162], chemiluminescence [163] as well as a variety of laser based
systems [164-165].
- 28 -
recently shown to be effective in some applications where mass spectral techniques are inadequate [167].
Ancillary techniques, or modified computer search methods, need to be utilised if positive identification of some components is required. Comparison of published mass spectra of terpenes [168], for example, indicate that structurally different terpenes such as tricyclene, alpha-pinene, and 3-carene show differences only in ion .
intensities of the principle ion peaks with identical mass. These differences are often within the normal operational variables if there are other contributing factors such as GC column bleed or incomplete peak resolution and hence,
unequivocal identification by mass spectral means alone is not possible [169].
So rapid are the changes in GC/MS - data system
- 29 -
E. Sources of Error in Trace Volatile Analysis.
Many organic compounds present in air and water are labile and the method of sampling will influence the qualitative and quantitative result of any analytical
programme. The use of complementary techniques for sampling and analysis and the choice of conditions that tend to keep • decomposition and rearrangements to a minimum should be
utilised wherever possible. Contamination of a sample at any stage of the collection analysis chain may lead to false assumptions and costly errors. A well documented example was the contamination of lunar rock samples [173-175] and the difficulty in establishing if the substance measured was a contaminant or otherwise.
An accurate measurement has been defined [176] as a precise numerical value that is free of, or corrected for, all systematic errors. In order to attain such a result, all aspects of sample collection, storage, extraction, concentration, isolation, identification, and quantitation must be examined. Lewis [177] has discussed some of these problems with special emphasis on trace organic analysis.
The correct choice of sampling method to ensure a respresentative sample depends on factors such as
representative volumes, times and avoidance of contamination by the sample collection and analysis method. Each
- 30 -
temperature of 0 deg.0 or less should be chosen to minimise effects of photo- decomposition, microbiological action, and chemical interaction between components and container [178].
During the extraction of volatile components from air and water, contamination and losses may occur from a number of sources; solvents and solid extraction systems contain impurities, and extraction efficiencies are often
considerably less than and extraction efficiencies are often 100 percent, especially where a wide range of compound types are involved. If a solvent extraction procedure is employed the components in the solvent may require concentration
prior to analysis. Loss of volatile components and reaction of labile compounds often occurs as a result of this step. The use of Kuderna-Danish concentrator [179] can help to minimise the loss of volatiles provided care is taken in heating and the choice of solvent. Concentration to approximately 50 microlitres is possible with a
micro-Kuderna-Danish concentrator. XAD and Tenax resins are also used to concentrate components as outlined previously, however volatile losses may also be significant using this technique and should be monitored where possible.
Problems with isolation of individual components involving rearrangements, irreversible adsorption, decomposition and incomplete separation are common to chromatographic and MS methods. Optimisation of
-31 -
Identification of a component by comparison with properties of a previously measured known compound may be extremely difficult where complex mixtures of trace organic materials are to be analysed e.g. drug, food and plant and pesticide breakdown products. Pure standards for these compounds are often not available to allow addition techniques to be employed for positive identification.
Combined GC/MS systems employing internal standards incorporating carbon 14 have been extensively utilised [180] as an internal quality control system. Addition of an isotope labelled labelled compound is an effective method for the determination of losses of components during subsequent extraction, concentration and isolation steps. Isotope labelling cannot, however, be undertaken for each component in a complex mixture and differences in chemical nature between compounds can cause variations in recoveries. One compound of each class likely to be present should be selected to check on recoveries through the system.
A variety of methods have been employed to assess accuracy in trace organic analysis [178]. These include collaborative laboratory studies, analysis of spiked samples and inter-laboratory comparisons [181]. Many of these
studies have shown the need for more extensive in-laboratory quality control checks, and the necessity for the
-32 -
CHAPTER III
,DEVELOPMENT OF A SAMPLING SYSTEM FOR VOLATILE ORGANIC MIXTURES.
Introduction.
A simple method of sampling volatile compounds from a variety of sources is required in many applied areas of chemistry. The detection and analysis for example, of volatile solvents in paint spraying industries, odour
tracing in environmental problem areas, and plant volatiles for the perfume and flavour indistries are some typical examples where the use of a rapid routine method of
collection and analysis of volatile compounds would be of advantage.
Ideally a sampling system should be capable of trapping quantitatively and reproducably a wide range of chemical compounds in sufficient quantity to give an accurate analytical assessment. The trapping method should not degrade or alter the collected components on collection, storage or elution. The above properties of a trapping system are often difficult to effectively check,
particularly in the case of complex mixture trapping. Upon • adsorption, there is a possibility of chemical reaction
between the components trapped, due to the higher
- 33 -
-34 -
A. Selection of a Sample Adsorption Medium.
(i) Carbon,
The efficiency of carbon as a trapping material in the form of 25mg charcoal disks, as demonstrated by Grob [21], prompted the investigation of this material as a trapping medium for the collection of organics from ambient and contaminated air. Difficulties encountered involved the manufacture of a consistant porous charcoal filter that was mechanically rigid enough to withstand the force of the air passing through the structure. The original commercial disks as described by Grob were not readily available. Various modifications of a dye press were tried and varying amounts of heat were applied to the carbon in order to obtain a consistant useable product - without a great deal of success.
Crushed granular carbon (activated charcoal) from B.D.H. Ltd. U.K., "Special for Gas Adsorption", of two screen sizes was cleaned by Soxhlet extraction with methanol and
dichloromethane as solvents. Each size fraction was packed into 9mm diameter by 95mm long glass tubes with a 310 cone at one end and held in position by glass wool plugs at the ends. Material similar to this is extensively utilised for removing organics from air in gas masks[190].
Recovery checks on a range of compounds yielded the information in Table III. The test compounds were
- 35 -
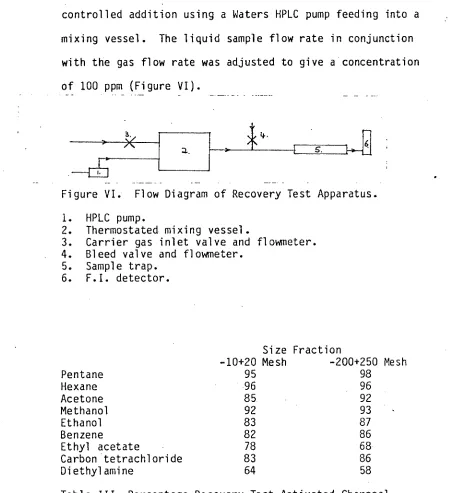
controlled addition using a Waters HPLC pump feeding into a
mixing vessel. The liquid sample flow rate in conjunction
with the gas flow rate was adjusted to give a concentration
of 100 p m (Figure VI).
1
hiFigure VI. Flow Diagram of Recovery Test Apparatus.
1. HPLC pump.
2. Thermostated mixing vessel.
3. Carrier gas inlet valve and flowmeter. 4. Bleed valve and flowmeter.
5. Sample trap. 6. F.I. detector.
Size Fraction
-10+20 Mesh -200+250 Mesh
Pentane 95 98
Hexane 96 96
Acetone 85 92
Methanol 92 93
Ethanol 83 87
Benzene 82 86
Ethyl acetate 78 68
Carbon tetrachloride 83 86
[image:42.557.34.494.81.574.2]Diethylamine 64 58
Table III. Percentage Recovery Test Activated Charcoal Adsorbent. Test Compounds at a Concentration of 100ppm.
The flame ionisation detector of the GC was used to
determine the breakthrough of the test compound and the
sample tube was then removed for solvent extraction and
recovery. A second recovery check was made by adding one
microliter of the steam distillate of Pinus radiata to the
- 36 -
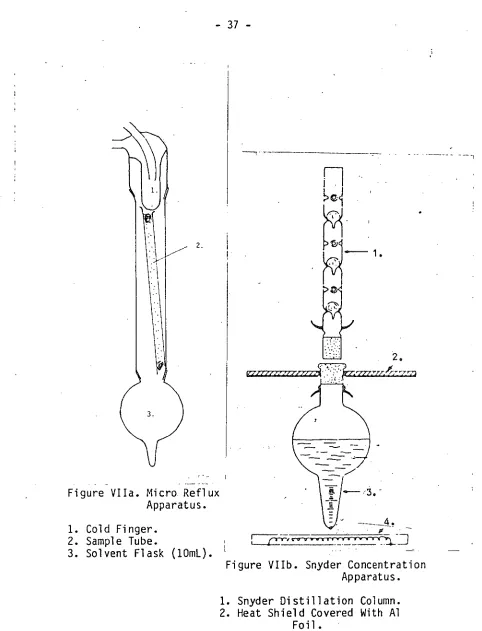
carbon disulphide. Extraction from the activated charcoal was accomplished by refluxing 5mL of carbon disulphide using a cold finger apparatus as shown in Figure VI. The small volume refluxing through the trap reduced the
concentration of the impurities upon solvent reduction in the micro Snyder distillation (Figure VII). An internal standard of n-decane was added to the carbon disulphide at the completion of the extraction to enable allowances for some of the losses likely to take place during the solvent reduction step in the concentration apparatus.
2.
Figure VIIa. Micro Reflux Apparatus.
1. Cold Finger. 2. Sample Tube.
3. Solvent Flask (10mL).
. 2.
Figure VIIb. Snyder Concentration Apparatus. -37 -
1. Snyder Distillation Column. 2. Heat Shield Covered With Al
Foil.
- 38 -
ii) Tenax GC
Tenax-GC has been widely utilised for the concentration of trace organic compounds in air as described in the
previous chapter. Tenax (poly-p-2,4-diphenylphenylenoxide) has the structure shown in Figure VIII and the manufacturers claim it is stable up to temperatures of 350 deg.C.
Figure VIII. Chemical Structure of Tenax GC.
The thermal stability and hydrophobic nature of the material coupled with the ability to trap a wide range of organic compounds would appear to make Tenax a favourable choice as an adsorbant.
Tenax was prepared by conditioning overnight at 325 deg.0 in a wide bore glass tube in a stream of high purity nitrogen. The packing was stored in capped glass containers prior to packing in sample tubes and then reconditioned at 275 deg.0 before use.
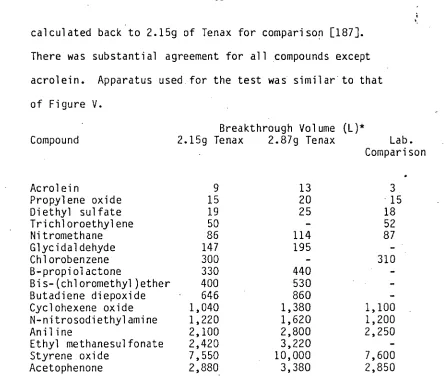
Recovery Checks. Pellizzari et al [63], have recorded the breakthrough volumes of a number of volatile organic compounds. Checks were made on many of the figures
- 39 -
calculated back to 2.15g of Tenax for comparison [187]. There was substantial agreement for all compounds except acrolein. Apparatus used for the test was similar to that of Figure V.
Breakthrough Volume (L)*
Compound 2.159 Tenax 2.87g Tenax Lab. Comparison
Acrolein 9 13 3
Propylene oxide 15 20 15
Diethyl sulfate 19 25 18
Trichloroethylene 50 - 52
Nitromethane 86 114 87
Glycidaldehyde 147 195 -
Chlorobenzene 300 - 310
B-propiolactone 330 440
Bis-(chloromethyl)ether 400 530
Butadiene diepoxide 646 860
Cyclohexene oxide 1,040 1,380 1,100
N-nitrosodiethylamine 1,220 1,620 1,200
Aniline 2,100 2,800 2,250
Ethyl methanesulfonate 2,420 3,220 -
Styrene oxide 7,550 10,000 7,600
Acetophenone 2,880 3,380 2,850
[image:46.557.64.509.81.467.2]*Volume required to elute one-half of adsorbed vapour at 25 deg.C.
Table IV. Breakthrough Volumes for Several Highly Volatile Compounds on Tenax GC (40/60 Mesh) Cartridges
- 40 -
B. Development of Sample Collection and Desorption Equipment. i) Sample Collection
Optimum sample collection efficiency is dependent on factors such as gas flow rate, rate of diffusion of sorbate into the pores, particle size and shape, bed geometry,
porosity and temperature [187]. The geometry of the sample collection tube was limited by mechanical aspects of the desorption apparatus as well as theoretical considerations.
The equipment used to collect volatile organics from air samples consisted of:- 1. a Pyrex glass or metal tube packed centrally with 40-60 mesh Tenax held in position with
silanised glass wool. The weight of Tenax per sample tube was 0.40g. 2. A calibrated flowmeter measured the rate of gas passing through the sample tube. 3. An electrically driven diaphragm pump was used to draw the gas through the system (Figure IX).
• . •
3.. Figure IX. Flow Diagram of Apparatus for Sampling of
Volatile Organic Compounds.
1. Glass Tenax trap. 2. Calibrated Flowmeter. 3. Diaphragm pump.
- 41 -
ii) Sample Desorption
The requirements for thermal desorption and injection of the sample into a GC include quantitative removal of the sample from the collection medium, and rapid injection of the vapour into the inlet of the GC without bleed during secondary trapping.
A trapping system described by Houghton [189] and illustrated in Figure X, was constructed with some
modifications. A luer adapter was silver soldered onto a 6mm Swagelock fitting to allow the connection of a syringe needle to the metal sample tube using a compression Graphlok seal. The equipment consists of a heating coil mounted on two metal formers with a gap between to allow the insertion of hot or cold metal probes [190]._
A
El Glass Wool Coated Packing
ari Asbestos Jacket Yi.j: Asbestos Tape
• Nichrome Wire
-7-Figure X. Initial Thermal 'Desorption Apparatus
[190].
(A) .Stainless-steel collection tube; (B) cross section of the collection-tube heater with tube in position.
The sample tube was partially inserted into the
- 42 -
the septum of the GC. The carrier gas line was attached by a second Swagelok fitting to the other end of the sample trap. Heat was applied to the tube by the passage of an electric current through the heater windings and the application of a liquid nitrogen cooled trap prevented the passage of the components into the GC. When the system
reached a steady temperature of 200 deg.0 the cold probe was • removed and a hot probe placed in the same position. The
carrier gas from the GC at the same time being diverted through the sample tube to flush the components into the GC.
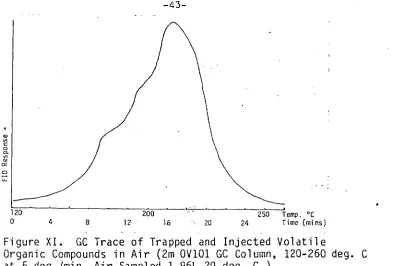
The system was found to function efficiently for a single component in air samples and was very good for isolating single peaks from a GC run. (This was
accomplished using a heated column switching valve to divert the carrier gas flow from the FID to the trap at the
FID
Resp
on
se
•
20
0 4 8 12 16 200 20 24 Time (mins) 250 Temp. °C
[image:50.557.94.487.54.320.2]-43-
Figure XI. GC Trace of Trapped and Injected Volatile
Organic Compounds in Air (2m OV101 GC Column, 120-260 deg. C at 5 deg./min. Air Sampled 1.96L 20 deg. C )
The problem with the technique appeared to be the
inefficient transfer of heat to the sample tube resulting in lack of resolution on the analytical column. A variety of columns, including capillary columns, were used but with no major improvement in resolving power.
Redesign of the system to give better heat transfer and improved cold trapping appeared to be necessary. The heating block was constructed to enable continuous desorption of the organic compounds as heat was applied, and flushing of the components by the carrier gas stream to a cold trap
- 44 -
"2-
Figure XII. Thermal Desorption and Injection Apparatus. 1. 2mm Swagelock Fitting - carrier gas inlet. 2. Tenax Sample Tube.
3. Resistance Wire Round S. Steel Heating Block. 4. 6mm Swagelock Coupling and Electrical Connector. 5. 3m GLT.
6. Electrical Connector and Coupling to GC inlet. 7. GC Column.
A diagram of the equipment is shown in Figure XII. The apparatus consists of a 25mm diameter stainless steel cylinder (2), drilled through the centre to accept a 170mm by 6mm sample collection tube, and off-center to accept a thermocouple probe. The metal cylinder was covered with a heating element consisting of 7.2m of 1.779 ohm/m in a
- 45 -
to the stainless steel. Gas sealing by a Graphlok ferrule (4), also prevented the tube from being ejected as did the coupling of the 3mm diamter glass lined metal U tube (5). At each end of the U tube brass lugs were attached to provide electrical connections for coupling to a welding transformer. A number of different configurations of glass lined metal U tube were manufactured, the use depending upon the configuration of the inlet system of the GC or GC/MS unit. A horizontal version with a luer fitting and a 20 guage needle was frequently used. The system illustrated shows the 3m glass lined tubing (GLT) coupled directly to a piece of 6mm GLT inserted into the inlet heater of the
GC/MS.
-46 -
of GLT where secondary trapping (condensation) concentrated the material.
Rapid injection of the organic mixture onto the GC column involved resistance heating of the 3mm GLT by
connecting the secondary output from a welding transformer across the two lugs, at points 5 and 6, immediately after the removal of the liquid nitrogen bath. A current setting of 40A applied for 30 seconds rapidly heated the GLT to a maximum temperature of 300 deg.C, at a rate that ensured breakage of the tubing did not occur.
Following a number of field trials, where mechanical breakage of glass sample trap tubes had occured, the decision was made to replace the glass with glass lined stainless steel tubing of the same dimensions. The added mechanical strength of the GLT also was an advantage in the desorption apparatus where coupling of the 3mm U tube to the desorption system had often placed an unacceptable degree of strain on the glass tube. Heat transfer to the packing from the heating block was also improved.
-47 -
C. Blank Determinations and Sample Trap Storage.
•
Introduction.
An important aspect of the sampling of trace volatile organic compounds is the requirement to reduce the risk of contamination of the collected sample. Contamination may occur in a number of ways; from degradation of the
collecting material, from breakdown of the collected components so that there is no resemblance to the original sample; or, the ingress of chemicals, such as solvent - vapours, from the handling or laboratory.
A number of instances occurred, in the course of the investigations that are documented in the following pages, where solvents such as chloroform and 'Freon' were detected in collected air samples that should have been free of such components. The steps that were followed to reduce the contamination that tended to result from working in a general purpose organic laboratory are described. Experimental.
Tests were conducted on the desorption efficiency at 250 deg.0 and 300 deg.0 on portions of Tenax that had been
previously used fbr trapping terpene volatiles. One tube was initially conditioned at 250 deg.0 for 60 minutes in a stream of high purity nitrogen, and the other was
conditioned at 300 deg.0 under similar conditions. Each sample tube was then placed in the stainless steel
- 48 -
ten minutes and the eluted 'blank' run through the GC/MS system. An OV101 WCOT 50m silica.column was used to
separate the components prior to entry into the MS system. The GC/MS conditions are set out below:
Figure numbers XIII, XIV.
Carrier gas - hydrogen at 1.5 mL/min Temperature range 50-220 deg.0
Vacuum 10-6
Torr. 4 deg./min to scan 350 then 8 deg/min
253247
311
4
3PS
288 ege GEO 689 740
Csi7 19311 12321 16312C 29:21 22343 tea
a:ItS
GS2
SG G 9
•-•
- 49 -
Figure XIII. Total Ion Current Trace Tenax Sample Tube
Conditioned at 250 deg. C.
---r- r- •
a I 2aa 229 489 Gee CO9 700
0:0 212S 01i7 12:20 12:22 IC: :18 22:44
- 50-
Scan No. Component 43 carbon dioxide
44 carbon dioxide plus unknown HC M. Wt 96
86 toluene
102 chloroethylene 176 monoterpene 204 monoterpene 206 monoterpene.
215 trimethyl benzene isomer 229 monoterpene
242 monoterpene M. Wt 134 249 monoterpene M. Wt 136 253 monoterpene
272 monoterpene 301 unknown 314 hydrocarbon
327 undecane - C11 hydrocarbon 364 menthofuran M. Wt 150 391 myrtenal
406 unknown - possibly a terpene 415 dodecane M. Wt 170
Table V. Compounds Eluted from Tenax Sample Tube Conditioned at 250 deg.C.
Scan No. Component 44 carbon dioxide
249-270 unresolved mixture of trace quantities of unknown mixture
451 unsaturated C10 aldehyde
516 decenal
539-585 unknown, mixture
598 trimethyl naphthalene
619 unknown mixture containing one branched HC 647 unknown ketone
649 heptadecene M. Wt 238 652 heptadecane M. Wt 240
655 branched HC - weak parent ion 679 octadecene M. Wt 252
682 octadecane M. Wt 254 712 nonadecane? or ecosane?
732 palmitic acid (carboxylid acid peaks 60 & 73) Table VI. Compounds Eluted from Tenax Sample Tube
- 51 -
Discussion.
The results indicate that quantitative desorption does not occur when the Tenax sample tube is heated to 250 deg.0 for trapped terpene components. The traces obtained
indicate that either a higher conditioning temperature, or, a longer conditioning time is required to reduce the blank contamination carry over level. Higher desorption
temperatures should improve the initial recovery percentage, simultaneously reducing the conditioning required provided that unacceptable levels of thermal breakdown products are not generated. Desorption temperatures of 270 deg.0 and 290 deg.0 were used by Pellizzari
[56]
and Bertsch [19] for recovery of components adsorbed onto Tenax.A paper by a research group of the U.S. Air Force [192] lists benzene as a major thermal breakdown product of Tenax and as a result use a conditioning and desorption
- 52-
tendency to form large visible voids unless the packing was preconditioned in the above manner. Presumably the above authors did not precondition at a temperature higher than 240 deg.0 and this may account for the continual loss of benzene. At a desorption temperature of 240 deg.0
quantitation of components would also be somewhat difficult, unless, a range of internal standards was added to the
original sample to enable collection efficiencies to be calculated.
Conclusions.
Air sampling of volatile organic compounds by the use of a Tenax sample tube should be undertaken with due regard to the possible effects of conditioning temperature and time. Care should be exercised in the initial preconditioning of the packing material. A blank run should be conducted on the tube prior to dispatch to the sampling area and a similar blank tube should accompany the sample tubes. Sample tubes should be stored individually in glass stoppered carrying containers with a small quantity of dried silica gel. Where possible Tenax sample tubes should be allocated to one particular sample type; i.e. one set of tubes for ambient air monitoring, one set for volatile terpenes etc.
% In
ten
s
it
. tim'aMnV3.
Explanatory Diagram of MS Total Ion Current Trace. - 53 -
for field sampling. The procedure adopted to reduce cross contamination of sample collection tubes involved the following: the GLT was baked in a furnace at 600 deg.C, packed with the preconditioned Tenax, and reconditioned at 300 deg.0 immediately before despatch to the sampling point in glass stoppered tubes. The sample trap could be stored for up to two weeks in a cool room without loss of sample, however processing was generally undertaken as soon as possible following collection of the sample.
Note. Interpretation of MS total ion current trace.
The information from the ion current scans is stored in the data system and the output intensity is
calculated relative to 100 percent of the highest peak - unless overloading occurs. The output trace is percentage intensity (vertical axis) vs scan number with time in decimal minutes printed below (horizontal axis). Prominant peaks are labelled with the
- 54 - CHAPTER IV
AN EXPERIMENTAL COMPARISON OF VOLATILE ORGANIC SAMPLING TECHNIQUES.
Introduction.
Exposure to mixtures of volatile organic components has become an accepted part of normal living experiences and little attention is paid to various odours unless they are particularly obnoxious or dangerous. Irritant effects at low concentration in the air of working environments can be tolerated with some compounds but not with others.
Assistance with the qualitative determination of an irritant that was present in-the atmosphere surrounding a furnace was requested from industry. The persistant, mildly lachrimatory, eye irritant nature of the substance made working conditions in the vicinity of the furnace
particularly unpleasant. Conventional methods of detecting the compound type, i.e. by use of commercially available gas detection equipment (Draager Tubes etc.) had failed.
This request provided an ideal case study to compare four different sampling and concentration techniques:-
a) Direct gas sample collection in a Teflon bag b) Solvent adsorption
, c) Cryogenic trapping
- 55 - A. Experimental
The furnace consisted of a rotating steel drum heated to 180 deg.0 by a liquified petroleum gas flame. Modifications had been made to the burner upon the recent installation of the unit. Heat loss from the gas flame was minimised by three different types of thermal insulation that were placed on the inside of the support structure adjacent to the flame • area. Hot air from the flame jet rose around the outside of the rotating furnace and was conveyed by a duct to the
outside of the building. Round the front of the rotating drum of the furnace was a rubber flap to minimise heat loss, however, a certain amount of hot gas escaped at this point and thus carried quantities of the irritating component into the atmosphere of the room. (Figure XVa) Considerable
discomfort caused by irritation of the face skin, and lachimatory action to the eyes, occured whilst sampling the hot gas stream. The effect was somewhat similar to that of low concentrations of acetyl chloride.
Figure XVa. Front Elevation of Furnace.
- 56-
i) Sampling
All glassware used was cleaned by washing with
detergent, rinsed with distilled water and then heated to 600 deg.0 in a furnace. The solvent used was redistilled AR. dichloromethane, and where direct adsorption was not
possible Teflon tubing was used to convey the gases.
a) Direct Gas Sampling
Gases escaping through the top of the rubber seal round the drum of the furnace were sampled directly into a 300 x 300 mm Teflon gas ample bag and the bag sealed with a Teflon faced septum. This was accomplished by placing the empty Teflon bag into a 20L plastic barrel with the inlet of the bag projecting through the lid of the barrel. Air was withdrawn from the barrel. The resulting decrease in pressure expanded the bag inside the barrel and allowed the collection of several litres of sample.
b) Solvent Adsorption
- 57 -
c) Cryogenic Trapping
A sample of the gas mixture was drawn through a glass U tube immersed in liquid nitrogen within a Dewar flask to condense volatile material. The U tube was washed out with dichloromethane at frequent intervals to ensure that as much as possible of the condensed organic material was retained. The volume of gas mixture sampled was 20L. Problems
encountered included frequent ice buildup in the U tube resulting in blockage of the flow line, and the difficulty of disconnecting and reconnecting tubing that was rigid at the low temperature.
d) Tenax Sample Tube
Gases emanating from the furnace were at a temperature in excess of one hundred degrees, therefore, in order to retain volatile components on the Tenax sample tube, a method of cooling was required. This was accomplished by
inserting the sample collecting tube into a water jacketed length of 8mm diamter copper tube surrounded by a cooling water jacket (Figure XVb). The temperature of the glass Tenax tube was therefore maintained at less than twenty degrees enabling the adsorption of low boiling point
-5 8-
dor
mammumar umwm. ammairmamnrAmmaci•
• • tf
• / /
5. _
Figure XVb. Water Cooled Sample Collection Probe (Cross-section).
1. Tenax sample tube. 2. Hot gaseous sample in. 3. Cooled gas out. 4. Cooling water inlet. 5. Cooling water •outlet. __6. Cooling water jacket.
7. 6mm Swagelok coupling. 8. Aluminium foil wrapped over fiber glass insulation.
The inlet of the Tenax sample tube, in the water cooled
jacket, was suspended above the furnace adjacent to the
rubber seal. A flow rate of 50mL per minute was maintained
through the sample tube for two hours.
ii) Analytical results
Analytical work on the collected samples was undertaken
using packed columns on the GC and capillary columns on the
GC/MS runs. Sample pretreatment of the solvent collected
samples consisted of careful evaporation under a controlled
stream of high purity nitrogen gas at 30 deg.C.
a) Direct Gas Sampling
A 2.0mL portion of the gas sample was injected onto a
packed GC column (3 percent Dexil 300 on 100-120 mesh
Chromosorb W HP). A gas tight syringe was used to transfer
the sample to the 2m column maintained isothermally at 50
deg.C. On maximum sensitivity only one minor multiple peak
of retention time 0.50 seconds was noted. This was
identified by GC/MS as air with a trace amount of propane.
- 59 - Solvent Adsorption Sample
The 200mL volume of dichloromethane solvent was reduced to 100 microlitres by careful evaporation under a stream of dry nitrogen. Water traces were removed by passing the liquid through a small column of anhydrous sodium sulphate, and samples were stored in small volume glass vials with Teflon seals. An equivalent volume of the distilled
dichloromethane was treated in a similar manner to provide a blank. Injection of 1.0 microlitre portions of sample onto the Dexil 300 packed column, described above, gave a GC trace with a large solvent peak with a number of shoulder
peaks. Trace amounts of other compounds were observed, however the blank solvent run provided a very similar trace, indicating the presence of solvent impurities. A high resolution 55m OV101 SCOT colUmn was installed in the GC mass spectrometer system to enable separation and, where
possible, identification of the components. 0.5 microlitre of sample was injected onto the column in a Grob type
- 60 - Gas chromatograph: Pye series 204
Column: OV101 SCOT 55m glass 0.5mm dia Carried gas: He at 1.0 mL/min.
Temperatures(deg.C): Inlet 225, outlet 250, interface 250 Oven programme: Ambient, then 50 deg. to 200 deg,
2 deg/min to scan 375 then 8 deg/min. Mass Spectrometer: VG Micromass 7070F
Scan rate 1 per 2.5 seconds. Energy 70Ev.' Data System: VG 2235 using a PDP 8/A620 minicomputer.
Table VII. GC/MS Operating Conditions
1 483157 te trac hlor oe thy le ne 9. c hlor o form 3. •
a IVO ZOO 228 480
423.21
01 0 111 8.1 1210 . 1C.3 ZOI1 Z3.0 7V0 r7:
tr ic h lo roe thy le ne 6. 1 8 dic hlorome t hane 1. tr ic h loro e t hane 4. C.N1 00 L. C 00 "OW 37 -61 -
Figure XVI. TIC Trace Dichloromethane Blank OV101 Capillary Col. 50-200 deg. C. (Conditions as per Table VII.)
Peak No. Scan No. Identity
1 75-90 dichloromethane
2 97 dichloroethylene
3 121 chloroform
4 143 1,1,1 trichloroethane
5 162 cyclohexane
6 188 trichloroethylene
7 234 4 methyl 2 pentanone
8 276 toluene
9 352 tetrachloroethylene
10 432 ethyl benzene
11 444 xylene
0 0 _c 1, 1, 1 tr ic h loroe thane 4. 1SS c hlor o fo rm
3. 13
' 1363315
La
hep
tan
al iso
mer
17.
1
2.40 288
3:i2 11:13
r
228 Z 488 440 488 17:S8 14:88 isto - 2711-5 13:13
- 62 -
o af,,,--,--77"-77-NT i1 1---T----1 — I-- 0 1-0 m Ira iss zem 0:2 1:33 2315 4:52 clas 87
Figure XVII. TIC Trace of Solvent Trap Volatiles OV101 Capillary Col.. Conditions as per Table VII.
Peak No. Scan No. Identity
1 74-88 dichloromethane* 2 93 dichloroethylene* 3 117 chloroform*
4 139 1,1,1 trichloroethane* 5 150 benzene
6 159 cyclohexane*
7 177 1,2 dichloropropane 8 185 trichloroethylene* 9 228 4 methyl 2 pentanone* 10 258 toluene*
11 284 4 methyl pentanal (?) 12 296 tetrachloroethylene* 13 332 ethyl benzene*
14 337 )
15 350 ) 0,m and p xylene* 16 362 )
17 378 heptanal isomer
18 404 octanal
19 411 n-decane
Table IX. Components Identified in Solvent Trap Concentrate.
![Figure I. Schematic Diagram of a Preconcentration and Analytical System [12].](https://thumb-us.123doks.com/thumbv2/123dok_us/8481592.342647/11.557.60.487.47.667/figure-i-schematic-diagram-preconcentration-analytical.webp)
![Table I. A Comparison of the Physical Properties of Some Porous Polymers [53].](https://thumb-us.123doks.com/thumbv2/123dok_us/8481592.342647/15.557.66.546.156.606/table-i-comparison-physical-properties-porous-polymers.webp)
![Figure IV. Two Column GC System - Packed and Capillary with Valve Switching [102].](https://thumb-us.123doks.com/thumbv2/123dok_us/8481592.342647/26.557.54.515.28.823/figure-iv-column-gc-packed-capillary-valve-switching.webp)