A transient PEMFC model with CO poisoning and mitigation by
O
2
bleeding and Ru-containing catalyst
A.A. Shah
a,∗, P.C. Sui
b, G.-S. Kim
c, S. Ye
caQueen’s, RMC Fuel Cell Research Centre, 945 Princess Street, Kingston, Ont. K7L 5L9, Canada bInstitute for Integrated Energy Systems, University of Victoria, Victoria, BC V8W 3P6, Canada
cBallard Power Systems, 4343 North Fraser Way, Burnaby, BC V5J 5J9, Canada
Received 5 December 2006; received in revised form 31 December 2006; accepted 2 January 2007 Available online 17 January 2007
Abstract
In this paper we present a transient, fully two-phase, non-isothermal model of carbon monoxide poisoning and oxygen bleeding in the membrane electrode assembly of a polymer electrolyte fuel cell. The model includes a detailed description of mass, heat and charge transport, chemisorption, electrochemical oxidation and heterogeneous catalysis (when oxygen is introduced). Example simulation results demonstrate the ability of the model to qualitatively capture the fundamental features of the poisoning process and the extent of poisoning with respect to channel temperature and concentration. Further examples show how the multi-step kinetics can interact with other physical phenomena such as liquid-water flooding, particularly in the anode. Carbon monoxide pulsing is simulated to demonstrate that the complicated reaction kinetics of oxygen bleeding can be captured and even predicted. It is shown that variations in the channel temperature have a convoluted effect on bleeding, and that trends in performance on relatively short time scales can be the precise opposite of the trends observed at steady state. We incorporate a bi-functional mechanism for carbon monoxide oxidation on platinum–ruthenium catalysts, demonstrating the marked reduction in the extent of poisoning, the effect of variations in the platinum–ruthenium ratio and the influence of temperature. Finally, we discuss the implications of the results, extensions to the model and possible avenues for experimental work.
© 2007 Published by Elsevier B.V.
Keywords: Transient model; Two-phase; CO poisoning; Oxygen bleeding; Platinum–ruthenium
1. Introduction
The proton exchange membrane fuel cell (PEMFC) is an emerging source of clean and efficient energy, particularly for application in the automotive industry. In a basic description of the PEMFC hydrogen (H2) is electro-oxidated at the anode pro-ducing protons and electrons, with simultaneous oxygen (O2) reduction at the cathode from the protons migrating through the membrane and the electrons entering through an external circuit. The net product is simply water. The reactants are deliv-ered through a carbon paper, known as the gas diffusion layer (GDL), and reaction takes place in catalyst layers (CL) on either of the membrane—the catalyst in question being platinum (Pt). The unit comprising GDL, CL and membrane is termed the membrane electrode assembly (MEA).
∗Corresponding author. Tel.: +1 778 288 4292; fax: +1 604 268 6657.
E-mail address:[email protected](A.A. Shah).
However, there are several factors that complicate a practical implementation, notably flooding of the CL (restricted ingress of reactants), membrane drying (decreased protonic conductiv-ity), inefficient use of the Pt (reaction can only occur at points of contact between the Pt, carbon and electrolyte) and degra-dation, through, for example, radical attack of the membrane, carbon monoxide (CO) poisoning, Pt dissolution and carbon corrosion. These factors are in turn influenced by the proper-ties of the several components of the cell and the conditions under which the cell is operated, for example relative humidity, temperature and fuel composition. In order for the protons gen-erated at the anode to reach the cathode freely the membrane must remain well hydrated. The GDL must facilitate efficient delivery of the reactants from the channels to the CL, but, at the same time, must be sufficiently hydrophobic to expel any build-up of liquid-water, without compromising the hydration level of the membrane. These issues are a selection of those that have formed the focus of modelling studies of PEMFC. The
Nomenclature
a specific surface area of Pt (m−1) aw water activity
A specific surface area of agglomerates (m−1) bads desorption coefficient (mol m−3)
C molar concentration or specific heat capacity (mol m−3or J kg−1K−1)
d mean pore diameter (m)
D diffusion coefficient (m2s−1)
Eads activation energy (adsorption) (J mol−1) Eox activation energy (oxidation) (J mol−1) E0 open circuit voltage (V)
F Faraday’s constant (C mol−1)
h mass transfer coefficient (s−1)
H Henry’s constant or Heaviside function
i exchange current density (A m−2)
J Leverette function
k thermal conductivity (W m−1K−1) kads adsorption coefficient (m s−1)
kox electro-chemical oxidation rate (mol m−2s−1)
L thickness (m orm)
m loading (kg m−2)
N agglomerate density (m−3)
p liquid pressure (Pa)
P gas pressure (Pa)
q surface reaction rate (mol m−2s−1)
r interaction parameter (J mol−1)
R universal gas constant (J mol−1K−1) Ra agglomerate radius (m)
RO ORR rate (mol m−3s−1)
s saturation
S source/sink (mol m−3s−1or W m−3or A m−3)
t time (s)
T temperature (K) v velocity (m s−1) Vcell cell voltage (V)
W molar mass (kg mol−1)
x distance (m orm)
X molar fraction
Greek letters
α transfer coefficient β symmetry factor
γ diffusion rate through films (s−1) δ film thickness (m orm) entropy (J mol−1K−1) volume fraction η overpotential (V)
θ contact angle or surface coverage (◦or−) κ absolute permeability (m2)
κaandκd adsorption and desorption coefficients (m s−1) λ membrane water content
μ dynamic viscosity (kg m−1s−1)
ν fixed charge site concentration (mol m−3) ρ density or molar area density (kg m−3kg m−2)
σ conductivity (S m−1) σ surface tension (N m−1) φ potential (V)
water removal constant (m−1)
Subscripts
a agglomerate or anode or adsorption ads adsorption
b backward (reaction)
c cathode or capillary or CCL or condensation
CO CO
d dissolved or desorption e electrolyte
g GDL or gas
H H2
k forward (rate constants) l liquid
M free site (Pt/Ru)
N N2
ox oxidation
O O2
p pore space pt platinum r reaction ref reference Ru ruthenium s solid or electronic T total value
v vapour
w water
0 reference
Superscripts
c CCL
CO CO
CO O CO oxidation
f film
g GDL
H H2
H O H2oxidation
O O2
s surface
* equilibrium value − boundary/initial value
vast majority of models are steady-state, despite the obvious transient nature of cell operation (performance) in automobile applications. Degradation phenomena are also transient, impact-ing performance on a long time scale, such as carbon corrosion and Pt dissolution, or on a relatively short time scale, such as CO poisoning. Moreover, several other critical issues, notably freeze–start and startup–shutdown, are strictly transient.
Simplifying assumptions are regularly adopted because of the complexity of the system, such as one or more of: regular-ized liquid-water permeability, infinitely thin CL and isothermal conditions [5–7,10–13]. For detailed reviews of steady-state modelling to the year 2004 the reader is referred to [14,15]. Notable exceptions to the steady-state trend are[16–21], none of which however include liquid-water transport or an energy balance, which are vital to an accurate description of flooding and membrane hydration. More comprehensive, fully two-phase models are found in[22,23]. The model in[23]is able to capture and predict the so-called “hysteresis” phenomenon observed in sweep cycling (of voltage or load), as well as its behaviour with respect to variations in the channel conditions.
Degradation phenomena have likewise received little atten-tion in the modelling literature, particularly their incorporaatten-tion into full MEA models. Modelling of membrane degradation is hampered by uncertainty in the reactions driving the structural changes[24]. On the other hand, due to the work of Springer et al.[25], Baschuk and Li[26–28]and Bhatia and Wang[29], good models for the kinetic mechanism of CO poisoning of the anode have been developed. This issue is of paramount importance as long as reformate gas is intended as the main source of H2, whether on- or off-board a vehicle, until carbon-free pathways are developed,[30]. The concentration of CO in reformate can be as high as 100 ppm, which, because of its preferential adsorp-tion, is extremely detrimental to performance. Of the methods to mitigate and reverse this process the two most widely studied are
1. Introduction of O2or air into the anode stream to enhance (provide an additional pathway for) CO oxidation on the Pt surfaces[31].
2. Alternative catalysts, for example platinum–ruthenium (Pt–Ru), that promote the production of oxygen-containing species such as hydroxyl (OH) and therefore provide an addi-tional pathway for oxidation of CO from the Pt surfaces [32].
In the work of Springer et al.[25], the proposed CO poisoning mechanism was incorporated into a steady-state, single-phase model of the anode catalyst layer (ACL) and GDL. Baschuk and Li[27]placed the same mechanism inside a one-dimensional, steady-state, single-phase MEA framework, later extending their work to include the effects of O2 bleeding using a more sim-plified MEA model [28]. A three-dimensional steady-state, single-phase phase model can be found in[33]. Bhatia and Wang [29]studied the transient problem by simplifying the kinetics proposed by Springer et al. and neglecting the transport phe-nomena, restricting their attention to the ACL. A similar model, which includes the diffusion of gas, can be found in[34]. A dif-ferent approach can be found in[35], in which there is assumed to be a competition between linearly bonded and bridge-bonded adsorption, in contrast to the purely linear-bonded models in [25–29,33,34]. This model neglects the transport problem, is steady-state, employs temperature-independent rate constants and simplifies the CO adsorption kinetics. One of the aims of the latter work is to investigate the role of ruthenium (Ru), when
alloyed with Pt, in resisting the CO poisoning. A more recent model of Pt–Ru, [36], takes the linear-bonded approach, con-centrating solely on the kinetics of CO adsorption and oxidation in the ACL. A detailed discussion is postponed until Section4.2. The kinetics of CO poisoning, on either Pt or Pt–Ru, or of O2 bleeding have yet to be incorporated in a two-phase MEA model, even under a steady-state, isothermal assumption. Flooding, membrane hydration, (averaged) microscopic proper-ties such contact angle and pore size, and the evolution of the system in time will inevitably interact with and influence the kinetic problems—as we shall demonstrate by means of several examples. The aim of this paper is to incorporate these kinetic mechanisms in the transient, two-phase, non-isothermal model developed in[23](in which its predictive capability is demon-strated) thereby extending CO modelling for PEMFC in several key areas simultaneously. The following features are included.
1. The entire MEA with explicit models of the GDL, membrane and both CL.
2. A full description of the transport of charge, mass (including dissolved reactants and liquid-water) and thermal energy in the multi-phase system.
3. The full kinetic models of Springer et al. and Baschuk and Li for CO poisoning and O2bleeding[25,28], and an aug-mented version of the model of Enb¨ack and Lindbergh for CO kinetics on Pt–Ru[36].
4. The mass-diffusion limitation in the cathode catalyst layer (CCL) using an agglomerate model.
5. Microstructural characterization of each component (in an averaged sense) and arbitrary (operating) conditions in the channel.
The resulting model has significant potential as a frame-work for a PEMFC code that is able to predict performance
anddegradation phenomena in realistic settings.
2. Model assumptions and equations
The various features and assumptions that form the basis of the model are now listed and briefly discussed (we refer to[23] for full details).
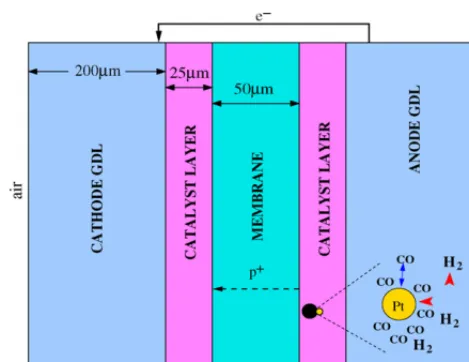
1. One-dimensional full MEA transient. The domain includes the entire MEA from the interface between the gas channels and GDL to the membrane (seeFig. 1). Each component is modelled explicitly.
2. Catalyst layers. We assume that the carbon support forms spherical clusters, referred to asagglomerates. Surrounding each agglomerate is an electrolyte layer, possibly surrounded by a layer of liquid-water. The pores between agglomerates are referred to as primary pores, distinct from the smaller pores between the carbon particles.
Devia-Fig. 1. Model geometry indicating the entry points of the reactants and contam-inant, and the transport of protons and electrons.
tion from Henry’s law (equilibrium) provides a driving force for interfacial mass transfer. As in[5,22,37]the steady-state Darcy’s law is employed for the convective flow of gas. 4. Proton and electron concentration. The protons are assumed
to be transported in the form of hydronium ions, H3O+. For both proton and electron transport we assume electro-neutrality and a pseudo steady-state (see[38]).
5. Water. Water is considered to exist in three forms: as a dis-solved species, as vapour and as liquid. We assume that thenetwater produced is in liquid form. Condensation and evaporation are modelled using the approach in[2,4,5], and references therein (dictated by the deviation of the local ther-modynamic state from equilibrium). In a similar fashion, we introduce phase change between vapour and dissolved water and between liquid and dissolved water by considering the deviation from an equilibrium between the phases.
6. Temperature. A single temperature is assumed, amounting to an assumption of infinite rates of heat exchange between the phases.
7. Kinetics. The kinetics for CO poisoning are taken from [25], which have also formed the basis for the work in [26,27,29]. This model assumes linearly bonded CO and H2on Pt, with temperature, potential and coverage depen-dent rate constants. Kinetics for O2bleeding are taken from [28] and assume that the gas-phase oxidation of CO and H2 is negligible. Those on Pt–Ru are an extension of the model in [36], which neglects the adsorption of CO on Ru and the H2 kinetics entirely, and are based on the bi-functional mechanism proposed by Watanabe and Motoo [39].
2.1. Gas phase equations
Letsdenote liquid-water (H2Oliq) saturation,CO,CN,CH, CCO,CCO2 andCv, respectively the concentrations of O2, N2, H2, CO, CO2and vapour (H2Ovap) in the pore space, andCi,e,
i∈ {O,H,CO,CO2}, the concentrations of O2, H2, CO and CO2 in the CL electrolyte and membrane. The subscriptjrefers to anode (a) and cathode (c). Mass balances yield
∂
∂t((1−s)Ci)− ∂ ∂x
Dp,i
∂Ci
∂x −vgCi
= −Spi (1)
∂
∂t((1−s)CN)− ∂ ∂x
DN ∂CN
∂x −vgCN
=0 (2)
∂
∂t((1−s)Cv)− ∂ ∂x
Dv ∂Cv
∂x −vgCv
=Sce+νSad (3)
whereDp,i,DNandDv,i∈ {O,H,CO,CO2}, are the diffusion coefficients of O2, H2, CO, CO2, N2 and vapour in the pore space (see the expressions inTable 7, in whichTis temperature andPis gas pressure). The porositytakes the value=pin the CL and=gin the GDL.
The gas velocity is assumed to follow Darcy’s law and the Kozeny–Carman law is used to approximate permeability
vg= −κ μ(1−s)
3∂P ∂x, κ=
d2 K
3
(1−)2 (4)
where κ is the absolute permeability of the GDL or CL, μ is the dynamic viscosity of the gas, the factor (1−s)3 is the relative permeability, d is a mean pore diameter and K is the Kozeny–Carman constant. The source terms are defined inTable 1. The quantityν=1800 mol m−3is the fixed-charge site concentration of the membrane,hpe,iare volumetric
mass-transfer coefficients from gas to electrolyte (on the gas side) and Hi, i∈ {O,H,CO,CO2}, are dimensionless Henry
con-stants. Eachhpe,i is approximated based on a local Sherwood
number of 2 (for flow past a spherical particle,[40]),hpe,i =
(ShDp,isa)/(d)≥O(105), wheresa is the specific surface area
of the agglomerates. The condensation/evaporation coefficient hpcis defined later.
2.2. Membrane and carbon phases
[image:4.637.40.275.65.246.2]The electrolyte volume fraction,e, has two components: one from the films that coat the agglomerates (fe) and the other from the electrolyte contained in the agglomerate interiors (ie), with e=fe+ie. To account for the volume change due to swelling (assumed to impact only the film thickness) we writefe=fe,0+ 0.0126λ, whereλis the membrane water content (mol H2O/mol Table 1
Sources and sinks for the gas phase Eqs.(1)–(3)
ACL CCL GDL Meaning
Spi hpe,i(HiCi−Ci,e) hpe,i(HiCi−Ci,e) 0 Reactant dissolution in electrolyte
Sce −hpc(XvP−Psat) −hpc(XvP−Psat) −hpc(XvP−Psat) Condensation/evaporation
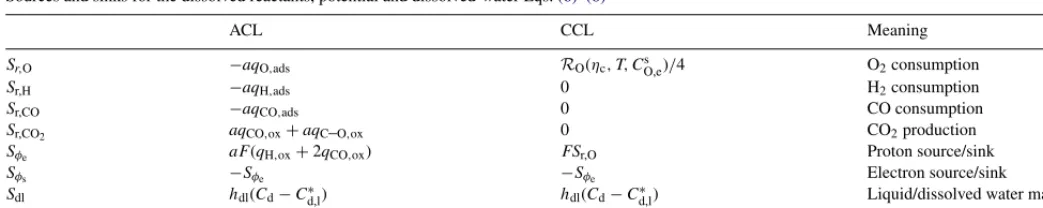
[image:4.637.34.554.689.742.2]Table 2
Sources and sinks for the dissolved reactants, potential and dissolved-water Eqs.(6)–(8)
ACL CCL Meaning
Sr,O −aqO,ads RO(ηc, T, CO,es )/4 O2consumption
Sr,H −aqH,ads 0 H2consumption
Sr,CO −aqCO,ads 0 CO consumption
Sr,CO2 aqCO,ox+aqC–O,ox 0 CO2production
Sφe aF(qH,ox+2qCO,ox) FSr,O Proton source/sink
Sφs −Sφe −Sφe Electron source/sink
Sdl hdl(Cd−Cd,l∗) hdl(Cd−C∗d,l) Liquid/dissolved water mass transfer
Sw −aqCO,ox+aqH–O,ox −2Sr,O Water production (liquid phase)
The last term represents liquid-water production in Eq.(11).
SO−3) andfe,0represents the volume fraction of film without any swelling. The latter quantity is related to the film thickness with-out swelling,δe,0, as shown inTable 6(see[23]for full details).
The Pt inside the agglomerates is assumed to be inactive and the combined volume fraction of the carbon, Pt and small pores,a, is assumed constant. The volume fraction of primary pores is thusp=1−a−e. Membrane water content satisfies
λ= Cd
1−0.0126Cd where
Cd=
dissolved water concentration(mol m−3)
ν (5)
Equations for reactant concentration in the electrolyte and membrane are given by
∂
∂t(Ci,e)− ∂ ∂x
3/2Di,e ∂Ci,e
∂x
=Sr,i+Spi (6)
where =e in the CL, =1 in the membrane and Di,e,
i∈ {O,H,CO,CO2}, are the diffusion coefficients (seeTable 7) used with Bruggeman corrections. The source terms are defined in Table 2; the surface reaction rates q and the volumetric reaction rateROwill be defined in Section2.6. The quantitya is the volumetric specific surface area of catalyst.
Equations for potential in the electrolyte/membrane and car-bon,φe andφs, respectively, are derived from conservation of charge (assuming electro-neutrality and steady-state)
−∂ ∂x
3/2σe∂φe ∂x
−Sφe = − ∂ ∂x
3/2σs∂φs ∂x
+Sφs =0 (7)
whereσe and σs are the protonic and electronic conductivity respectively (used with Bruggeman corrections) andFis Fara-day’s constant.=ein the CL and=1 in the membrane for φe, while=1−gin the GDL and=s in the CL forφs.
The source terms are defined inTable 2and the conductivities inTable 7.
The mass balance for water dissolved in the electrolyte is written as follows
∂
∂t(Cd)− ∂ ∂x
3/2Dd∂Cd ∂x +
5λ 44Fν
3/2σe∂φe ∂x
=−Sad−Sdl (8)
in which =1 for the membrane and=e for the CL, and Dd is the diffusion coefficient for dissolved water, given in Table 7(note the Bruggeman correction). The source termsSad andSdlare defined inTables 1 and 2respectively, and will also be discussed in Section2.5.
2.3. Energy
The conservation of thermal energy is expressed as follows:
∂
∂t(ρCpT)+ ∂ ∂x
sρlClvlT+(1−s)ρgCgvgT −k ∂T ∂x
= k
Sk (9)
whereρl,ρgandρs(Cl,CgandCs) are respectively the densities (specific heat capacities) of liquid, gas and solid, andk(ρCp) is
the volume averaged thermal conductivity (heat capacity)
k=kp(1−s)+kls+ks(1−),
[image:5.637.42.563.671.744.2]ρCp=sρlCl+(1−s)ρgCg+ρsCs(1−) (10) wherekp,ks andkl are the thermal conductivities of the pore space, solid (averaged) and liquid-water respectively. In the GDL =g and in the catalyst layers=p. In the membrane the only form of heat transport is conduction.
Table 3
Sources and sinks for the energy Eq.(9)
Membrane ACL CCL GDL Meaning
Sact 0 aFηaqH,ox FηcRO(ηc, T, CO,es ) 0 Activation losses
Srev 0 −aTaqH,ox cTRO(ηc, T, CO,es ) 0 Heat of reaction
Sohm σe
∂φ e ∂x 2 j 3/2 j σj
∂φj ∂x 2 j 3/2 j σj
∂φj
∂x 2
(1−g)3/2σs
∂φ
s
∂x
2
Ohmic losses
The quantityvlis the liquid-water interstitial velocity and the source termsSkare defined inTable 3. In these expressions−j
is the entropy associated with ORR (j=c) and HOR (j =a) andhglis the liquid-gas enthalpy change for water.
2.4. Liquid phase
The mass balance of liquid-water is used with Darcy’s law for the convective flux
ρl Wl ∂s ∂t + ∂ ∂x ρl Wl vl
= −Sce+νSdl+Sw, vl= − κs3
μl ∂p ∂x (11)
where the source terms are defined inTables 1 and 2,=gin the GDL and=pin the CL.Wl,vl,μlandpare the molar mass, velocity, viscosity and pressure of liquid-water (with a relatively permeability ofs3and absolute permeabilityκ). Since p=P −pc, wherepcis capillary pressure, combining the equa-tions above yields
ρl Wl
∂s ∂t +
κρl μlWl
∂ ∂x s3 dpc ds ∂s ∂x − ∂P ∂x
=−Sce+νSdl+Sw (12)
For a discussion on the form of the permeability and capillary pressure the reader is referred to[4,41]. In this paper we adopt the widely used Leverette-function found in, for example,[9]. In the GDL and CL the capillary pressure is defined as (respectively)
pc=σcosθcg
g
κgJ(1−s), pc=σ
cosθc c
p
κcJ(s) (13) whereJ(ξ)=1.417ξ−2.12ξ2+1.262ξ3is the Leverette func-tion,σis surface tension, andθccandκc(θcgandκg) are the contact angle and absolute permeability of the CL (GDL), respectively.
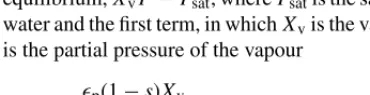
2.5. Water balance: phase change
Condensation/evaporation is driven by the deviation from equilibrium,XvP−Psat, wherePsatis the saturation pressure of water and the first term, in whichXvis the vapour mole fraction, is the partial pressure of the vapour
hpc=kcp(1−s)Xv
RT if XvP > Psat and hpc=ke
psρl
Wl if XvP < Psat (14) in which kc andke are the condensation and evaporation rate constants, whose values are taken from[2](seeTable 7).
In a similar fashion, the vapour-dissolved phase-change term in Eqs.(3)and(8)is driven by the deviation from equilibrium between the vapour and dissolved water,Cd−C∗d, whereC∗dis the dissolved concentration at equilibrium (from[42])
λ∗=0.3+10.8aw−16a2w+14.1a3w,
C∗d(1+0.0126λ∗)=λ∗ (15)
aw=XvP/Psatis the water vapour activity. The mass-transfer coefficienthdvis approximated from the results in[43] hdv=κa(1−s)λ if Cd−C∗d<0 and
hdv=κd(1−s)λ if Cd−C∗d>0 (16) whereκdandκeare given inTable 7.
The equilibrium membrane water content depends on the environment, with either relationship (15) for contact with vapour orλ=λ∗l =16.8 (orCd=C∗d,l=λ∗l/(1+0.0126λ∗l)) for contact with liquid. The discontinuity between the vapour-saturated and liquid values is known as Schroeder’s paradox. The mass-transfer termSdlin Eqs.(8)and(11), andTable 2, is decom-posed into terms for absorption and desorption of liquid-water to and from the electrolyte in the CL. When the liquid-equilibrated water content valueCd,l∗ is reached or exceeded, it is assumed that desorption of water from the electrolyte takes place (as liq-uid), the magnitude of which is driven byCd−C∗d,l. Adsorption is assumed to take place forCd< Cd,l∗ provideds > s∗, where s∗is the immobile saturation. The termhdlinTable 2therefore takes the form
hdl=kdesH(Cd−C∗d,l)+kadsH(s−s∗)H(−Cd+C∗d,l) (17) whereH(·) is the Heaviside function andkdes andkadsare the coefficients of desorption and absorption, which, for simplicity, are assumed to be constant. Their values are chosen large enough thatCddoes not overshootC∗d,lsignificantly; seeTable 7.
2.6. Reaction kinetics
In this section we define the reaction rates appearing in Table 2. The kinetics at the cathode are approximated as follows:
oxygen reduction reaction (ORR):
O2+4H++4 e−→2H2O (18)
for which we use the Butler–Volmer law (in mol m−3s−1)
RO(ηc, T, CO,es )= airef,O FCref,O
eCO,es (eαaFηc/RT −e−αcFηc/RT) (19)
with exchange current densityiref,O, anodic and cathodic
trans-fer coefficientsαaandαc, reference reactant molar concentration Cref,O, volumetric specific surface area of catalyst (per unit
vol-ume of catalyst layer)a and overpotentialηc. The expression a=aptmpt/Lrelatesato the mass specific Pt surface area (Pt surface area per unit mass of Pt),apt, the Pt loading,mpt, and the CL thickness,L. The overpotentials in the cathode and anode, ηcandηarespectively, are defined as
[image:6.637.34.219.579.626.2]rate is then
RO=4γaCO,e
eαaFηc/RT −e−αcFηc/RT γ+a(eαaFηc/RT −e−αcFηc/RT), a= airef,Oe
4FCref,O
(21)
whereγis a measure of the diffusion rate through the films. It is approximated as follows:
γ= γlγe γl+γe
, where γl= A
D
l δl
, γe=ADe,O δe
,
A=4π(Ra+δe)2N (22)
in which δe (δl) is the electrolyte (water) film thickness,N is the number of agglomerates per unit volume, A=4πR2aN is the specific surface area of agglomerates (we assume that all of the surface area is covered), with agglomerate radiusRa, and Dlis the diffusion coefficient of O2through liquid-water. The film thicknesses,δe andδl, are defined inTable 6(taking into account electrolyte swelling). The reader is referred to[23]for a derivation.
It is commonly accepted that electrochemical CO oxidation in acidic solutions involves surface reaction between adsorbed CO and an oxygen-containing species [44]. On the anode we use the model proposed by Springer et al. in[25], based on the mechanism
H2adsorption: H2+2M2(H–M),
H2electro-oxidation: 2(H–M)2H++2e−+2M,
CO adsorption: CO+MCO–M,
CO electro-oxidation:
CO–M+H2OM+CO2+2H++2e− (23)
where M represents a free Pt site. When O2 is present in the anode, we assume that the gas-phase oxidation of CO and H2is negligible in comparison to oxidation by heterogeneous catal-ysis. Thus, the additional reactions are assumed to follow (see Baschuk and Li[28])
O2adsorption: O2+2M2(O–M),
CO heterogeneous oxidation: CO–M+O–M→CO2+2M,
H2heterogeneous oxidation: O–M+2(H–M)→H2O+2M
(24)
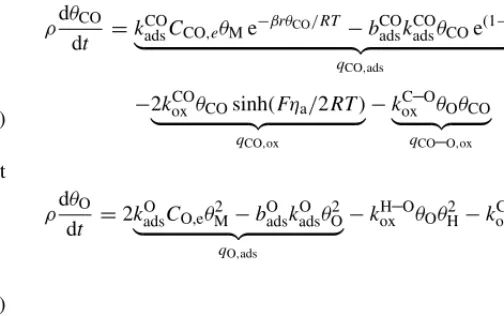
which provides an additional path for CO oxidation, removing it from the Pt surfaces at a faster rate. Equations for the evolution of the site coveragesθi,i∈ {O,H,CO,M}, are as follows (using
notation similar to that in[28])
ρdθH dt =2k
H
adsCH,eθ2M−bHadskHadsθ2H
qH,ads
−2kHoxθH(eαaFηc/RT −e−αcFηc/RT)
qH,ox
−2koxH–OθOθH2
qH–O,ox (25)
ρdθCO dt =k
CO
adsCCO,eθMe−βrθCO/RT −badsCOkCOadsθCOe(1−β)rθCO/RT
qCO,ads
−2kCOox θCOsinh(Fηa/2RT)
qCO,ox
−kC–Oox θOθCO
qCO–O,ox
(26)
ρdθO dt =2k
O
adsCO,eθM2 −bOadskOadsθO2
qO,ads
−kH–Oox θOθ2H−kC–Oox θOθCO
(27)
θM=1−θH−θO−θCO (28) We are assuming: H2 and O2 (dissociative) adsorption and desorption based on Langmuir isotherms (qH,ads and qO,ads);
Butler–Volmer kinetics for electro-oxidation of H2 and CO (qH,ox andqCO,ox); CO adsorption and desorption based on a
Frumkin isotherm (qCO,ads); and Langmuir–Hinshelwood
kinet-ics for the heterogeneous oxidation of CO and H2(qH–O,oxand qCO–O,ox). The quantityρis the molar area density of catalyst
sites.
The Frumkin kinetics[45]for CO adsorption and desorption were proposed by Springer et al.[25](see references therein) based on analysis of the dependence of the critical current den-sity onθCO. The same approach is adopted here, including the dependence of the forward step onθCO, with symmetry factor β and interaction parameterr. The Langmuir model assumes that coverage does not exceed a monolayer, that there is no interaction between adsorbed molecules and that the apparent standard free energy of adsorption is coverage-independent. The Frumkin model assumes that this energy varies linearly withθCO (each additional molecule adsorbs with less ease). The interac-tion parameter is the slope of this variainterac-tion[46]. Note that this dependence was neglected by Bhatia and Wang[29], as well as the second-order nature of the intermediate hydrogen step pro-posed by Springer et al. Following Baschuk and Li[28], the rate constants are assumed to be of the Arrhenuis type
kji =kj,i0e−Eij,k/RT, bi
j=bij,0e−
Eij,b/RT
(29)
[image:7.637.312.564.70.228.2]The pre-exponential factors and activation energies are listed in Table 4and their values will be discussed in Section3.1.
When Pt is replaced with Pt–Ru, these equations require mod-ification. The kinetics in that case, including the adsorption of water and formation of hydroxyl radicals (OH), are presented and discussed in Section4.2.
2.7. Initial-boundary conditions, numerical details and parameters
Table 4
Pre-exponential factors and activation energies for the rate coefficients(29)in the system(25)–(28)
Adsorption Desorption Electro-oxidation
H2 kH
ads,0=3 m s−1 bHads,0=4.18×10¹¹mol m−3 kHox,0=23.1 mol m−2s−1
EHads,k=10.4 kJ mol−1 EH
ads,b=87.9 kJ mol−
1 EH
ox,k=16.7 mol m− 2s−1
CO kads,0CO =3×10⁴m s−1 bCO
ads,0=6.87×10³mol m−3 k CO
ox,0=3.4×10⁹mol m−2s−1
ECOads,k=47.3 kJ mol−1 ECO
ads,b=100 kJ mol−
1 ECO
ox,k=127 mol m− 2s−1
O2 kads,0O =6×10¹⁵m s−1 bO
ads,0=1.36×10
36mol m−3
EO
ads,k=14.2 kJ mol−1 EOads,b=250 kJ mol−1
Heterogeneous oxidation
H O kox,0H–O=3.28×10⁴mol m−2s−1
EH–Oox,k =65.9 kJ mol−1
C O kox,0C–O=8.3×10⁷mol m−2s−1
EC–Oox,k =90 kJ mol−1
CL and GDL,x=x1andx=x4, are negligibly small ∂Ci,e
∂x = ∂φe
∂x =Dd ∂Cd
∂x + 5λσe 44Fν
∂φe
∂x =0 (x=x1, x4), ∂Ci
∂x = ∂s
∂x =0 (x=x2, x3) (30)
At the interfaces between the channels and GDL, the gas concentrations, temperature, water activity and pressure are pre-scribed. The cell voltage, Vcell, is prescribed at the cathode channel/GDL interface, and at the anode channel/GDL interface we assume a zero concentration of electrons.
Ci(x0)=C¯i,c, Ci(x5)=C¯i,a i∈ {H,O,CO,CO2,N, v},
φs(x0)=Vcell, φs(x5)=0, T(x0)=Tc, T(x5)=Ta, P(x0)=Pc, P(x5)=Pa, aw(x0)=aw,c, aw(x5)=aw,a
(31)
The values of ¯Cv,cand ¯Cv,aare calculated from the water activity. The saturation pressure in atm, a function of temperature, is
given by the formula in[47]
log10Psat= −2.1794+0.02953T −9.1837×10⁻⁵T2 +1.4454×10⁻⁷T3 (32) where T =T−273. From these relationships we obtain
¯
Cv,c=aw,cPsat,c/RTc, wherePsat,cis the cathode-channel
satu-ration pressure. A similar calculation applies on the anode side. The final boundary conditions are those for liquid-water at the interfaces between the gas channels and the GDL. We approx-imate them with the following steady-state flux conditions at x=x0andx=x5(see[23]for details)
∂s
∂x−js=0, j∈ {a, c} (33) wherej=0 corresponds to zero water removal from the anode
channel,j =a, or cathode channel,j=c.jis likely to depend
sensitively on the flow rate in the channel[48].
Initial conditions for pressure, temperature and vapour con-centrations are consistent with the conditions in the channels. The water content of the membrane/electrolyte is assumed to be given by equilibrium with vapour in the channels. The saturation at the initial time is assumed zero.
Table 5
Channel conditions assumed in the calculations, unless otherwise specified
Symbol Quantity Size
Tc Cathode channel temperature 70◦C
Ta Anode channel temperature 70◦C
aw,c Cathode channel water activity 1
aw,a Anode channel water activity 1
¯
CO,c Oxygen concentration in cathode channel 18.13 mol m−3
¯
CH,a Hydrogen concentration in anode channel 34.52 mol m−3
Pc Gas pressure in the cathode channel 300 kPa
Pa Gas pressure in the anode channel 300 kPa
¯
Cv,c Vapour concentration in cathode channel 15.91 mol m−3
¯
Cv,a Vapour concentration in the anode channel 15.91 mol m−3
[image:8.637.33.553.610.743.2]Table 6
Unless otherwise specified these parameter values, relating to structural and electrochemical properties, were used in the calculations
Symbol Quantity Size Ref.
Structural
L Catalyst layer thickness 25m assumed
Lm Membrane thickness 50m Assumed
Lg GDL thickness 200m Assumed
ie Electrolyte volume fraction in agglomerates 0.15 Assumed
a Volume fraction of agglomerates 0.4215 [55]
s Volume fraction of carbon in CL 0.2 Estimated
g Porosity of the GDL 0.74 [56]
Ra Agglomerate radius 0.5m [55]
δe,0 Electrolyte film thickness w/o swelling 0.1m [23]
f
e,0 Electrolyte volume fraction w/o swelling
4πN
3 [(Ra+δe,0)3−R3a] [23]
δe Electrolyte film thickness (m)
3
R3 a+ 3
f e
4πN−Ra [23]
δl Water film thickness (m):Rδ=Ra+δe 3
R3δ+4πN3sp−Rδ [23]
N Agglomerate density 5.8×10¹⁷m−3 Estimated
apt Specific surface area of Pt 1000 cm2(mg Pt)−1 [57]
mpt Pt loading 0.4 (mg Pt) cm−2 [3]
θcc(θ g
c) Catalyst-layer (GDL) contact angle 90◦(120◦) [58]
dg GDL pore size 10m Assumed
dc Catalyst-layer pore size 2m Assumed
Electrochemical
iref,O Cathode exchange current density 10−2A m−2 [22]
Cref,O Reference O2concentration 0.05 mol m−3 Assumed
αc Cathodic transfer coefficient 0.55 Measured
αa Anodic transfer coefficient 0.45 Measured
β Symmetry factor 0.1 [28]
r Interaction parameter 39.77 kJ mol−1 [28]
β2 Symmetry factor (H2O) 0.5 [36]
r2 Interaction parameter (H2O) 1.34 kJ mol−1 [36]
E0 Open circuit potential 0.95 V Assumed
ρ Molar area density of Pt sites 0.01042 mol m−2 [29]
ρRu Molar area density of Ru sites ρ/2 mol m−2 Variable
k1 Forward rate constant (CO oxidation) 10−7mol m−2s−1 Fitted
k−1 Backward rate constant (CO oxidation) 10−9mol m−2 Fitted
k2 Forward rate constant (H2O adsorption) 4×10⁻⁷mol m−2s−1 [36]
k−2 Backward rate constant (H2O adsorption) 9×10⁻⁸mol m−2 [36]
−c Entropy associated with ORR 163.7 J mol−1K−1 [59]
−a Entropy associated with HOR2 0 J mol−1K−1 [59]
The initial-boundary value problem was solved in COMSOL 3.2a, on a uniform grid (typically 128 points) using quartic Lagrange polynomials as trial and test functions. The switch functions were substituted with hyperbolic tangent functions to smooth the discontinuities, a standard procedure.
The default set of parameter values is given inTables 5–7. Parameter fitting of some of the electrochemical rate constants was found to be necessary, as in[25–29,33,34]. Several other parameters are estimated (as indicated inTables 5–7), and the rest are found from the literature (with references provided).
3. Results and discussion
3.1. Validation and dependence on concentration
As a confirmation that the kinetics have been correctly cap-tured we first compare our results to the experimental data collected by Bhatia and Wang[29], for temporal variations in the current density at a fixed cell voltage, under several CO
Table 7
Heat, charge and mass transfer/transport properties used in the calcu lations, unless otherwise specified
Symbol Quantity Size Ref.
Dp,O O2diffusion coefficient 4.23×10⁻⁹((1−s)T)3/2/Pm2s−1 [40]
Dp,H H2diffusion coefficient 1.43×10⁻⁸((1−s)T)3/2/Pm2s−1 [40]
Dv Vapour diffusion coefficient 5.27×10⁻⁹((1−s)T)3/2/Pm2s−1 [40]
Dp,CO CO diffusion coefficient 4.12×10⁻⁹((1−s)T)3/2/Pm2s−1 [40]
Dp,CO2 CO2diffusion coefficient 3.6×10−
9((1−s)T)3/2/Pm2s−1 [40]
DN N2diffusion coefficient 3.6×10⁻⁹((1−s)T)3/2/Pm2s−1 [40]
Dd Diffusion coefficient for H2Odis 4.17×10⁻⁸λ(1+161 e−λ) e−2436/Tm2s−1 [60]
Dl O2diffusivity in H2Oliq(60◦C) 4.88×10⁻⁹m2s−1 [40]
De,O O2diffusivity in Nafion 3.1×10⁻⁷e−2768/Tm2s−1 [61]
De,Ha H2diffusivity in Nafion 6.92×10⁻⁹m2s−1 [62]
De,COa CO diffusivity in Nafion 4.38×10⁻⁹m2s−1 [62]
De,CO2
a CO2diffusivity in Nafion 4.12×10⁻⁹m2s−1 [62]
hpe,i Mass transfer rates 105s−1 Estimated
HOb O2Henry’s law constant 0.15 [16]
HHb H2Henry’s law constant 0.63 [6]
HCOa CO Henry’s law constant 0.32
HCO2
a CO2Henry’s law constant 1.94
κj(κg) Absolute permeability of CCL (GDL) 10−13(8.7×10⁻¹²) m2 [56,63]
μl H2Oliqviscosity 10−3Pa s [4]
μ Dynamic viscosity air 1.8×10⁻⁵Pa s Estimated
μ Dynamic viscosity H2 8.4×10⁻⁶Pa s Estimated
σ Surface tension 0.07 N m−1 [4]
k Catalyst layer thermal conductivity 0.67 W m−1K−1 [64]
km Membrane thermal conductivity 0.67 W m−1K−1 [64]
kg GDL thermal conductivity 1.67 W m−1K−1 [64]
ρlCl H2Oliqheat capacitance 4.187×10⁶J m−3K−1 Estimated
ρgCg Air heat capacitance 103J m−3K−1 Estimated
ρmCm Membrane heat capacitance 2.18×10⁶J m−3K−1 Estimated
ρcCc Carbon heat capacitance 1.61×10⁶J m−3K−1 Estimated
−c Entropy associated with ORR 163.7 J mol−1K−1 Lamp
−a Entropy associated with HOR3 0 J mol−1K−1 [59]
σs Electronic conductivity 500 S m−1 [65]
σe Protonic conductivity e1286(1/303−1/T)(0.514λ−0.326) S m−1 [47]
kdes H2OliqDesorption coefficient 100 Assumed
kads H2Odisadsorption coefficient 10 Assumed
κa Absorption constant 10−6m s−1 [43]
κd desorption constant 3.3×10⁻⁶m s−1 [43]
ke Evaporation coefficient 100 s−1atm−1 [2]
kc Condensation coefficient 100 s−1 [2]
aApproximated by value in/for liquid-water at 60◦C.
b For a detailed discussion see[66].
[image:10.637.95.495.552.725.2]Fig. 3. Simulated profiles of CO surface coverage,θCO, for 100 ppm (left-hand figure) and 10 ppm (right-hand figure) of CO in 40%H2/N2, corresponding to the calculations inFig. 2.
rapid rate of H2oxidation. The quantitative values are dependent on the parameters – those determining the rates of adsorption, desorption and oxidation – as was discussed in detail by Springer et al.[47]. Bhatia and Wang[29]adjusted the two parameters (assumed constant in their work)kHadsandbCOadsin order to match the experimental results. To achieve the correct qualitative trends a similar procedure was applied here with adjustments inkadsH ,0 andkoxCO,0, the latter to a value close to that in[47]where it was approximately four orders of magnitude smaller than in the base case of[28]. In fact the corresponding term (CO heterogeneous oxidation) was neglected entirely by Bhatia and Wang[29]since it was deemed too small to contribute, at least at the cell voltages considered. The remaining values inTable 4are taken from[28].
3.2. Effects of cell voltage and sweep rate: potentiostatic sweep
One of the effects not captured in the previous result (Fig. 2) is that of cell voltage on the extent of degradation. Of course, under steady-state conditions this effect is naturally contained
in the polarization curves, which represent, generally speaking, the behaviour at timet= ∞(i.e., sufficiently long for a ‘steady-state’ to be reached). In this section we present simulations of transient variations in the cell voltage (potentiostatic sweeps) for time scales smaller than those required for relaxation to steady-state. These experiments can yield results that are qualitatively similar to the steady-state curves but in general contain a richer structure[22,23,49].
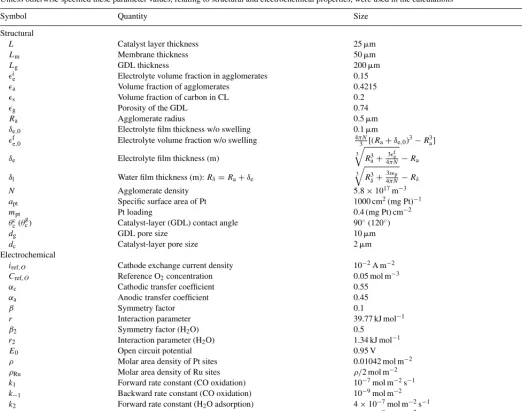
The first result is shown on the left-hand side of Fig. 4, demonstrating the variation in performance with 40%H2/N2and different CO concentrations. These curves are generated by a simulated voltage sweep from 1 to 0 V in 80 min. As with the steady-state polarization curves (see for example[25]) there are two characteristic turning points for large CO concentrations, one occurring at high cell voltage and marking the onset of poorer performance compared to 0 ppm, and one at a lower cell voltage, at which performance improves markedly. The expla-nation for these turning points is apparent from Fig. 5, which shows the simulated profiles of CO and H2 surface coverage, θCOandθH, and simulated electro-oxidation rates,aqCO,oxand aqH,ox, for 50 ppm.
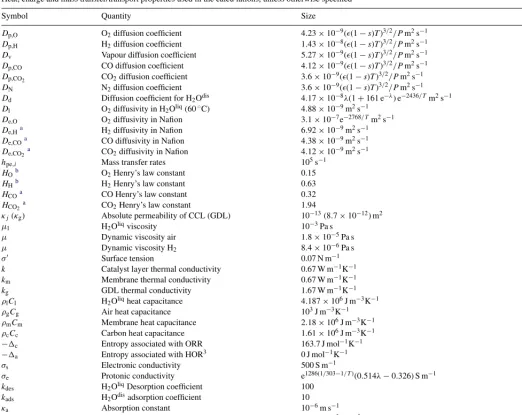
[image:11.637.104.505.543.720.2]Fig. 5. The first two rows show simulated profiles of the surface coverage,θHandθCO, and the electro-oxidation rates,aqH,oxandaqCO,ox. The bottom row shows the evolutions of anode overpotential,ηa, and H2surface coverage,θH, at the interface between the ACL and membrane,x=x3. Note that these plots correspond to the calculation for 25 ppm CO in 40%H2/N2on the left-hand side ofFig. 4: a potential sweep from 1 to 0 V in 80 min.
The first turning point is caused by the rapid coverage of sites, the extent of which increases with increasing CO concen-tration at fixed cell voltage (see Fig. 4). In the range of cell voltage between 1 V and the first turning point the rates of H2 and CO oxidation are slow. At a cell voltage of approximately 0.45 V the rate of H2oxidation increases rapidly because of its exponential dependence on anode overpotential, the maximum in which evolves as shown in the bottom right ofFig. 5. This
Fig. 6. Simulated profiles of CO surface coverage,θCO, and H2electro-oxidation rate,aqH,ox, for 50 ppm in 40%H2/N2, corresponding to the calculations on the right-hand side ofFig. 4. The two cases shown here are for sweeps from 1 to 0 V in 10 min (left-hand column) and 80 min (right-hand column).
Unsurprisingly, the results contained in the left-hand side of Fig. 4are dependant on the rate of decrease of the cell volt-age (sweep rate). The right-hand side ofFig. 4 demonstrates the trend as the sweep time is decreased from 80 to 10 min.
Clearly, the shorter the time the better the performance at fixed cell voltage; a manifestation of the decreasing time available to reach CO coverage levels that inhibit the H2oxidation substan-tially (see Fig. 6). The first turning point therefore occurs at a
[image:13.637.103.505.529.704.2]lower cell voltage as the sweep rate is decreased. This has the natural consequence of shortening the distance in cell-voltage space between the the two turning points; by the time the CO coverage is significant the cell voltage is low enough to bring about the onset of the second turning point. At a low enough sweep rate the extent of CO coverage is too low to engen-der the first turning point, as illustrated in the 10 min sweep inFig. 4.
3.3. Effects of anode channel pressure, temperature and humidity
[image:14.637.90.499.198.699.2]The effect of anode channel pressure on the CO poisoning effect was investigated experimentally by Springer in[47]. It was found that increasing the anode pressure had a detrimental effect on performance, measured at steady-state, indicating that the kinetic order in free catalyst sites in Eq.(25)exceeds unity
Fig. 8. The top row of figures shows simulated saturation profiles generated by a voltage sweep from 1 to 0 V in 80 min, with 50 ppm CO in 40%H2/N2, for two different anode-channel pressures (corresponding toFig. 7). The middle row of figures shows the profiles of H2surface coverage and electrolyte concentration,
Fig. 9. Polarization curves generated from simulated potential sweeps (1–0 V in 80 min) with 50 ppm CO in 40%H2/N2, for a range of anode channel humidity (left hand figure withT =70◦C in both channels) and a range of channel temperature (right-hand figure withaw,a=aw,c=1). The remaining parameter values are given inTables 5–7.
(here assumed to be 2). For the transient case, while the same remains generally true for high anode pressures, the simulations presented next indicate that variations in anode pressure have a more convoluted effect, depending, in particular, on the the water activity in the channels.
Fig. 7demonstrates that the steady-state experimental results in[47](Fig. 8of that paper) are qualitatively similar to potential sweeps from 1 to 0 V in 80 min, particularly for cell voltage away from the lower limit. Deviations from the steady-state trend arise at low values of anode channel pressure, for low cell voltage, where the performance deteriorates sharply. For an explanation we refer toFig. 8, the top row of which shows the evolutions of the saturation profiles for the two extreme cases inFig. 7:Pa=4 and 1.5 atm. Clearly, the anode floods as the channel pressure is reduced, restricting the access of H2to the Pt particle surfaces and causing the sharp drop in performance observed inFig. 7. The origin of the flooding is the low concentration of H2, which leads to almost complete consumption in a region (in both the electrolyte and gas phases) close to the membrane/ACL interface (see the middle row of figures), locally forcing the gas pressure to decrease and molar fraction of vapour,Xv, to increase; the net result is an increasing overpressureXvP−Psat(see the bottom row ofFig. 8) and therefore an increased rate of condensation, Sce, defined inTable 1and Eq.(14). Another important effect in this result will be the restricted back-diffusion of water through the membrane (from anode to cathode), compared to the case ofPa=4 atm, because of the drop in the current density. This will lead to a greater retention of dissolved, and therefore liquid, water in the anode. Of course, this phenomenon is exacerbated by the fully humidified channel condition,aw,a =1. In fact, for aw,a =aw,c=0.4, the flooding is not seen, as demonstrated on the right-hand side ofFig. 7. What is also noticeable is the bet-ter performance ataw,a=aw,c=1, which can be attributed to the greater membrane water content (and therefore increased protonic conductivity) on the cathode side.
For high anode channel pressure the best performance is gen-erally seen ataw,a=aw,c =1, again because of the increased protonic conductivity, particularly on the cathode side. This is
demonstrated in the polarization curves on the left-hand side of Fig. 9, for a range of channel humidity at the base-case anode pressure of 3 atm. Mass-transport limitations, arising from the cathode side, are noticeable at low cell voltage, manifested as an increasingly negative slope of the polarization curve: notice that the two casesaw,a=aw,c =1 andaw,a=aw,c =0.8 even-tually cross. The results inFigs. 7 and 9suggest that when CO is present in the anode stream the best performance is obtained for low anode pressure and high water activity in the cathode. When the cell is operated fully humidified in the anode channel there exists an optimal (low) anode pressure between 1.5 and 3 atm for which flooding in the anode can be avoided. Conversely, if the intention is to operate at an (low) anode pressure of 1.5 atm, there exist optimal channel water activities to avoid both flooding in the anode and severe mass-transport limitations in the cathode. A further non-trivial observation is that mass transport limi-tations in the cathode, typically a major concern, seem to be less apparent when CO is present in the anode stream, even at high water activity. The lower current density with a CO-fed anode is the likely explanation; it leads to reduced water production and, simultaneously, reduced back diffusion of dissolved water from anode to cathode.
The effect of changes in the channel temperatures, at a fixed channel pressure, is shown on the right-hand side of Fig. 9. In general an increased temperature will enhance performance, primarily because of the increased membrane conductivity (see the form ofσe inTable 7) and the resultant increased overpo-tential; the reaction rate (19) has an exponential dependence on overpotential, which outstrips the reduced concentration of reactants in the channels, on which the reaction rates have an algebraic dependence. This result on its own is not surprising but the transient aspect of the results does however reveal an important detail: as the temperature is lowered, in the upper part of the curve better performance is attained at fixed cell voltage. We refer toFig. 10, which compares the evolutions of surface coverage,θHandθCO, and volumetric H2oxidation rate,aqH,ox,
Fig. 10. The evolutions of surface coverages,θHandθCO, and H2 oxidation rate,aqH,ox, evaluated at the membrane/ACL interface,x=x3, in the two cases
Ta=60 and 80◦C on the right-hand side ofFig. 9. These correspond to a simulated potential sweep from 1 to 0 V in 80 min, with 50 ppm CO in 40%H2/N2and
aw,a=aw,c=1.
At the lower temperature CO (H2) coverage is lower (greater) up tot≈35 min, with the opposite being true beyond this time. This clearly influences the relative shapes of the profiles in Fig. 10. However, this highly non-linear behaviour is not easy to predict. The lower temperature leads to reduced CO and H2 adsorption rate constants through the Arrhenius activation ener-gies(29)and the Frumkin term in(26). The rate constant for CO adsorption,kCOads, experiences a more dramatic decrease than that for H2 adsorption,kadsH , and therefore dominates, starting from the initial conditions ofθCO=θH=0 and zero desorp-tion. The result is a lower CO coverage and (therefore) higher H2coverage. The desorption rate of CO increases asθCO→1. However, in this limit the ratio of desorption to adsorption is pro-portional to exp((−100+rθCO)/RT)≈exp(−60/RT), which is much smaller at the lower temperature. In other terms, the long-time value of CO coverage will be greater for the lower tem-perature, although in the early stages the CO coverage is lower. In summary, there is a sensitive balance between the decreas-ing rate of adsorption, decreasdecreas-ing rate of desorption and the
decreased membrane hydration at the lower temperature. The evolution of reaction rate seen on the right-hand side ofFig. 10 (and therefore the curves seen inFig. 9) is determined by this balance in a non-trivial way. Note that the final changes in the slopes of these curves at aroundt=50 min coincide with the second turning points (H2oxidation) in the polarization curves.
4. Mitigation techniques
4.1. O2bleeding: CO pulse simulation and temperature
effect
[image:16.637.94.496.538.709.2]A known method for preventing the degradation seen inFig. 2 is to inject air or neat O2 into the anode fuel stream, the so-called O2bleeding method. The results of a series of transient experiments investigating O2bleeding can be found in[50,51], in which the cell voltage is measured for a constant load with time-varying compositions of H2, CO and O2. It was also found in these and other studies that a degraded cell has the capacity
Fig. 12. Plots of O2, CO and H2surface coverages evaluated at the interface between the ACL and membrane,x=x3, corresponding to the examples on the right-hand side ofFig. 11for 4% and 0.1% O2bleeding at 0.6 V.
to recover when fed with CO-free H2, the extent of recovery depending on the initial input of CO and the poisoning and recovery times. We begin this section with simulations akin to the experiments in[50,51], instead calculating the current den-sity as the cell voltage is varied with time-varying compositions of H2, CO, O2 and N2. The main objective here is to demon-strate that qualitatively the outcome of such experiments can be predicted with the model.
We simulated 1 h of operation with 40%H2/N2/0 ppm CO in the anode and a fixed cell voltage (other parameters as in Tables 5–7), long enough to reach a steady current den-sity. A concentration of 50 ppm CO was then introduced into the anode mixture for a further 1 h. Beyond t= 2 h the CO concentration was alternately set to zero for 10 min and to suc-cessively increased values for 10 min, eventually set to zero until t=5 h. ForVcell=0.6 V the calculations were then repeated with 40%H2/0.1%O2/N2and 40%H2/4%O2/N2. The results are demonstrated in Fig. 11, the left-hand figure at three differ-ent cell voltages without bleeding and the right-hand figure
at two different O2concentrations (in the anode channel) for Vcell=0.6 V. From these plots we can make the following observations.
(1) The cell has a capacity to recover quite well by simply reversing to 40% H2, even at a low cell voltage, as observed in the experiments in[29,50,51].
[image:17.637.101.508.538.709.2](2) On these relatively short time scales O2 bleeding even at 4% does not significantly counter the poisoning effect when the CO concentration is high (particularly above 100 ppm), in agreement with the experimental results in[29,50,51]. Fig. 12 shows the evolutions of surface coverages eval-uated at the membrane/ACL interface for the two anode oxygen concentrations; the CO coverages in the two cases are increasingly closer as the CO concentration is increased. Although not a proof, this latter result provides an indication that, as is known from experiment, there is an upper limit to the ameliorating effect of bleeding.
A more striking feature of the transient operation is seen when the channel temperatures are varied. The left-hand side of Fig. 13compares bleeding with non-bleeding at two chan-nel temperatures (same in both chanchan-nels). These polarization curves are generated from simulated potential sweeps (1 V to 0 V in 80 min) with 25 ppm CO in 40%H2/N2/O2. The perfor-mance gain from bleeding is markedly greater at 70◦C, the lower temperature. Notice the shape of the two curves representing non-bleeding: the better performance in the upper part of the curve for the lower temperature is almost certainly influenced by the temperature dependence of the adsorption and desorption rate constants (see the preceding discussion onFig. 10and the right-hand side ofFig. 9). The same trend is observed in the two cases representing bleeding, but with the crossover of the two curves happening at a much lower cell voltage. The right-hand side ofFig. 13shows the evolution of CO, H2and O2coverages for the two cases with bleeding. Recall that a lower temperature leads to lower adsorption and desorption rate constants for H2 and CO with the decrease in the CO adsorption constant domi-nating. Moreover, the ratio of O2desorption to adsorption rate constant,bOads, is decreased by an order of magnitude at the lower temperature. We conjecture that this dependence (and that of the protonic conductivity) on temperature influence the result; how-ever, system(25)–(27)is simply too non-linear to unravel with a single example the exact path that leads to the profiles and curves inFig. 13. Adsorption, desorption, electro-oxidation and heterogeneous catalysis also depend non-linearly on the surface coverages, concentrations and overpotential, which are in turn influenced by other quantities. This point is not pursued fur-ther (apart from a brief discussion later) but is worthy of furfur-ther exploration, preferably in combination with experiment.
4.2. Effects of Pt–Ru alloys
By incorporating the bi-functional mechanism proposed by Watanabe and Motoo [39], in this section we investigate the role of Ru in designing ‘CO tolerant’ catalyst alloys. Modified versions of this mechanism have previously been employed for PEMFC, most notably by Camara et al.[35]and by Enb¨ack and Lindbergh[36]. Both cases are restricted to the kinetic problem in the anode, the former including H2(at steady-state) and the lat-ter neglecting it (with transient effects included). Here we use the dualistic approach in[36], in which it is assumed that CO adsorbs preferentially onto the Pt sites and water adsorbs preferentially onto the Ru sites, and that the adsorbed OH species are mobile enough to reach the Ru sites where CO is oxidized. It is assumed therefore that the surface electro-oxidation of CO by OH is dependent on the CO coverage on Pt and OH coverage on Ru. It is known that H2electro-oxidation on Ru is roughly two orders of magnitude smaller than on Pt[32], and is therefore neglected. Adsorption of water occurs at a significantly lower potential on pure Ru than on Pt[52], and so adsorption on Pt is not included as a simplification. Adsorption of CO on Ru is also considered small in this approximation, as in[36]. Though somewhat sim-plified, we shall demonstrate that this model captures several salient features and is qualitatively similar to a more complex model that includes CO adsorption and oxidation on Ru.
The (bi-functional) mechanism to be modelled (supplement-ing(23)) is
H2O adsorption on Ru : H2O+MOH–M+H++e−, CO electro-oxidation by OH on Pt :
CO–M+OH–MH++e−+CO2+2M (34)
In this dualistic approach the already-defined surface coverages are now assumed to be valid on the Pt sites only. The Ru sites are assumed to be occupied by OH, which has surface coverage θOHRu, or else free, with surface coverageθRuM
θCO+θH+θM=1, θRuOH+θRuM =1
assuming that there is no O2 present. The equations for the evolution of the coverages of CO (on Pt) and OH (on Ru) are therefore
ρdθCO
dt =qCO,ads−qCO,ox−qCO–OH,ox (35) ρRudθ
Ru OH
dt =qH2O,ads−qCO–OH,ox (36) where the extra terms (arising from(34)) are defined as
qCO–OH,ox=k1θOHRuθCOeFηa/2RTeβrθCO/RTeβ2r2θ Ru OH/RT
−k−1θRuMθMCCO2,ee−Fηa/2RTe−(1−β)rθCO/RT
×e−(1−β2)r2θRuOH/RT (37) and
qH2O,ads=k2CdθRuM eFηa/2RTe−β2r2θ Ru OH/RT
−k−2θRuOHe−Fηa/2RTe(1−β2)r2θRuOH/RT (38) It is assumed that the adsorption of water on Ru occurs from the dissolved phase, so that the right-hand side of Eq.(8)now contains an extra term in the ACL. Similarly, the ACL terms Sφe andSφs in Eq.(7) are modified to account for proton and electron generation in(34). Therefore, inTable 2we now have (for the ACL)
RHS of Eq. (8)= −Sad−Sdl−aRuqH2O,ads,
Sφe= −Sφs =aF(qH,ox+2qCO,ox+qCO–OH)+aRuFqH2O,ads (39)
Moreover, the active surface area of Pt,a, is now a function of the Pt–Ru ratio,rPt–Ru
a=aTrPt−Ru, aRu=aT−a
whereaTis the combined active surface area of Pt and Ru and aRuis the surface area of Ru.
Fig. 14. A demonstration of effects of changes in the ratio of platinum to ruthenium and in the channel temperatures. For a list of the remaining parameters and conditions seeTables 6 and 7.
k−1were adjusted. The selected value of k1was much larger than that used in[36], reflecting the competition between CO oxidation and the other mechanisms in(23)and(34), as well as the influence of the transport phenomena. Neither of these were not considered in[36].
Fig. 14shows the effect of changes in both the ratio of Pt to Ru and in the channel temperatures (other parameters as in Tables 5–7). These are again simulations of potential sweeps from 1 to 0 V in 80 min. The best performance is seen for a Pt–Ru ratio of 1–1 and the worst for pure Pt, with the perfor-mance for a Pt–Ru ratio of 1–9 intermediate between these two case, at both temperatures. The use of Pt–Ru involves a trade-off between increased CO electro-oxidation (by the OH species) occurring at low potentials on the Ru, and decreased H2 oxida-tion on the Ru poroxida-tion of the catalyst surface, implying that there is an optimal ratio of Pt to Ru surface area (or volume) at which the best performance on reformate is achieved. This result is in agreement with the experiments in[54](and refer-ences therein), where the authors concluded an optimal Pt–Ru
ratio of between 1–1 and 1–3. Moreover, it supports the appli-cability of the bifunctional mechanism(34). The results shown inFig. 14suggest that at elevated temperatures the effect of Ru on the performance is less visible, matching the conclusion in [54]. The reasons for this will include the temperature effect on membrane conductivity and on CO adsorption and desorption already encountered inFig. 9.
Adsorption of CO on Ru was neglected in the model above. Assuming that adsorption and oxidation can be modelled with Eq.(26), i.e. the following equation for CO on Ru is added to (35):
ρRu dθCORu
dt =k CO adse−βrθ
Ru
CO/RT(CCO,eθRu
M −bCOadsθRuCOerθ Ru CO/RT)
−2kCO
ox θCO sinh
Fηa 2RT
(40)
[image:19.637.101.509.551.728.2]the results are qualitatively the same if the rate constants are adjusted. In Fig. 15 the results at 60◦C in Fig. 14 are