QLK5-2002-02400
WP 2: “Data collection and processing systems (DCPS)
for the conventional markets”
and
WP 3: “Data collection and processing systems for
organic markets”
Deliverable D2
Sjaak Wolfert and Klaas Jan Kramer
(Landbouw Economisch Institut)
Toralf Richter and Gabriele Hempfling
(Forschungsinstitut für biologischen Landbau)
Susanne Lux (Zentrale Markt- und Preisberichtstelle)
Guido Recke (University of Kassel)
May 2004
Responsible for the work packages:
-
WP2: “Data collection and processing systems (DCPS) for the
conventional markets”
Agricultural Economics Research Institute (LEI)
Klaas Jan Kramer, Sjaak Wolfert
P.O. Box 29703
Burgermeester Patijnlaan 19
NL-2502 LS Den Haag
The Netherlands
Tel.: +31 (0) 79 3358 330
[email protected]
-
WP3:”Data collection and processing systems (DCPS) for organic
markets”
Research Institute of Organic Agriculture (FiBL)
Toralf Richter, Gabriele Hempfling
Ackerstrasse
CH-5070 Frick
Switzerland
Tel.: +41 (0) 865 72 72
[email protected]
Authors of the chapters:
-
Sjaak Wolfert, Klaas Jan Kramer (LEI): Chapter 1, 2.3, 5.1
-
Toralf Richter, Gabriele Hempfling (FiBL): Chapter 2.2, 3.3, 3.4,
4, 5.3, 6
-
Susanne Lux (ZMP): Chapter 2.1, 3.1, 3.2, 5.4, 5.5
Table of Contents
1 Introduction... 1
1.1 Objectives of work packages 2 and 3... 1
1.2 Approach and methods ... 2
1.2.1 Sub-regional approach... 2
1.2.2 Questionnaires and actor levels ... 3
1.2.3 Country reports ... 4
1.2.4 Country tables ... 5
2 International statistical and data collection systems within the food supply chain at the public level... 6
2.1 Food and Agriculture Organisation of the United Nations (FAO)... 6
2.1.1 Codex Alimentarius ... 6
2.1.2 General Data Approaches... 7
2.1.3 Organic Data Approaches ... 10
2.1.4 FAO’s Data Collection... 11
2.2 Organisation of Economic Co-operation and Development (OECD) ... 13
2.2.1 Statistics on Agriculture and Fisheries ... 14
2.2.2 International Trade Statistics... 16
2.2.3 Statistics on Organic Agriculture ... 17
2.3 Eurostat... 18
2.3.1 Agriculture ... 18
2.3.2 Trade... 23
2.3.3 Consumption ... 24
3 International statistical and data collection systems within the food supply chain at the private level ... 29
3.1 ACNielsen ... 29
3.1.1 Retail Panel “Market*Track” ... 29
3.1.2 Consumer Panel “Homescan” ... 29
3.2 GfK ... 31
3.2.1 GfK Consumer Scan ... 31
3.2.2 IRI Retail Panel ... 32
3.3 TNS (Taylor Nelson Sofres) / EMNID... 33
3.3.1 Consumer Panel / Superpanel ... 33
3.3.2 Organic data collection... 34
3.4 EU Projects in regard to Data Collection ... 35
3.4.1 OFCAP: Effects of the CAP-Reform and possible further developments on organic farming in the EU (1993-1997)... 35
3.4.2 OMIaRD: Organic Marketing Initiatives and Rural Development... 35
4 National Statistics and Data collection systems within the food supply chain.... 38
5 Analysis of the results with regard to organic DCPSs per actor level ... 39
5.1 Farm Level ... 39
5.1.1 Introduction ... 39
5.1.2 Material and methods... 39
5.1.3 Results ... 40
5.1.4 Discussion... 40
5.1.5 General conclusions... 42
5.2 Wholesaler / Processor Level... 48
5.2.1 Brief introduction ... 48
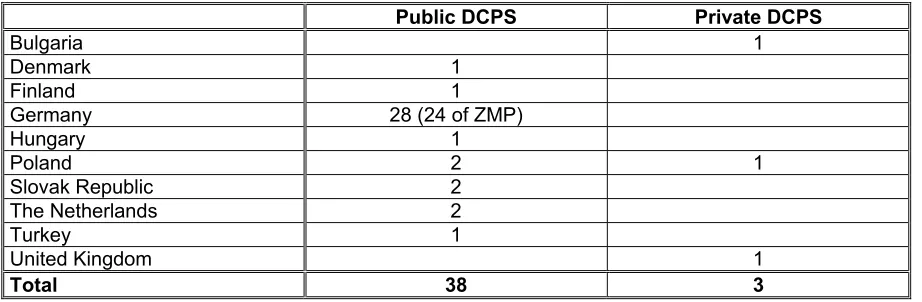
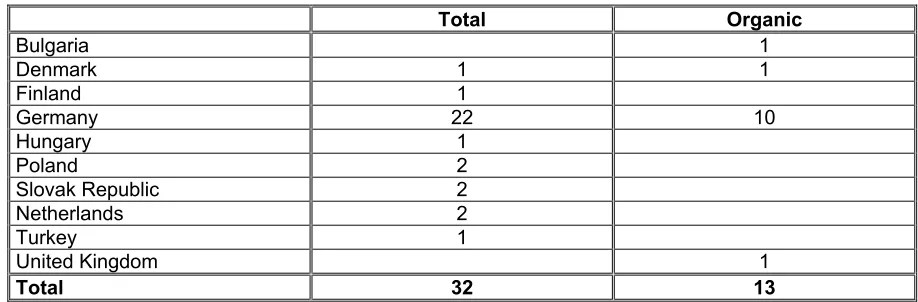
5.2.3 Results of survey conducted in 32 European countries ... 48
5.2.4 Conclusion ... 57
5.3 Foreign Trade Level ... 58
5.3.1 Brief Introduction ... 58
5.3.2 Eurostat Foreign Trade Statistics ... 58
5.3.3 Overview of national DCPS on Foreign Trade Level... 61
5.3.4 Comparison of existing organic DCPSs on Foreign Trade Level ... 66
5.4 Retail Level ... 69
5.4.1 Denmark... 71
5.4.2 Germany ... 71
5.4.3 Italy ... 72
5.4.4 Switzerland... 72
5.4.5 The Czech Republic... 72
5.4.6 Conclusion ... 73
5.5 Consumer Level ... 74
5.5.1 Consumer DCPSs on the European level in the public sector ... 74
5.5.2 Consumer DCPSs in the private sector at the European level ... 76
6 Summary and conclusions ... 80
ANNEX 1 COUNTRY REPORTS
List of Abbreviations
Table 2-1: Agricultural data collections of FAO being available on the Internet... 9
Table 2-2: Items for products and analysed rows ... 10
Table 2-3: Available Data on Organic Farming in the Member States... 22
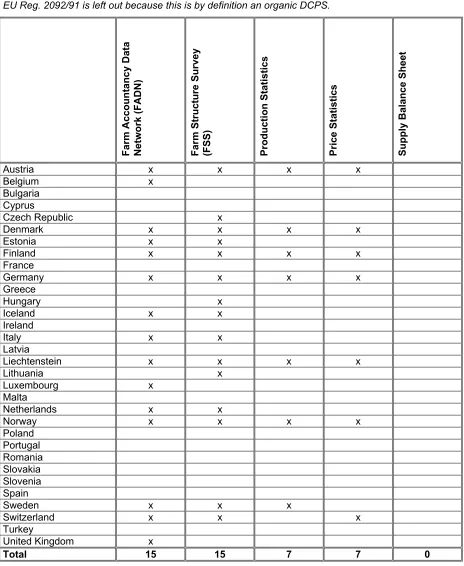
Table 5-1: European overview of 32 countries on presence of DCPSs that include organic data and cover the most relevant product groups or farm types, categorized by several types. ... 43
Table 5-2: European overview of 32 countries on presence of DCPSs in which organic data is distinguishable, categorized by several types. ... 44
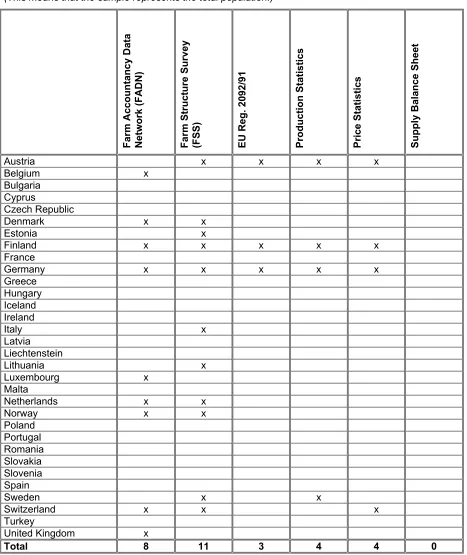
Table 5-3: European overview of 32 countries on presence of DCPSs based on a census or representative approach, categorized by several types. ... 45
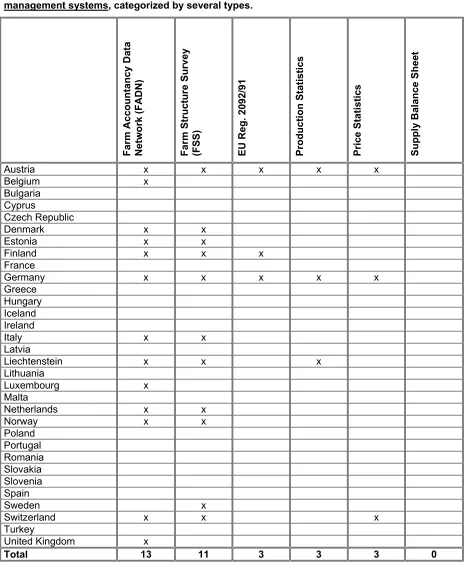
Table 5-4: European overview of 32 countries on presence of DCPSs that run data quality management systems, categorized by several types... 46
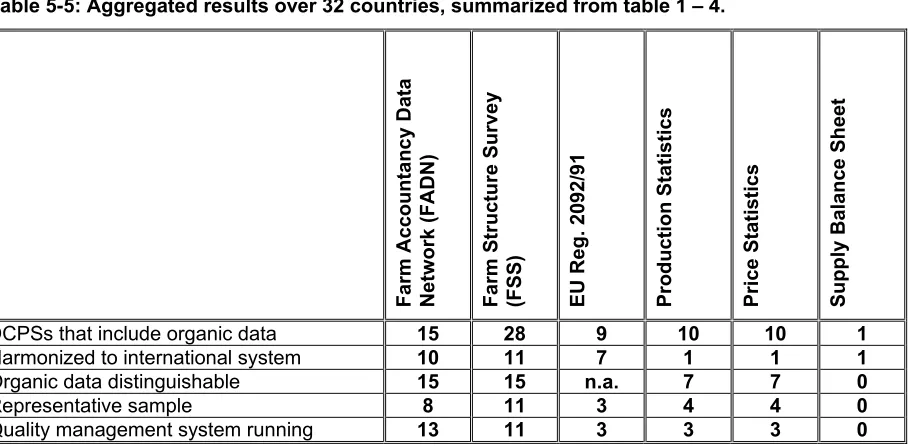
Table 5-5: Aggregated results over 32 countries, summarized from table 1 – 4... 47
Table 5-6: Public and private DCPS ... 48
Table 5-7: Total and organic DCPS... 49
Table 5-8: Harmonized / not harmonized DCPSs to a European system ... 50
Table 5-9: Integration of organic data... 50
Table 5-10: Reasons why organic data is not included and not distinguishable ... 51
Table 5-11: Number of processor and wholesaler DCPSs ... 51
Table 5-12: Types of data collected in the supply chain of total data ... 52
Table 5-13: Types of data collected in the supply chain of organic data ... 52
Table 5-14: Criteria used for segmentation of the market... 53
Table 5-15: Levels of data collection on wholesale / processor level ... 53
Table 5-16: Representativeness of data... 54
Table 5-17: Data provided for product groups (total) ... 54
Table 5-18: Data provided for product groups (organic) ... 54
Table 5-19: Representativeness of DCPSs for product groups in percent (total) .... 55
Table 5-20: Representativeness of DCPSs for product groups in percent (organic) 55 Table 5-21: Comparison between organic and total data ... 55
Table 5-22: Frequency of data collection... 56
Table 5-23: Data quality management... 56
Table 5-24: Main medium of data dissemination ... 57
Table 5-25: Overview of the existing DCPSs on foreign trade in Europe (not complete)... 61
Table 5-26: Overview of DCPSs on the retailer level in Europe ... 70
Table 5-27: Overview of organic data collection by GfK and ACNielsen by product group ... 77
Figure 6-1: Project approach to get information about statistics on existing DCPSs on different actor levels ... 82 Figure 6-2: Evaluation of existing DCPSs which contain organic farming data per
1 Introduction
European markets for organic products are developing fast. In Europe, as other parts of the world, more and more farm land is being converted to organic production. In order to adjust production and consumption levels, detailed market information is needed, especially where decisions with a long-term impact need to be taken, for example on converting specific land or livestock enterprises requiring high levels of investment in glasshouses, housing, processing facilities etc. Since public subsidies (regional / national / European) are heavily involved in these investments, valid, accurate and up-to-date information is essential not only for farmers and growers, but also for policy-makers, consultants, processing industry etc.
EU-research projects such as OFCAP (FAIR3-CT96-1794) and OMIaRD (QLK5-2000-01124) have shown that regional or national data gathering takes place in many countries, but often only very basic data are reported, such as certified organic holdings, land areas and livestock numbers. Important market data, e.g. the amount of production, consumption, international trade or producer and consumer prices, do not exist in most European countries. In some European countries there are only rough estimates of the levels of production and consumption. There is no standardization and data are seldom comparable. Furthermore, detailed information on specific commodities is missing. Hence, investment decisions are taken under conditions of great uncertainty. Likewise, if politicians want to support organic agriculture, they do not know whether it would be better to support production or consumption or to address problems in the marketing channel.
The EU concerted action EISfOM (QLK5-2002-02400) (European Information System for Organic Markets) is attempting to take the first steps in solving these problems. The aim of this concerted action is to build up a framework for reporting valid and reliable data for relevant production and market sectors of the European organic sector in order to meet the needs of policy-makers, farmers, processors, wholesalers and other actors involved in organic markets.
In order to reach this aim, this action was split into several workpackages. This report describes the approach and results of workpackages 2 and 3. In this first chapter the objective and general approach of these work packages will be described.
Chapters 2 and 3 provide an overview of international statistics and data collection systems within the food supply chain at the public and the private level. Chapter 4 describes national statistics and data collection systems within the food supply chain. In Chapter 5, an analysis and appraisal is made of the results with regard to organic data collection and processing systems (DCPSs) and their integration into existing common DCPSs. Chapter 6 draws several general conclusions. Two substantial annexes complete the report, one with the country reports on the situation of data collection and processing in all investigated countries and the other with the first and the second stage questionnaires covering the different data collection levels.
1.1 Objectives of work packages 2 and 3
The overall objective of WP2 and 3 could be described as the review of existing systems of data collection and processing for organic as well as conventional markets in order to understand their characteristics and identify opportunities for development and improvement.
this report. It includes a description of existing data collection and processing systems for conventional markets in order to develop reference models or identify possibilities to merge systems. This reports covers all 15 EU countries, all 13 candidate/applicant states and 4 EEA countries.
The specific objectives for WP2 were:
• to collate information on existing data collection and processing systems (DCPSs) for conventional markets
• to analyse these systems in order to develop reference models for organic market information systems.
Partner 9 (LEI, The Netherlands) was mainly responsible for this work package with assistance of Partner 5 (ZMP, Germany).
The specific objectives for WP3 were:
• to collate information on existing data collection and processing systems (DCPSs) for organic markets
• to compare conventional and organic DCPSs
• to make suggestions for the harmonization of organic DCPSs within existing conventional DCPSs.
Partner 2 (FIBL, Switzerland) was mainly responsible for this work package with assistance of Partner 10 (University of Kassel, Germany).
Workpackages 2 and 3 have been merged for practical reasons since there was a good deal of overlap - it was realised that the same institutions would have been contacted for both WP2 and WP3. Therefore a single questionnaire covering WP2 and WP3 was developed to avoid contacting the same institution repeatedly and thus to burden them as little as possible.
1.2 Approach and methods
1.2.1 Sub-regional approach
A sub-regional approach was adopted, with sub-regional coordinators responsible for the collation of information in their sub-regions and for the production of working (review) papers synthesising the results. They were responsible for liaising with experts, stakeholders and statistical offices or other institutions. They played an active role in communication with national statistical offices and other key players in their region as well as in making proposals for experts to be invited to the European seminars.
Sub-regions are defined as:
West (United Kingdom, France, Ireland)
Coordinator: University of Wales Aberystwyth (UWA), United Kingdom
Central 1 (Germany, Slovakia, Spain)
Coordinator: Zentrale Markt- und Preisberichtstelle für Erzeugnisse der Ernährungs-, Land- und Forstwirtschaft (ZMP), Germany:
Central 2 (Switzerland, Turkey, Liechtenstein)
Central 3 (Austria, Slovenia, Romania, Bulgaria)
Coordinator: Leopold Franzens Universität Innsbruck (Uni lbk), Austria:
Central 4 (Czech Republic, Hungary)
Coordinator: University of Kassel (Uni K), Germany:
Mediterranean (Italy, Greece, Portugal, Malta, Cyprus)
Coordinator: Università Politecnica delle Marche (Uni Ancona), Italy:
Scandinavia (Denmark, Norway, Sweden, Finland, Iceland)
Coordinator: Danish Research Centre for Organic Farming (DARCOF), Denmark:
East (Poland, Estonia, Lithuania, Latvia)
Coordinator: Warsaw Agricultural University (WAU/SGGW), Poland:
Benelux (Belgium, The Netherlands, Luxembourg)
Coordinator: Agricultural Economics Research Institute (LEI), The Netherlands:
1.2.2 Questionnaires and actor levels
To collate the required information, questionnaires were prepared. First, an introductory questionnaire (Q1) was sent out requesting general information on the relevant organisations and their data collection and processing activities and offering the opportunity to become a member of the project. In return for collaboration in responding to questionnaires and other requests for information, members are given access to unpublished project reports, e-mail discussion groups and the membernet pages of the project website www.eisfom.org, together with the chance to participate in the two European seminars. The format of Q1 can be found in Annex 2.
Using the information from Q1, a second set of questionnaires (Q2) was sent out, asking for more detailed information about the Data Collection and Processing Systems (DCPSs), which the organisations run. Based on the information from Q1, Q2 was developed for different actor levels relevant to organic agriculture. The actor level is the level on which data are collected, for example directly at the farm on the farm / production level. The DCPS on a particular level does not necessarily provide information only on this level, e.g. a DCPS on the retailer level offers also data on consumer behaviour.
The following levels were defined for the second stage questionnaire (Q2):
Production (Farm) Level
Structural data about agriculture; price data on farm level; farm accountancy data; production volume and value data when gathered on farm level
The farm level is split up into several existing standard systems: • Farm Accountancy Data Network (FADN)
• Farm Structure Survey (FSS) • EU Regulation 2092/91 • Production statistics • Price statistics
Production volume and value, price data, turnover, market trends / forecasts
Import / Export Level
Import and export volumes
Retailer Level
Data on sales volumes and values at the retailer level
Consumer level
Data about food consumption, household expenditures and consumer prices for food
The set of Q2 questionnaires for each of these levels can be found in Annex 2. All questionnaires, in English, German and French versions, were made generally available through the project website as well as being sent directly to the contacts who had been identified.
The questionnaires could be filled out electronically and most respondents used this option, which made the process easier. The results were collected centrally by LEI and were entered into a database, using the program WinEnquete. From this database it was possible to generate the total output in SPSS or Excel.
1.2.3 Country reports
The results of the Q1 and Q2 surveys were used to compile the country reports, which describe the actual state of the art of data collection and processing with regard to organic farming in each country. The sub-regional coordinators were responsible for compiling the reports on each of their countries.
In the country reports, first the national relevance of organic farming is described, for example numbers and percentage of farms and organic areas, market size, import/export market orientation. Further a rough overview of the structure of national public and private statistic/data providers in the areas of agriculture and food production is given. The results of the first inquiry (Q1) give the number of surveyed institutions, response rate and response structure, a short introduction to the profile of the main national data providers by actor levels (type and main function of organisation, private or publicly funded, etc.) and the presentation of institutions which run ‘organic DCPSs’. Also the results of the second stage inquiry (Q2) are given: the number of institutions surveyed, response rate and response structure, overview of existing DCPSs by actor level and detailed information about DCPSs which include organic data collection. The conclusions assess the current national situation of data collection for the organic market, concerning
• data availability • data quality
• main data gaps by actor level
• strengths and weaknesses of existing DCPS.
information identified during the first EISfOM seminar in Berlin in April 2004. Country reports for all the countries investigated are included as Annex 1.
1.2.4 Country tables
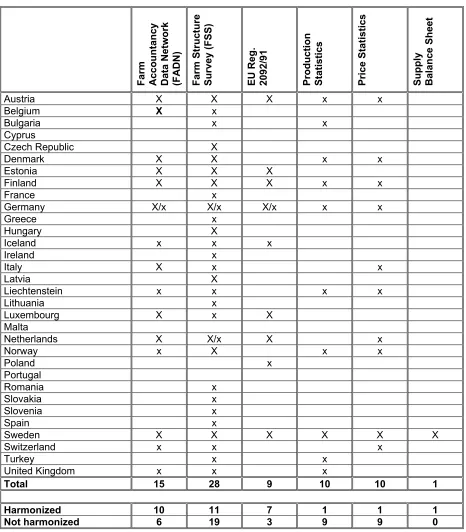
The country reports contain detailed information that can be used to carry out future activities. However, there was a need to have a concise overview of most relevant information for future development of the European information system. Therefore tables were developed for each actor level, ticking the answers to 7 key questions on the existence of DCPSs. The farm level was further split up into several existing standard systems:
• Farm Accountancy Data Network (FADN) • Farm Structure Survey (FSS)
• EU Regulation 2092/91 • Production statistics • Price statistics
• Supply Balance Sheets
A further distinction was made by indicating if these systems were harmonized to an international system or not.
2 International statistical and data collection systems
within the food supply chain at the public level
Chapter 2 gives an overview of public international organisations running DCPSs in different countries. It is shown that several DCPSs on international level already exist covering all levels from production to consumption, but in most international DCPSs organic data are not distinguishable or collected separately from total data. Since this shows potential for integration, the institutions running international DCPSs and their data collection and processing systems are presented in the following chapter.
2.1 Food and Agriculture Organisation of the United Nations (FAO)
2.1.1 Codex AlimentariusThe Codex Alimentarius Commission implements the Joint FAO/WHO Food Standards Programme, the purpose of which is to protect the health of consumers and to measure fair practices in the food trade. The Codex Alimentarius is a collection of internationally adopted food standards, presented in a uniform manner.
It also includes provisions of an advisory nature in the form of codes of practice, guidelines and other recommended measures to assist in achieving the purposes of the Codex Alimentarius.
In view of growing production and international trade in organically produced foods, the Codex Committee on Food Labelling developed the Guidelines for the Production, Processing, Labelling and Marketing of Organically Produced Foods to facilitate trade and prevent misleading claims. The guidelines are intended to facilitate the harmonization of requirements for organic products at the international level, and may also provide assistance to governments wishing to establish national regulations in this area.
The Codex Alimentarius also mentions that labelling products as “organic” implies a duly constituted certification body or authority has certified them. An integral component of certification is the inspection of the organic management system.
This definition of organically produced food provides an international baseline for distinguishing data from the organic sector from data from other food production systems and economic activities.
2.1.2 General Data Approaches
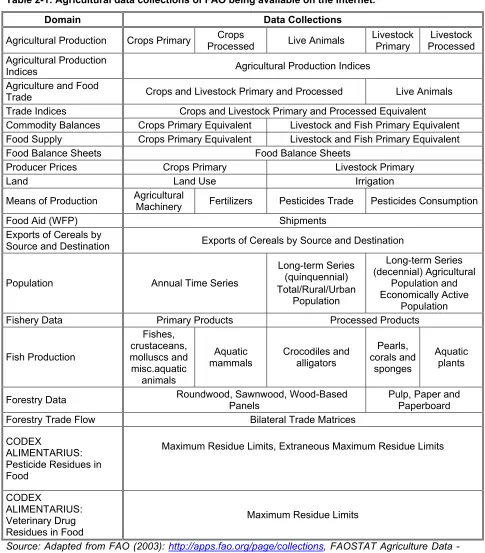
The Food and Agriculture Organisation of the United Nations (FAO), as part of its mandate, compiles information and data on various aspects of food and agriculture from all countries. The data are analysed and interpreted to support FAO's programmes and activities and, in accordance with the basic functions of the organisation, they are disseminated to the public through publications, CD-ROM, diskettes and the Internet (http://faostat.fao.org).
The user interface to the database provides data under eighteen domains. The data can be broadly classified into three groups:
• country-level data referring to items such as agricultural production and trade, producer prices, land use, means of production etc.
• derived data such as agricultural production and trade indices, food supply etc.
• data referring to items such as population and labour force that are derived by, or in collaboration with, other international agencies.
Country-level data are collected through
• tailored questionnaires sent annually to member countries,
• magnetic tapes, diskettes, FTP-transfers and accessing national websites,
• national/international publications,
• country visits made by the FAO statisticians and • reports of FAO representatives in member countries.
However, many developing countries still do not have an adequate system of statistics pertaining to the agricultural sector. Some of the available agricultural data are incomplete in terms of:
• range of commodities covered (for example, only cash crops for large farms are covered),
• range of variables or data sets covered (for example, in many countries data on agricultural inputs are virtually unavailable),
• national coverage (certain regions of the country are sometimes not covered by the national statistical reporting system).
Table 2-1: Agricultural data collections of FAO being available on the Internet.
Domain Data Collections
Agricultural Production Crops Primary Processed Crops Live Animals Livestock Primary Processed Livestock
Agricultural Production
Indices Agricultural Production Indices
Agriculture and Food
Trade Crops and Livestock Primary and Processed Live Animals Trade Indices Crops and Livestock Primary and Processed Equivalent Commodity Balances Crops Primary Equivalent Livestock and Fish Primary Equivalent Food Supply Crops Primary Equivalent Livestock and Fish Primary Equivalent
Food Balance Sheets Food Balance Sheets
Producer Prices Crops Primary Livestock Primary
Land Land Use Irrigation
Means of Production Agricultural Machinery Fertilizers Pesticides Trade Pesticides Consumption
Food Aid (WFP) Shipments
Exports of Cereals by
Source and Destination Exports of Cereals by Source and Destination
Population Annual Time Series
Long-term Series (quinquennial) Total/Rural/Urban Population Long-term Series (decennial) Agricultural Population and Economically Active Population
Fishery Data Primary Products Processed Products
Fish Production Fishes, crustaceans, molluscs and misc.aquatic animals Aquatic
mammals Crocodiles and alligators
Pearls, corals and
sponges
Aquatic plants
Forestry Data Roundwood, Sawnwood, Wood-Based Panels Pulp, Paper and Paperboard
Forestry Trade Flow Bilateral Trade Matrices
CODEX
ALIMENTARIUS: Pesticide Residues in Food
Maximum Residue Limits, Extraneous Maximum Residue Limits
CODEX
ALIMENTARIUS: Veterinary Drug Residues in Food
Maximum Residue Limits
Source: Adapted from FAO (2003): http://apps.fao.org/page/collections, FAOSTAT Agriculture Data - Data Collections
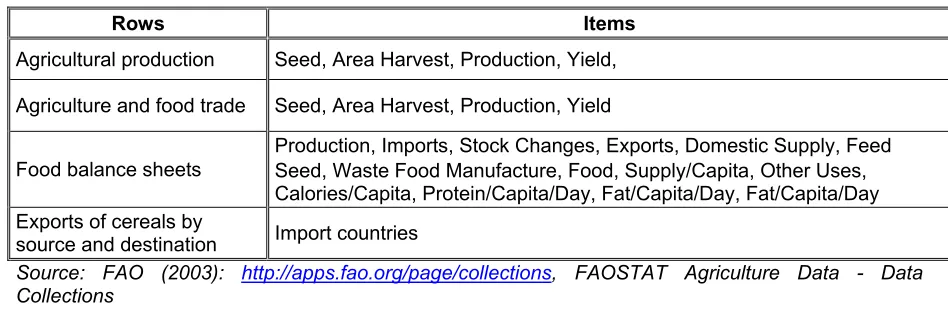
Table 2-2: Items for products and analysed rows
Rows Items
Agricultural production Seed, Area Harvest, Production, Yield,
Agriculture and food trade Seed, Area Harvest, Production, Yield
Food balance sheets
Production, Imports, Stock Changes, Exports, Domestic Supply, Feed Seed, Waste Food Manufacture, Food, Supply/Capita, Other Uses, Calories/Capita, Protein/Capita/Day, Fat/Capita/Day, Fat/Capita/Day Exports of cereals by
source and destination Import countries
Source: FAO (2003): http://apps.fao.org/page/collections, FAOSTAT Agriculture Data - Data Collections
The data can be requested as tables or CVS-files. Data are available for several products and countries for the years from 1961 to 2002.
The following statistics of the data can be requested: • basic statistics
• mean
• standard deviation • exponential growth • three year average • centre moving average • per capita
• weighted average.
2.1.3 Organic Data Approaches
In the project Priority Area for Inter-disciplinary Action on Organic Agriculture (PAIA/ORGA), FAO tries to reach two aims:
• assisting member countries, including both the public and private sectors, to access rapidly and easily a global and up-to-date picture of the current state of organic agriculture
• providing support to the organic community through the reciprocal exchange of information on organic agriculture in different countries.
Priority Area for Inter-disciplinary Action on Organic Agriculture (PAIA/ORGA) is divided into two phases:
• designing and developing a computerized system for input, storage and analysis of existing country data on organic agriculture.
• updating and maintaining a network of regional and national institutions
This information on production and trade in organic agricultural products will be particularly helpful in orienting investments in conversion to organic systems and successful marketing of organic products.
Other homepages with data on marketing and trade or statistical information are linked with the FAO organic agriculture website (e.g. OFMA, FiBL). The Organic Europe site contains links to country reports on organic farming in 25 European countries, EU documents and European organic farming statistics, an address database of organic organisations in Europe and a resources site including links to other organic farming related sites. A section on news also provides information on recent and forthcoming organic events.
FAOs reports are available as documents which can be downloaded.
The database on organic agriculture will be developed by the PAIA/ORGA. FAO’s role will be to initially develop a data collection and retrieval system on organic agriculture. In a second stage, FAO will coordinate data processing and information management to assist collaborating institutions who will maintain and update their country information in the long term.
The strategy is based on the implementation of a single global information system that, in its second phase, will promote the development of national information systems with similar structures, linked by a communication network. In the long term, end users (producers, operators, traders, researchers and institutions) will access the network through their own national system. Each national system will be fed by sources already existing in the country. National systems will communicate with each other through regional centres, which will act as the hub station. Regional centres will connect the national systems with remote systems, such as the FAO system.
2.1.4 FAO’s Data Collection
The aims of FAO in organic farming are described as “launching a cross-sectoral programme on organic agriculture. FAO’s activities will cover the provision of information and cost-effective discussion on organic production and trade, institutional support and policy advice to members, facilitation of research, extension and networking, technical assistance for developing skills, organic standards and certification capacities and pilot projects that explore and promote feasible organic agricultural techniques.”
“FAO has recently begun developing a questionnaire to collect information from its member countries. After a testing phase, this questionnaire will be reviewed in order to establish a standard system for data collection on organic produce and trade. Awaiting data generation and dissemination in the form of FAO statistical yearbooks on organic agriculture, Country Profiles on Organic Agriculture are being compiled (expected release date: 2004).”
The objectives of the questionnaire are introduced as: • developing standards for collection of data
FAO tries to facilitate establishing and/or strengthening national public-private dialogue, as most organic agriculture information is to be found with non-governmental organisations and other private and civil society organisations.1
1References in this chapter:
- FAO (2003): Organic Agriculture at FAO – Country data,
http://www.fao.org/organicag/doc/Questionnaire.doc, Chpt. Objectives of the questionnaire last retrieved at 22. 12. 2003
- FAO, 2003: Organic Agriculture at FAO - Country data, http://www.fao.org/organicag/frame6-e.htm, last retrieved 22. 12. 2003
- FAO (2003): http://apps.fao.org/page/collections, FAOSTAT Agriculture Data - Data Collections
- Nadia El-Hage Scialabba, 28 January 2003, DATABASE ON ORGANIC AGRICULTURE
- Organic Europe 2003: http://www.organic-europe.net/default.asp, last retrieved 22. 12. 2003
2.2 Organisation of Economic Co-operation and Development
(OECD)
The Organisation of Economic Co-operation and Development (OECD) groups 30 member countries sharing a commitment to democratic government and the market economy. With active relationships with some 70 other countries, NGOs and civil society organisations, it has a global reach. The work covers economic and social issues from macroeconomics, to trade, education, development and science.
The OECD runs agreements with almost all other international organisations regarding data transfer. It monitors developments in member countries and in key non-member countries by comparable statistics. The OECD disseminates a very large amount of statistics to external users. The comparability and reliability of these statistics is ensured by the continuous development and adoption of international statistical standards and best methodological practice. The OECD also develops new types of statistics, new statistical standards and statistical systems itself, mostly in co-operation with national statistical offices, central banks, government agencies and other international organisations. Statistical activities vary from data collection, transformation and dissemination to development.
In co-operation with Eurostat, OECD has developed a glossary of statistical terms with the main statistical definitions.
Some of the core values of the OECD in producing statistics are to guarantee impartiality, to co-operate with national statistical agencies and other international organisations and to ensure quality by a quality management system including coverage, timeliness, comparability, accessibility, use of modern methods and standards for data and metadata collection, storage and dissemination. Therefore dialogue and cooperation with stakeholders and others are improved, together with the visibility of and access to OECD statistics, the tools for collection, storage and management of data and metadata and the interrelationships with national data providers and other international organisations.
IMF (International Monetary Fund), Eurostat, Statistics Canada and other NSOs (National Statistics Offices) have identified various sets of data quality components and have adopted quality frameworks to improve their organisations and the quality of data produced. Based on this, the OECD developed a framework, in which quality and its dimensions are defined (relevance, accuracy, credibility, timeliness, punctuality, accessibility, interpretability, coherence). Further the procedures for assuring the quality of proposed new statistical activities and for evaluating the quality of existing statistical activities on a regular basis are defined. Internal quality guidelines have been developed covering all phases of the statistical production process.
The OECD co-operates with the United Nations Statistical Commission, the Conference of European Statisticians, the Statistics Committee of the UN Economic Commission for Asia and the Pacific and the Eurostat Statistical Programme Committee. In addition data sharing exists with Eurostat, the European Central Bank, the Bank for International Settlements, the International Monetary Fund and the Statistical Division of the United Nations.
countries) and to support the development of statistics in transition, emerging and developing countries, together with the UN Statistical Division and other international organisations.
The organisation of statistical activities in the OECD is based on a “decentralised model”, which means that various statistics are developed both by the Statistics Directorate (STD) and by directorates responsible for analytical studies and policy analyses. STD is responsible for macroeconomic statistics (e.g. international trade) and for some social and business statistics. Most other statistical activities within the OECD are carried out in eight directorates:
⇒ Economics (ECO)
⇒ Employment, Labour and Social Affairs (ELSA) ⇒ Education (EDU)
⇒ Science, Technology and Industry (STI) ⇒ Financial, Fiscal and Enterprise Affairs (DAF) ⇒ Environment (ENV)
⇒ Public Governance and Territorial Development (GOV) ⇒ Development Co-operation (DCD).
The statistical information is disseminated by paper or electronic publications, the
Statistical Portal on the website (www.oecd.org), by statistical press releases, by the
OECD Statistical Newsletter and the new publication Statistics Brief. All OECD methodological publications and documents are freely available on the Statistical Portal, as well as the OECD Glossary of Statistical Terms. In addition, a wide selection of data is freely available. All other publications have to be paid for.
The OECD identifies four main categories of users for its statistics. Each category has different rights and tools for accessing OECD data. The general public has free access to basic statistics through the Statistical Portal, can purchase data from the on-line bookshop or purchase subscriptions to published data files from
SourceOECD or selected OECD data from commercial data resellers. The media has privileged access to SourceOECD and gets information from the public relations office. Officials in member countries and in other international organisations have access to all published OECD data through OLISnet (OECD Online Information Services) and the OECD Secretariat Staff members have general access to OECD internal databases.
Most data are collected and processed on an aggregated level, for example average prices for a commodity such as beef and veal.
2.2.1 Statistics on Agriculture and Fisheries
The OECD keeps several statistical databases on agriculture and fishery, which are described in the following. The most important ones are the Agricultural Commodities Outlook Database (1970–2008), the Agricultural Policies in Emerging and Transition Economies (1990-2002), the Agricultural Support Estimates (1986-2002) and the
The Agricultural Commodities Database
The Agricultural Commodities Database provides an annual update of statistical information and projections by country to 2008 for production, consumption, trade, stocks and prices for temperate zone agricultural products in OECD countries and selected information on other countries, including Argentina, Brazil, China, Russia and the other independent states of the former Soviet Union. Aggregate results are also provided for the OECD and non-OECD areas as well as for the world. Supply and use balances for cereals, oilseeds, meat and dairy products are presented.
Most series cover the period from 1970 to the most current year and include updated annual projections for up to five years in the future. The database also includes the results of analysis looking at the impacts on these medium-term projections of alternative assumptions on important markets and policy variables.
The results are published in the OECD Agricultural Outlook where data on economic assumptions, world prices, main policy assumptions for cereal markets, world cereal projections, main policy assumptions for oilseed markets, world oilseed projections, main policy assumptions for meat markets, OECD meat projections, main policy assumptions for dairy markets, world dairy projections (butter and cheese, powders and casein), OECD trade projections, main policy assumptions for sugar markets and world sugar projections (in raw sugar equivalent) are included. The data are collected annually by a questionnaire.
Agricultural Market Access
The Agricultural Market Access Database contains a common data set on tariffs (scheduled and applied), tariff-rate quotas (scheduled and applied) and imports so that researchers, policymakers and others can analyse the levels of tariff protections in agriculture among WTO members. The development and use of a common data set can assist in improving international transparency of agricultural trade as covered by multilateral rules and disciplines.
The database has been placed on the worldwide web where it has been accessed by over 7,000 users in the first year. The data has been used to provide tariff profiles of several countries by co-operative effort with Agriculture and Agri-Food Canada, the EU Commission – Agriculture Directorate-General, the Food and Agriculture Organisation of the United Nations (FAO), the World Bank, the United Nations Conference on Trade and Development and the United States Department of Agriculture (Economic Research Service).
Agricultural Policies in Emerging and Transition Economies
The Agricultural Policies in Emerging and Transition Economies database provides a unique collection of internationally comparable and policy-relevant macroeconomic and key agricultural indicators covering 21 emerging and transition economies. The data includes a set of comparative PSE (producer support estimate)/CSE (consumer support estimate) data for Russia and six other transition economies for the period 1986-2001 applying the same internationally recognised methodology as for OECD members.
The database aims to provide data for calculations of support (PSE/CSE), for papers and meetings of the Global Forum on Agriculture, for the annual flagship publication
Economies and for various technical meetings. Besides publication in the Watch on Support, the database is freely available on the OECD public website.
The PSE database is widely used internally by the IMF (International Monetary Found), WTO (World Treaty Organisation), researchers, universities and governments of both OECD member and non-member countries. It is of particular interest in the context of EU enlargement.
Economic Accounts for Agriculture (EAA)
The Economic Accounts for Agriculture contains internationally comparable data for 30 OECD countries as well as area totals for the euro area and EU-15. It provides a coherent and detailed framework for quantifying agricultural activities in monetary terms using the new accounting methodology adopted following SNA 93. Besides detailed output (amount, structure, composition) and input data, different value-added and income measures as well as capital formation data are shown. Inter alia, EEA allow the remuneration of production factors and of agricultural income to be determined.
The EAA database has undergone a profound methodological review for EU countries and extension to better meet future analytical needs. The methodology of the Economic Accounts for Agriculture has been reviewed with member countries to implement necessary changes and the addition of capital stock measures is to be investigated for possible inclusion. OECD has included smaller agricultural units in its questionnaire to take better account of the needs of some of its newer member countries.
Producer and Consumer Support Estimates
The Producer and Consumer Support Estimates provides detailed information on producer support estimates and consumer support estimates for the following products: wheat, maize, other grains, rice, oilseed, refined sugar, milk, beef and veal, pig meat, sheep meat, wool, poultry meat, eggs and other commodities. It includes the complete data series on PSE/CSE, the reference prices used, the exchange rates used and a complete documentation of definitions and sources provided on a country and commodity basis.
The data are used to calculate the various indicators of support to agriculture to evaluate agricultural and other policies in OECD countries, mainly in the annual
Monitoring and Evaluation Report. In addition the data are also freely available on the OECD public website.
The data collected and the method used to calculate the indicators of support are reviewed both internally and externally by the Working Party on Agricultural Policies and Markets on an annual basis. These review processes improve the data quality as well as the methodology used in the calculations.
The data are collected on an annual basis. Some countries provide all information on support estimates, whilst others deliver only a few data.
2.2.2 International Trade Statistics
International Trade by Commodity Statistics
terms of value (at current prices: thousand of USD) and quantity are collected annually and processed in the International Trade by Commodity Statistics. Data are also provided for OECD main country groupings (OECD-Total, NAFTA, OECD-Asia and Pacific, OECD-Europe, EU-15, etc.). Some data derive directly from the Statistical Office of the European Communities (Eurostat) and are published under the name EU15 - Extra EU, which excludes Intra-EU trade.
Data on agricultural products are also collected: live animals and food (meat, dairy and eggs, fish, cereals, vegetables and fruits, sugar and honey, coffee, tea, fodder and more), beverages and tobacco. Production, manufacture, wholesale and retail trade are all covered.
The database is available in a paper version and on CD-ROM or on-line. The paper version of the database is released annually in five volumes. On the electronic versions (CD-ROMs or on-line), the data are classified at the most detailed level and updated quarterly.
2.2.3 Statistics on Organic Agriculture
OECD does collate organic land area statistics as part of its agri-environment indicator work, but this indicator is still under development. Regarding other statistics OECD does not differentiate organic products in data collection and processing.2
2References:
- www.oecd.org
2.3 Eurostat
In its DCPSs, Eurostat covers a broad spectrum of the sectors along the food chain. The following chapter is mainly related to those levels of data collection which are being studied in the EISfOM project.
2.3.1 Agriculture
Within the agriculture, forestry and fisheries sector, the following themes are covered by single DCPSs.
• agricultural incomes and prices
• agricultural structures, land use and landscape • production
• agri-industry statistics
Agricultural incomes and prices
FADN
The Farm Accountancy Data Network (FADN, or RICA in French) is an instrument for evaluating the income of agricultural holdings and the impacts of the Common Agricultural Policy. The Farm Accountancy Data Network of the European Union (FADN) has been established since 1965.
The aim of the network is to gather yearly accountancy data from a sample of farms that is representative for all (commercial) farms for the determination of incomes and business analysis of agricultural holdings.
An annual survey is carried out by the Member States of the European Union. Member States are responsible for assembling the data in their own country and sending the data to Brussels. Although Member States have different ways of assembling the data, the bookkeeping principles are harmonized across all the countries. In Brussels data are checked and entered into a database.
The methodology aims to provide representative data along three dimensions: region, economic size and type of farming. While the European Commission is the primary user of analyses based on FADN-data, aggregated data can be found in the standard results database. The variables described in a farm return refer to:
• physical and structural data, such as location, crop areas, livestock numbers, labour force, etc.
• economic and financial data, such as the value of production of the different crops, stocks, sales and purchases, production costs, assets, liabilities, production quotas and subsidies, including those connected with the application of CAP measures.
activity defined in terms of economic size (see the definition of the European size unit below). This means that the very small farms are not represented. In the most recent accounting years there were almost 58,000 holdings (Community of Fifteen) representative of commercial farms in the FADN sample. Together they represented on average 90% of total production in the EU.
The terms used in the tables relate to the following definitions. Some definitions of FADN:
• The accounting year is a 12-month period starting between 1 January and 1 July, the exact date varying from one Member State to another. • The European size unit (ESU) is a unit of measurement of the
economic size of the agricultural holding. A farm has an economic size of 1 ESU if its total standard gross margin is ECU 1,200 of 1990 SGM (standard gross margin). The standard gross margin for each enterprise corresponds to the average value, over a three-year period and in a given region, of production minus certain variable costs.
• The type of farming (TF) of a holding is determined by the relative share in the holding's total standard gross margin of each of the enterprises of the holding. The holdings in the FADN sample are selected in such a way as to be representative, for each division, of the holdings belonging to each cell formed by the combination of TF and economic size class. The populations to be represented are derived from the Community farm structure surveys.
While the European Commission is the primary user of FADN-data, aggregated data can be found in the standard results database (http://europa.eu.int/comm/ agriculture/rica/dwh/index_en.cfm ). More information on the FADN can be found at: http://europa.eu.int/comm/agriculture/rica/index_en.cfm
Prices
Producer price indices cover sales of crop and animal products (output) from agriculture to the rest of the economy. Purchase price indices cover purchases of means of agricultural production (input).
There is a system of EU agricultural price indices (input and output) supplemented by a system of absolute prices for the principal agricultural products and means of production on a monthly and annual basis.
Land use and landscape
Farm Structure Survey (FSS)
a full census survey is carried out every ten years. It was first conducted in 1966/67 and covered land use, tenure, livestock, cropping, machinery and labour force.
The FSS is able to measure the size (both physical and economic) of holdings. The survey also yields information, which allows farms to be classified on their type of production. The standard gross margin (SGM) allows different agricultural products to be measured on a common basis. It is basically the difference between the production value and direct proportional costs of production and is measured for each type of crop and animal production. The farm structure survey also contains information about farm labour.
The results from 1975 onwards are held on a computer databank in the form of standard tables. The main results can take up to three years to be published, but some results are released about two years after data are collected on the farm.
Production
Crop production
Data are collected four times a year and updated, on an ongoing basis, over the year. In combination with annual estimates the database provides annual data on area, yield and production of cereals, other crops, fruit, vegetables, fodder and wines on a national level.
It offers a combination of information on production, imports and exports, domestic use, variations in stockage and human consumption result annually in supply balance sheets on a national level for cereals, other crops, fruit, vegetables and wines.
Animal production
Animal production statistics provide monthly slaughtering figures and quarterly forecasts of the GIP (Gross Indigenous Production) of bovine, pig, sheep and goat meat for human consumption. Monthly statistical surveys provide data on milk and milk products and on the production and trading of eggs. The information is based on data from slaughterhouses plus estimates of slaughtering on farms. The production forecasts are based on livestock surveys and other sources (e.g. exhaustive surveys). Figures which account for at least 95% of cow’s milk are collected.
The data combine information about usable production, total import (from both countries and from non-member states), supplies, uses, total exports (to both EU-countries and to non-member states), initial stocks, final stocks, domestic use, losses, animal feed, industrial use and human consumption. Results are collected and published annually in supply balance sheets for animal products on a national level. Annually supply balance sheets are presented for the following product groups: meat (adult cattle and calves, pork, sheep and goats, horses, poultry, offal and other) and dairy products (fresh production excl. cream, milk and buttermilk, cream, concentrated milk, whole milk powder, skimmed milk and butter milk powder, butter, cheese, total eggs, eggs for hatching and other eggs).
Supply balance sheet
the results that can be drawn from them are one of the elements on which those responsible for agricultural policy base their decisions.
Supply balance sheets are drawn up for all important agricultural products and comprise comprehensive, summarised tables showing the quantities for the components of resource and use (balance sheet headings) taken from various statistical sources or estimates, for a clearly defined type of products, for a given period, and for a given geographical area. They can be regarded as an extension in physical units to the overall accounts - expressed in terms of value - for the agricultural sector, although in this case the figures are broken down by reference to individual products.
Organic farming
(The information given in the organic farming sub-chapter is based on the document: Eurostat, Unit F-5: Food safety, rural development and forestry, Directorate F: Agricultural, environmental, food and regional statistics, Working Group ‘FOOD SAFETY’ Meeting of 13 and 14 November 2003 in Luxembourg: Agrobiology data). Council Regulation (EEC) No 2092/91 from 1991 on organic production of agricultural products and indications regarding agricultural products and foodstuffs lays down the requirements for organic farming in all Member States. Since the implementation in 1992, many farms across the EU have converted to organic production methods. Regulation No 2092/91 was amended by Council Regulation (EEC) No 1804/1999 to include livestock production. Council Regulation (EEC) No 1788/2001 lays down the detailed rules for implementing the provisions concerning the certificate of inspection for imports from third countries under Article 11 of Council Regulation (EEC) No 2092/91.
Obligations on the Member States to provide data and information to the Commission (Regulation No 2092/91)
Article 15 obliges the Member States to communicate to the Commission in particular a list of the operators who, on 31 December of the previous year, had given notification under Article 8 (1) (a) and are subject to the inspection system, and a report on the supervision carried out.
Under the same Article, Member States shall provide the Commission with the list of inspection bodies approved on 31 December of the previous year, their legal and operational structure, their standard inspection procedure, their penalty arrangements and, where appropriate, their mark.
This regulation has established procedures for the Member States to report data on organic farming to the European Commission. Regulation 2092/91 describes in full detail the agricultural practices that are considered at the EU level as organic farming. It covers the activities of growing of crops and farming of animals. Also, operators involved in organic farming supply chains are subjected to inspections in order to verify that they follow the rules set up in the regulation. They must have a certificate delivered by the responsible national authorities before labelling their products as organic.
adopted food standards presented in uniform manner. It also includes provisions of an advisory nature in the form of codes of practice, guidelines and other recommended.
Available data concerning organic farming
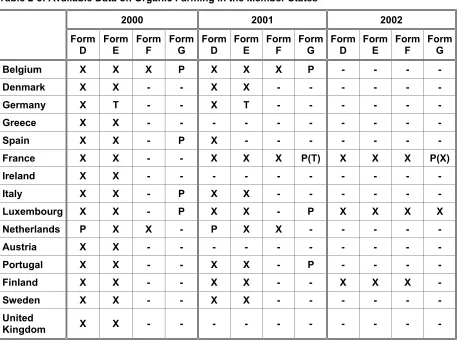
DG Agri has developed a questionnaire for the collection of organic farming data. There are 7 sections to this questionnaire, 3 of which are obligatory and contain confidential data:
Form A: List of approved operators (confidential data)
Form B: List of approved inspection bodies (confidential data) Form C: Supervision reports (confidential data)
Form D: Number of operators (producers, processors, importers) Form E: Area and yield
Form F: Organic livestock numbers Form G: Industrial output
Forms D to G represent statistical data. There are also data from the Eurofarm
(structure of agricultural holdings) inquiry concerning the percentage of organic agricultural holdings with regard to the total number of agricultural holdings.
[image:29.595.72.530.390.731.2]Table 2-3 gives an overview of the data available in each Member State (based on the DG Agri questionnaire).
Table 2-3: Available Data on Organic Farming in the Member States
2000 2001 2002
Form
D Form E Form F Form G Form D Form E Form F Form G Form D Form E Form F Form G
Belgium X X X P X X X P - - - -
Denmark X X - - X X - - -
Germany X T - - X T - - -
Greece X X - - -
Spain X X - P X - - -
France X X - - X X X P(T) X X X P(X)
Ireland X X - - -
Italy X X - P X X - - -
Luxembourg X X - P X X - P X X X X
Netherlands P X X - P X X - - -
Austria X X - - -
Portugal X X - - X X - P - - - -
Finland X X - - X X - - X X X -
Sweden X X - - X X - - -
United
Kingdom X X - - -
Form D: Number of registered operators (producers, processors, importers) Form E: Area and yield
X Data available in detail T Total only available - No data available
P Producers only
2.3.2 Trade
International trade forms an increasing part of the world economy and, as such, must be measured reliably. The compilation of trade figures is founded on a legal basis which is set out in a series of Council and Commission regulations. The aim of international trade statistics is to record all goods that add or subtract from the stock of material resources of a country by entering or leaving its territory. By their nature international trade statistics are concerned with transportable goods.
In external trade statistics, exports are recorded at their fob (free on board) value and import at their cif (cost, insurance, freight) value. Therefore, import values include charges, such as transport and insurance, relating to that part of the journey which takes place outside the statistical territory of the importing country. Export values correspond to the value of goods at the time and place where they leave the statistical territory of the exporting country.
External trade statistics are collected on a monthly basis and include information on: the partner country (country of destination for exports and country of origin or consignment for imports), the goods exchanged and the mode of transport. The indicators are the trade value in euros and the quantity expressed in tonnes as well as in the supplementary units when available.
Intra-European Union trade
Statistics on trade between the Member States of the European Union are based on Council Regulation (EEC) No 3330/91 of 7 November 1991 and on the various implementing regulations which lay down or supplement the rules on methodology, thresholds and questionnaires. The Intrastat system, which was created as a means of collection of these statistics, came into operation on 1 January 1993. Its main features are given in the paragraph below.
Intrastat provides for the direct collection of information from companies which send the relevant national administration a summary declaration for the previous month’s operations. In France and Italy, these declarations also serve statistical and fiscal purposes. It is based on a close link with the VAT (Value Added Tax) system relating to intra-EU trade. The tax authorities of the Member States are required, at least once every quarter, to transmit to the statistical services a list of operators who have made purchases or sales and the value of these operations, so that the exhaustiveness and quality of the statistical data can be checked.
Extra-European Union trade
Statistics on the European Union’s trade with non-member countries are currently based on Council Regulation No 1172/95 of 22 May 1995. Two features of Regulation 1172/95 deserve special mention.
Community level. Similarly, particular requirements governing certain fields exist at national level in the absence of harmonization at Community level.
Distributive trades
The distributive trades publication provides an overview of the importance of the distributive trades sector and its various economic activities (among others wholesale and retail trade) in Europe. It contains an analysis of the data on distributive trades delivered in the frame of the regulation on structural business statistics (Council Regulation n°58/97) by the EEA (Eastern European Accession) countries.
Since 1995, structural business statistics (SBS) have been collected in the area of distributive trades according the SBS regulations harmonized framework. Short-term indicators have been collected at EU level in this area since reference year 1998. One of the basic sets of information provided by structural business is on the relative size of industries and retail trade measured in terms of both turnover and employment.
2.3.3 Consumption
The Eurostat Working Group (WG) on Household Budget Surveys (HBS) was created by a decision of the DGINS conference on 29.11-1.12.1989. The aim was to compile the existing information in the Member States (MS) on household budgets in order to make all this information available at European level as well as to improve harmonisation of surveys in terms of the concepts used, classification of variables, data collection and data processing methods.
So far, this project has not had any legal basis and therefore it was run as a “gentleman’s agreement” among the Member States, some EFTA countries and Eurostat. Essentially, each country kept the targets, the uses and the programming of its national HBS and, at the same time, it collaborated with Eurostat in order to compile a Europe-wide data set on household budgets with a frequency of about 5 years3. The approach of this statistic is cross-sectional rather than longitudinal.
Available data
One of the features of this statistic, and probably one source of the problems, is the wide variety of uses and users. Traditionally, the main use of this statistic at the national level has been to collect information on household consumption expenditures for updating the ‘weights’ for the basket of goods used in the Consumer Price Indexes. However, many other uses have arisen either at national or European level: to estimate the household consumption accounts for National Accounting, to carry out a wide variety of analyses on consumers and consumption (i.e. consumption patterns, nutritional studies, etc), to supply complementary information for studies on poverty and social exclusion, to research economic and consumption issues, and so forth.
The key concept of the data collected by the HBS is “household final consumption expenditure”. These data are broken down by the COICOP-HBS classification. Together with these data, the HBS collect numerous cross-sectional variables regarding households and household members. These variables allow HBS results to be used in many different ways.
3 Although several EU countries and many Accession and Candidate countries conduct annual
In the WG meeting of October 2001 it was agreed that the next reference year would be 2005. All the candidate countries have promised to participate fully in the next round.
In the first round, the methodologies used by the MS to carry out the HBS were very far from being harmonised. Since then, all the countries participating in this project and Eurostat have made big efforts in order to harmonise their HBS and to improve data comparability.
In order to allow Eurostat to process the data received and to perform an ex-post harmonisation and answer specific user requests, countries deliver micro-data to Eurostat. However, the gentleman’s agreement only allows Eurostat to disclose aggregated tables or indicators.
Methodology and characteristics of the HBS
The Household Budget surveys (HBS) in the European Union are sample surveys of private households carried out regularly under the responsibility of the National Statistical Offices (NSIs) in each of the fifteen Member States (European Statistical System). Essentially, they provide information about household consumption expenditure on goods and services, with considerable detail in the categories used; information on income, ownership of consumer durables and cars; basic information on housing and many demographic and socio-economic characteristics. Unlike other European statistics, HBS is voluntary and no EU regulation exists. Therefore each Member State is free to decide the objectives, methodology, programming and resource assignment for their own HBS.
In co-operation with the National Statistical Offices of the Member States, Eurostat has for many years worked on the quality - mainly the comparability of HBS statistics within the EU. In spite of the important progress already made, there is still much room for improvement regarding quality and harmonisation of HBS data.
The current situation of HBS can be summarised as follows:
• HBS is a complex cross-sectional statistic with no legal framework at the EU level. Although there is a common classification (COICOP-HBS), each country has its own targets, survey programming and methodology, which are not totally aligned with other countries. Eurostat carries out an ex-post harmonisation on the data sets delivered by each participating country, but it is not possible to totally eliminate the comparability problems.
• There is a wide variety of uses and users at both the national level and the European level.
• Frequency is long (about 5 years)4 and timeliness is also long (for certain data, more than 3 years).
• In June 2002, a Task Force (TF) meeting was organised to discuss some problems identified in the current COICOP-HBS nomenclature. More specifically, the COICOP divisions for food, housing, financial services and insurance were analysed. The main problems were of two types: omissions of categories in COICOP-HBS (such as the lack of a specific category for “frozen vegetables”), and problems of classification leading to conflicts at the current level of detail of COICOP-HBS (such as the different way of classifying “pizzas” and other “combined” products and services by different countries). The HBS WG approved
the modifications proposed by the TF to the COICOP-HBS classification during its meeting in May 2003.
Presently the main points of divergence in the national methodologies creating comparability problems among the MS are as follows.
• There are still some differences in the national definitions of: − household and household members,
− head of household/reference person, − child/adult.
• Countries have different uses for COICOP-HBS nomenclature, either in the degree of detail or in the criteria used to solve the borderline cases. Moreover, a few countries continue using national nomenclatures instead of COICOP-HBS. The other countries have carried out national adaptations of COICOP-HBS by adding newer levels of detail. In principle this practice does not cause any problem, provided that these nomenclatures are compatible downwards with COICOP-HBS.
• There are some problem areas in the definition of the concept of household consumption expenditure:
− “actual final consumption” versus “final consumption expenditure” (although the first concept would be preferable from a theoretical point of view, for the moment it is only possible to implement the second),
− treatment of goods or services retained for own final consumption, − treatment of salaries in kind,
− rent for housing,
− recording of consumption expenditure in alcohol, narcotics, prostitution and illegal services,
− transactions in existing goods, − treatment of gifts and transfers,
− treatment of certain types of insurance and financial services, − health and education consumption expenditures.
• Similarly, household income still has some divergences details, definitions and manner of recording.
• Sample definitions and survey organisation are also very different from country to country.
• Formats of data files delivered by the countries to Eurostat are very different. • With regard to frequency, while there are seven MS with annual or continuous
surveys, the other eight perform their HBS every 5 years. However, non-annual surveys are “reasonably” well synchronised.
The methodological divergences among the CC countries are even bigger.
harmonisation to be implemented for the next round of data collection planned for the reference year 2005.
Analysis of the use of HBS data for the study of consumption of organic products
Historically, the prime objective of conducting HBS in all the Member States was to collect information on household consumption expenditures for use in updating the ‘weights’ for the basket of goods used in the Consumer Price Indices (CPI). The ‘weights’ measure expenditure on specific goods and services as a proportion of total expenditure. Over the years, the range of uses has grown as the surveys have also had to provide a picture of living conditions in private households in certain areas and at certain periods of time. To this end, the surveys provide detailed descriptions of a private household’s total consumption and expenditures by household characteristics such as income, possession of consumer durables, housing and many demographic and socio-economic characteristics. The surveys also provide information on standards of living in terms of income and expenditure. Hence HBS are multi-purpose surveys which cater for a large number of uses and users. In terms of the scope and detail of information supplied, the surveys are an invaluable source of information on the economic and social living conditions of households and individuals in the EU Member States.
The multi-purpose nature of the HBS is one of its strengths, but it also is a source of problems. Each user of HBS data has slightly different information needs and hence there is constant pressure on the HBS managers to include new variables or improve the level of detail in the existing classifications. As a result, the size of the questionnaires to be filled by the participating households has increased enormously. It can be easily inferred that the usual consequence of this practice has been an increased reluctance to collaborate with these surveys and a fall-off in the response rates. Therefore HBS managers have had to find suitable trade-offs between the amount of information collected by the HBS and achieving acceptable response rates.
At the moment, there are three main difficulties for using HBS as a source of information for analysing the consumption of organic products:
1. Organic products are not explicitly covered by the latest version of the COICOP-HBS nomenclature.
2. HBS do not collect quantities of product consumption (in physical units); only data on consumption expenditures (on economic value) are gathered.
3. HBS is not suitable for building time series or analysing the evolution of variables over the time for two main reasons:
• the frequency of HBS data collections is 5 years.
• there have been significant methodological changes between all successive HBS data rounds, so that the results of different rounds are not comparable.
For these reasons the possibilities for using HBS data for carrying out studies on the consumption of organic products are limited. If the information needs of these studies are very demanding, the possibility of creating ad-hoc surveys for this purpose should be considered seriously, rather than trying to adapt the existing HBS.5