City, University of London Institutional Repository
Citation
:
Kotecha, A., O'Leary, N., Melmoth, D. R., Grant, S. and Crabb, D. P. (2009). The
Functional Consequences of Glaucoma for Eye-Hand Coordination. Investigative
Ophthalmology & Visual Science, 50(1), pp. 203-213. doi: 10.1167/iovs.08-2496
This is the published version of the paper.
This version of the publication may differ from the final published
version.
Permanent repository link:
http://openaccess.city.ac.uk/3911/
Link to published version
:
http://dx.doi.org/10.1167/iovs.08-2496
Copyright and reuse:
City Research Online aims to make research
outputs of City, University of London available to a wider audience.
Copyright and Moral Rights remain with the author(s) and/or copyright
holders. URLs from City Research Online may be freely distributed and
linked to.
City Research Online:
http://openaccess.city.ac.uk/
[email protected]
Eye–Hand Coordination
Aachal Kotecha,
1,2Neil O’Leary,
1Dean Melmoth,
1Simon Grant,
1and David P. Crabb
1PURPOSE.To examine whether patients with glaucoma exhibit differences in visually guided reaching-and-grasping (prehen-sion) behavior compared with normally sighted control sub-jects.
METHODS.Sixteen patients with glaucoma and 16 control sub-jects with no ocular disease participated. Participants were required to reach out and precision grasp one of two cylindri-cal objects placed on a table top in front of them in laboratory conditions in three viewing conditions (binocular, right eye alone, left eye alone). Lightweight reflective markers were placed on the subject’s preferred hand for recording its move-ment in three-dimensional space. Three motion capture units recorded the motion of these markers as the subjects reached out and precision grasped household objects. Various indices of prehension planning, execution, and control were quanti-fied. Visual fields (VF) were measured using standard auto-mated perimetry generating monocular mean deviation (MD) scores. Binocular VF sensitivity was estimated by using the integrated visual field (IVF). Stereoacuity was measured with the Frisby stereoacuity test. Significant differences in prehen-sion movement between patients and control subjects in each viewing condition were investigated, and associations between prehension kinematics and VF sensitivity were examined. RESULTS.The patients and control subjects were of a similar age (median [range]: patient group, 72.2 years [62.5– 86.9]; control group, 69.0 years [64.3–78.3]). The patient group had asym-metrical disease and relatively minor binocular overlapping defects (better eye MD,⫺5.7 dB [⫺16.7 to⫹0.45 dB]; worse eye MD,⫺11.8 dB [⫺29.3 to⫺1.5 dB]; IVF score, 3 [0 –36]). They exhibited slightly poorer stereoacuity levels than did the control subjects (patient group, 55 sec arc [40 –110]; control group, 40 sec arc [20 – 80; Mann-Whitney U test,P⬍0.05]). They also showed statistically significant delays in average movement onset (MO: ⬃100 ms delay, Mann-Whitney U test
P ⬍ 0.0001) and overall movement time (OMD: ⬃140 ms delay; Mann-Whitney U testP⬍0.05), suggesting impairments in initial movement planning and control. Deficits were exhib-ited in the reaching component, with data suggesting that glaucomatous patients made more tentative movements when reaching for the object. These deficits correlated with both increasing severity of VF defect and impaired stereoacuity.
There were no differences in grasping characteristics between patients and control subjects in this sample.
CONCLUSIONS.This study provides evidence that patients with glaucoma exhibit deficits in eye– hand coordination compared with the age-matched normally sighted control. Further study is needed to assess the specific effect of field loss location on prehension kinematics. (Invest Ophthalmol Vis Sci.2009;50: 203–213) DOI:10.1167/iovs.08-2496
G
laucoma is the leading cause of irreversible blindness in the world.1It affects 1% of persons older than 40 years and 5% of those 65 years of age, increasing in prevalence with advancing age.2
A triad of tests is used in the diagnosis and monitoring of progression of the disease: assessment of optic nerve head structure, measurement of intraocular pressure, and measurement of VFs, usually by standard automated pe-rimetry. The latter test is considered by many to be the gold standard for assessing the severity of glaucoma. These quanti-tative measures provide the clinician with information regard-ing patient prognoses and management requirements, but they are clinician-based measures of disease severity and, as such, probably provide little indication of the true level of patients’ functional ability and hence their vision-related quality of life (QoL).
Understanding the effects of ophthalmic disease on an in-dividual’s ability to function on a day-to-day basis remains a challenge for the clinician. Several vision-specific QoL ques-tionnaires exist that require patients to evaluate their visual disabilities. The results of studies employing these instruments have been contradictory, with some showing a modest associ-ation between perceived visual disability and the severity of binocular VF loss in later stages of the disease,3,4
and others finding only a weak correlation.5,6
It is known that individuals with similar levels of disease severity report very different QoL experiences.7
Thus, although QoL questionnaires may serve as interesting adjuncts to the assessment of patients’ functional ability, more objective methods of assessment are necessary to formally examine how well they perform visually demanding tasks that are relevant to their everyday life experiences.
Performance-based testing is not new to ophthalmology. In several studies, investigators have looked at the impact of glaucoma on patient mobility8
and the ability to drive.9,10
Performance-based testing has also been used to assess the effects of the ageing process on visual abilities in the elder-ly11,12
and to assess the functional abilities of patients with low-vision13–15
or glaucoma.16
However, these assessments require a trained technician to observe the patient performing the set task and to score the patient’s ability to execute that task efficiently.
The act of reaching out to grasp an object is a basic visually guided task that is performed many times during the day. Visual information about the object’s spatial location is necessary for fast and accurate reaching, while a detailed assessment of the object’s intrinsic properties (e.g., size, shape, and weight) is needed to preshape the grasp posture and to select the most appropriate contact points for stable grip application. These eye– hand coordination skills have been shown to be mediated by the dorsal stream, or the vision-for-action pathway, which
From the 1Department of Optometry and Visual Sciences, City
University, London, United Kingdom; and the2NIHR (National
Insti-tute for Health Research) Biomedical Research Centre, Moorfields Eye Hospital and the Institute of Ophthalmology, London, United King-dom.
Submitted for publication June 26, 2008; revised August 18 and 28, 2008; accepted October 22, 2008.
Disclosure:A. Kotecha, None;N. O’Leary, None;D. Melmoth, None;S. Grant, None;D.P. Crabb, None
The publication costs of this article were defrayed in part by page charge payment. This article must therefore be marked “advertise-ment” in accordance with 18 U.S.C. §1734 solely to indicate this fact. Corresponding author: Aachal Kotecha, Department of Optome-try and Visual Sciences, City University, Northampton Square, London EC1V 0HB, UK; [email protected].
Investigative Ophthalmology & Visual Science, January 2009, Vol. 50, No. 1
runs from the occipital to the posterior parietal cortex and normally involves aspects of spatial vision that may be defec-tive in patients with glaucoma.17
It has been shown that pe-ripheral VF losses result in a decrease of space perception accuracy18
and that patients with ophthalmic diseases that reduce the extent of the binocular VF have difficulties with mobility.19,20
Investigators who have assessed the effects of reaching-and-grasping performance in impaired visual condi-tions have artificially reduced vision in normal subjects21–24
or have studied patients with vision loss after cortical lesions17
or congenitally blind persons.25
The results of these studies have revealed specific impairments in either the reaching or grasp-ing component, dependgrasp-ing on whether visual losses are pe-ripheral or central.
The purpose of this study was to examine how visually guided reaching-and-grasping behavior differs in patients with glaucoma compared with that in age-matched, normally sighted control subjects. We hypothesized that patients with glaucoma who have VF loss would exhibit deficits in reaching performance, whereas grasping characteristics would remain unchanged.
M
ETHODSThirty-two subjects were enrolled in the study: 16 adults with stable primary open angle glaucoma (POAG) and 16 control volunteers with no history of ocular disease. Patients with POAG were recruited from the Glaucoma Research Unit at Moorfields Eye Hospital, London. Stable POAG was defined as an unchanged VF over the previous 18 months, as determined using point-wise linear regression of VF sensitivity over time (Progressor; Moorfields Eye Hospital, London, UK/Medisoft Ltd., Leeds, UK; see the Visual Field Assessment section immediately follow-ing). To be included in the study, participants had to have a monocular visual acuity of 6/12 or better in each eye, exhibit no manifest devia-tion on a cover test, and show a gross level of stereoacuity (Wirt Fly test, suggesting a stereoacuity of at least 1000 seconds arc [sec arc]). Stereoscopic visual acuity was later further quantified by using the Frisby stereotest (Clement Clarke International Ltd, Essex, UK) accord-ing to the instructions of the manufacturer. Briefly, the test consists of three plates of Perspex of varying thickness on which are printed a random pattern of shapes in four quadrants. A circular pattern is printed on one side of each plate in a single quadrant; thus, each plate presents a different disparity cue that varies further with viewing distance. The plates are presented perpendicular to the subject’s
view-ing axis at different distances, between 30 and 80 cm, and the subject is asked to report which of the quadrants contains the circular target in depth. The study had the approval of Moorfields Eye Hospital Research Governance and the Department of Optometry and Visual Science at City University Research Ethics Committee, and local re-search ethics committee approval was obtained before commence-ment of the study. Informed consent, according to the tenets of the Declaration of Helsinki, was obtained from each subject before exam-ination. All tests were performed in the reach-and-grasp laboratory at the Department of Optometry and Visual Science (City University, London).
VF Assessment
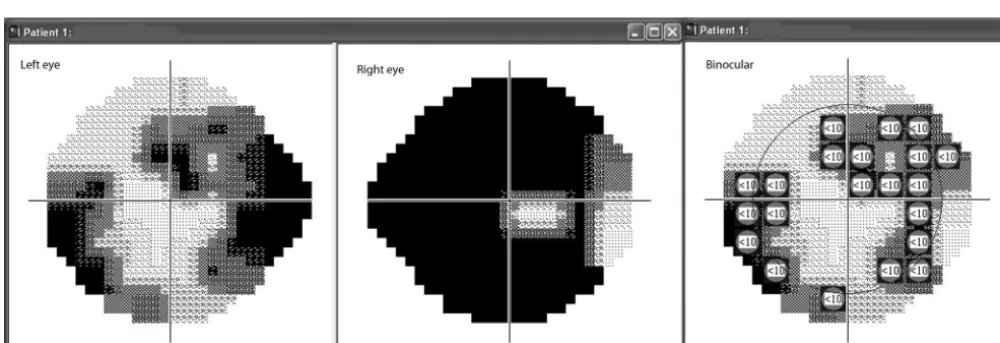
All participants underwent VF perimetry (Humphrey Field Analyzer [HFA]; Carl Zeiss Meditec, Inc., Dublin, CA) SITA standard threshold 24-2 VF test on both eyes. Mean deviation (MD) scores were recorded for each eye, and a binocular VF score was generated by the Integrated Visual Field feature of the Progressor software (Moorfields Eye Hospi-tal/Medisoft Ltd.) that was applied to monocular VF data from the HFA. The software combines data from each monocular HFA field to pro-duce a simulated binocular VF in which patients’ best point-by-point sensitivity is displayed (Fig. 1).26 –28
For group comparisons of monocular data, participants’ eyes were classed as better eye or worse eye based on the VF MD score.
Reach-and-Grasp Kinematics
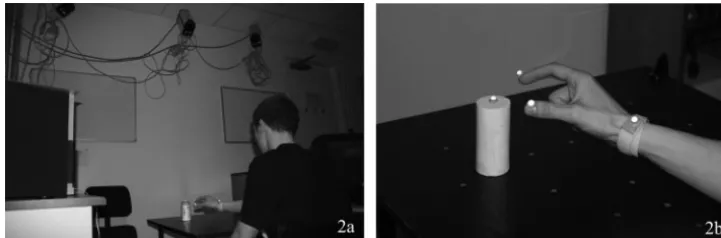
The procedures adopted for quantifying reach-and-grasp kinematics were identical with those adopted by Melmoth and Grant.29In brief,
the experimental workspace consisted of a black, matt table illumi-nated uniformly from above. Three motion-capture units (ProReflex; Qualisys AB, Gothenburg, Sweden) triangulated the workspace from approximately 2 m above the table (Fig. 2a). Three lightweight infrared (IR) reflective markers of approximately 7 mm diameter were placed on the participant’s preferred hand for recording its movement in three-dimensional space. One marker was attached to the wrist with a Velcro strap and two were placed on the opposing distal borders of the thumbnail and index fingernail (Fig. 2b). Movements of the IR markers were tracked by the motion-capture units and recorded directly by a computer-based system. Viewing conditions were controlled by liquid crystal goggles (Plato; Translucent Technologies, Toronto, ONT, Can-ada) that permitted either a full binocular view of the task or restricted the participant’s vision to one or the other eye. Movement recording onset and termination were synchronized with the opening and
[image:3.594.43.543.514.685.2]ing of the goggle apertures. The Plato goggles do not restrict head movements, and therefore the participant were free to move his or her head to localize the object if required. In monocular viewing condi-tions, the goggles permit an unimpeded field of view (75° horizontally and 60° vertically static field of view).29
An established recording protocol was used for measuring reach-and-grasp movements.29,30Participants were required to reach out and
precision grasp one of two high-contrast, cylindrical household objects of different sizes placed at one of four different locations, using bin-ocular vision or the left or right eye alone. Objects were of approxi-mately 100 mm in height and consisted of either small (24 mm)- or large (48 mm)-diameter, positioned in one of two near (200 mm) or far (400 mm) positions located 10° from the start position in either the ipsilateral or contralateral hemispace relative to the reaching hand. Participants were instructed to make swift, natural reaches to pick up the object, using the thumb and index finger only, as soon as the goggle apertures opened. Viewing condition, object size, and object position were presented in a randomized order, with participants masked to object placement at the start of each recording.
Participants performed 12 reach-and-grasp movements (three times for view, 2 times for object size, and two times for position) in separate trial blocks, and 10 trial blocks were recorded with brief rest periods between each block. Participants were given a practice run of 6 to 10 trials before the start of the recording protocol to familiarize them-selves with the procedure. In total, 120 reach-and-grasp movements were recorded for each participant.
The movement variables quantified were separated into three dis-tinct components: the general kinematics of the movement, aspects of the reaching component, and characteristics of the grasping compo-nent. General kinematics included the time taken to start the move-ment (MO) representing movemove-ment planning and initiation time, and the overall movement duration (OMD) giving an index of the efficiency of task execution. Reach dynamics (or the transport component) quantified included the maximum velocity of the movement (peak velocity [PV]), the times to peak velocity (ttPV) and peak deceleration (ttPD), and the time spent in the final approach to the object (the time from peak deceleration to object contact, or the low-velocity phase; LVP). The PV, ttPV, and ttPD reflect aspects of movement planning, and the low-velocity phase describes the control of the movement once the hand has left the starting position, otherwise termed the online control of the movement. The grasp dynamics and accuracy recorded included the grip size at preshaping (width of peak grip aperture [PGA]) and time to reach peak grip aperture (ttPGA), which characterize movement planning, and the time spent closing (grip closure time [GCT]) and then applying the grip (grip application time [GAT]), which indicate movement control. To examine whether there were any differences in the spatial awareness of object location be-tween subject groups, the grip size on initial object contact (GOC) and the overall movement path length were also measured. (Videos of move-ments can be seen at: http://www.w3media.co.uk/aal/wholemovement. wmv/ and http://www.w3media.co.uk/aal/reach&grab.wmv).
Supplementary Tests
Although the objects used in the experimental setup consisted of simple cylindrical objects, it is possible that the grasp component of
the movement was influenced by differences in manual dexterity between patients. Therefore, manual dexterity was assessed with ABIL-HAND, a 23-item validated questionnaire that assesses a person’s ability to perform tasks of daily living that require a degree of manual ability (e.g., squeezing toothpaste onto a toothbrush or buttoning up a shirt).31The results of the questionnaire were entered onto the
ABIL-HAND Web site (http://www.rehab-scales.org/), and after a Rasch analysis, a single numerical score was generated. Scores ranged from 0, indicating severe difficulty, to 6, indicating no difficulty with manual tasks.
Details of-blocker medication (systemic and topical) were also collected from each participant.
Data Analysis
Each participant undertook 120 reach-and-grasp movements, generat-ing 10 repetitions for each permutation of the viewgenerat-ing condition (binocular, right eye, left eye), object size (small, large), and object position (near, far). For each participant, the median response of these 10 repetitions was calculated for all kinematic parameters studied. Comparisons of these values between the patient sample and control sample were made by using a nonparametric test (Mann-Whitney U test), thus making no assumptions about the normality or magnitude of variance exhibited by the sample estimates. These comparisons were also made for the three different viewing conditions. The correlation between movement kinematics and degree of VF defect severity, ste-reoacuity, and patient age was assessed by Spearman’s rank correlation (SPSS, ver. 14.0; SPSS Inc., Chicago, IL).
R
ESULTSTable 1 summarizes the demographic data of both patients and control subjects. To compare patient and control prehension kinematics in monocular viewing conditions, we divided the VFs of all participants into better eye or worse eye, based on the MD of their VFs. However, although there were subtle intereye differences in MD, all control subjects had full VFs with no abnormality on the Glaucoma Hemifield Test. Each subject group consisted of 15 right-handed persons and 1 left-handed individual. In each case, the participant’s preferred hand was used for reaching and grasping.
General Findings
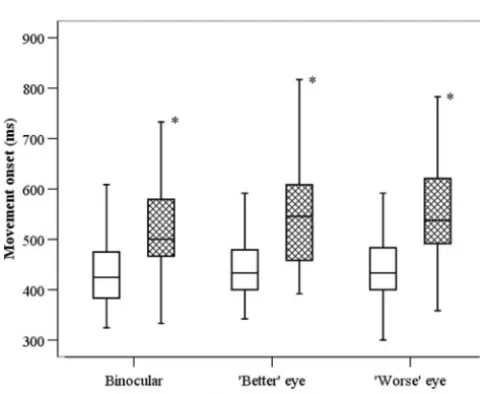
In all three viewing conditions, the patients showed statisti-cally significant delays in average MO when compared with the control subjects. They exhibited significant delays in overall average OMD times compared with the control subjects in monocular viewing conditions, but although OMD was also slower in binocular viewing conditions, the average differ-ences did not reach significance (Figs. 3, 4).
There were minimal differences between the patients and control subjects in reach planning, illustrated by the similar PVs and ttPVs, and PD between subject groups. However, when reaching for the more distant object, patients exhibited statistically significant slower average LVPs, suggesting a deficit
[image:4.594.182.543.57.176.2]in online control of the movement (Fig. 5). The path length when reaching for the object at both near and far locations were similar between groups, suggesting that the patients had no deficits in spatial awareness of object location.
There were no statistical differences in the grasping com-ponent between the patients and control subjects, although the patients displayed slightly delayed ttPGA and GCT com-pared with the control subjects. PGA size, size of GOC, and GAT were similar between groups (Fig. 6).
Actual data for prehension kinematics for each group are provided in Tables A1 to A3 in the Appendix.
Relationship between Movements and VFs, Stereoacu-ity, and Age. Table 2 illustrates the Spearman’s correlation between the degree of VF defect severity, participant age, and stereoacuity and movement kinematics. Patient and control data were pooled for these analyses. In binocular viewing conditions, the subjects with worse VF defect severity (defined as higher IVF score) reached maximum speeds (ttPV) and
decelerated their hands (ttPD) earlier in the reach movement, suggesting an initial misestimation of object location. The sub-jects with worse stereoacuity displayed longer LVPs, suggest-ing a more tentative final approach to the object. There were no correlations between subject age and prehension kinemat-ics.
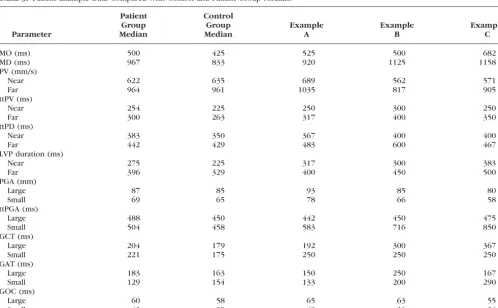
Patient Examples. The results suggest that the patients with glaucoma exhibited differences in reaching performance compared with control subjects, particularly in the online control of movements, although the data show a large amount of intersubject variability. The following three patient exam-ples highlight kinematic differences between patients with glaucoma that require further exploration. Table 3 displays the kinematic data for each example in comparison with control and patient group medians.
Example A: Advanced Binocular VF Loss
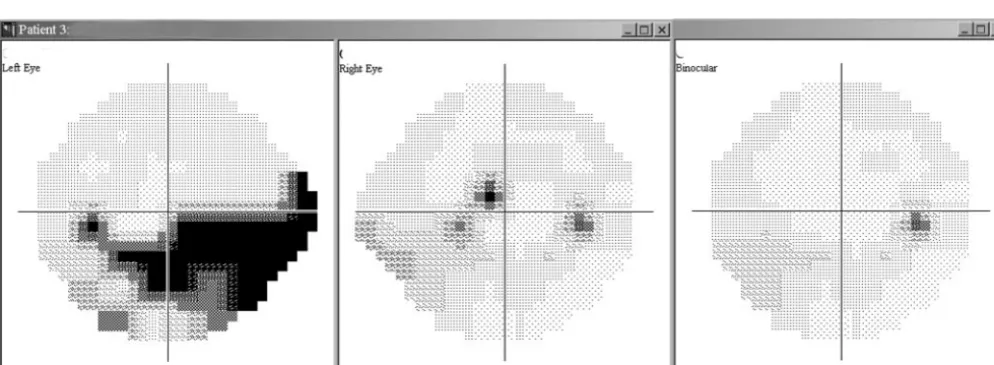
The patient was a 75-year-old woman, with right eye MD⫺12.6 dB, left eye MD⫺16.5, IVF score 34, stereoacuity 55 sec arc.
TABLE1. Demographics of Study Participants
Parameter
Patients,nⴝ16 Median (Range)
Controls,nⴝ16 Median (Range)
Mann-Whitney Comparison
Age (y) 72.2 (62.5 to 86.9) 69.0 (64.3 to 78.3) 0.66
Women (n) 9 10
MD (dB)
Better eye (dB) ⫺5.7 (⫺10.2 to⫺3.5) 0.1 (⫺0.6 to 1.5) ⬍0.0001 Worse eye (dB) ⫺11.8 (⫺29.3 to⫺1.5) ⫺0.3 (⫺2.5 to 1.3) ⬍0.0001 Snellen VA (decimal equivalent)
Better eye 1.0 (0.7 to 1.2) 1.0 (0.7 to 1.2) 0.40
Worse eye 1.0 (0.5 to 1.2) 1.0 (0.7 to 1.2) 0.11
IVF score 3 (0 to 36) 0 (0) ⬍0.01
Stereopsis (Frisby test; sec arc) 55 (40 to 110) 40 (20 to 80) 0.02 ABILHAND score (LOGITS) 4.1 (2.48 to 6.0) 6.0 (2.18 to 6.0) 0.14 Patients number on-blocker
therapy (topical or systemic) 7 4
Patients and control subjects were of similar ages, and both groups had an even mix of the sexes. Subjects with glaucoma displayed an asymmetry in VF defect, characteristic of the condition. However, the degree of binocular overlapping defect in this group was relatively small (median score, 3 of a possible 104). There was only a slight decrease in stereoacuity in the patient group compared with the control group. The ABILHAND results suggest no between-group differences in manual dexterity. More subjects in the patient group were on-blocker therapy.
FIGURE3. Differences in MO times between the patient (;) and
control (䡺) groups in each viewing condition. Midline represents the median, boxes show the 25th to 75th percentiles, and error bars show the 5th and 95th percentiles. The patients were significantly slower to initiate the movement than were the control subjects. *Significant differences atP⬍0.0001.
FIGURE4. Differences in overall movement duration between the patient (;) and control (䡺) groups in each viewing condition. The
plots are as described in Figure 3. The patients took longer to complete the movement than did the control subjects. *Significant differences at
[image:5.594.44.284.478.675.2] [image:5.594.300.544.491.683.2]Despite having a severe binocular overlapping defect, she showed few deficits in her reaching and grasping of table top objects, as shown in Table A3 in the Appendix which com-pares her kinematic data compared with control group and patient group medians. Examination of her VF plots revealed a dense superior hemifield defect with a relatively intact central inferior field (Fig. 7). We may speculate that having a field defect in the superior location would have little effect on the ability to perform table top reaching tasks.
Example B: Minimal Binocular Field Loss
The patient was a 73-year-old woman, with right eye MD⫺2.2 dB, left eye MD⫺12.3 dB, IVF score 2, and stereoacuity 55 sec arc. Her MO was within the limits of the control group data, but she exhibited deficits in movement planning and online control, illustrated by the slower PV, ttPV, and ttPD, and longer duration of LVP, suggested a more tentative approach in reach-ing for the object. She also displayed a delayed time to PGA, particularly with the small object, and longer GAT with both objects. These data suggest that she had difficulty and uncer-tainty with object localization despite having a minimal over-lapping VF defect. Examination of her VF plots revealed a dense midperipheral inferior defect in one eye (Fig. 8). We may once again speculate that an intact inferior VF was important in executing table top tasks and that even a monocular defect in this area would severely affect the ability to perform this task efficiently and confidently.
Example C: No Binocular Field Loss
The patient was a 63-year-old woman, with right eye MD⫺3.5 dB, left eye MD⫺8.5 dB, IVF score 0, and stereoacuity 40 sec arc. She had a significantly delayed MO and reduced MD time compared with the control group and patient group data. Although ttPV and ttPD were similar, she generally displayed a slower PV and longer LVP duration for both near and far objects, suggesting a more tentative approach in reaching. She also displayed a markedly longer ttPGA and GAT when reach-ing for and graspreach-ing the small object. She had no binocular overlapping field defect, but examination of her VF plots re-vealed a small, dense inferior nasal central defect in the right
eye and a dense upper nasal defect in the left eye (Fig. 9). In view of her more tentative approach to reaching and grasping, we may speculate that this small inferior field defect close to fixation impeded her ability to locate objects on a table top and that possibly the smaller object was more difficult to see as it fell within the location of her field defect.
D
ISCUSSIONThis is the first study to examine the reaching-and-grasping behavior of patients with glaucoma. The results suggest that patients with glaucoma exhibit delays in movement planning and initiation and make slower, more tentative reaches to table top objects particularly at further distances, but show few differences in grasp–posture programming or grip execution compared with normal control subjects.
In both binocular and monocular viewing conditions, the patients exhibited prolonged MO times compared with the control subjects, suggesting an impairment of initial movement planning. A recent study by Geruschat and Turano32
showed that reaction times (RTs) to a secondary task were slower in patients with glaucoma when undertaking a primary mobility task, and that RTs increased with increasing VF defect. Al-though in this study, reaching and grasping was the primary (and only) task, the significantly reduced MO in this group may be evidence that patients with glaucoma just react slower, or possibly that significant asymmetries in VF lead to longer neu-ral processing times. These possibilities will be the subject of further study. Of the three patients in the examples, the patient with the most severe binocular IVF score had an MO time that fell within patient group median values. Although the defect was severe, it was confined solely to the upper VF, giving the patient an unimpaired view of the table. In contrast, the two patients with a monocular inferior field loss and minor binoc-ular losses showed distinct delays in MO. It has been shown that patients with advanced binocular VF loss display differ-ences in visual search patterns compared with control sub-jects, making fewer saccadic eye movements and longer fixa-tions, possibly due to a lack of peripheral stimulation.33
We postulate that it is not just the severity, but also the location of field defect that has the greatest impact on movement
plan-FIGURE6. Similarities in PGA size between the patient (;) and con-trol (䡺) groups in each viewing condition. The plots are as described in Figure 3. There are no significant differences between the patient and control groups. However, the patient group exhibits a larger degree of between-subject variability.
FIGURE5. Differences in LVP between the patient (;) and control (䡺) groups in each viewing condition. The plots are as described in Figure 3. The patients exhibited significantly longer LVP times when reaching for the object in the far location. *Significant differences at
[image:6.594.45.285.55.254.2] [image:6.594.303.543.485.683.2]ning. Patients take longer to localize a table-top object if it falls within the area of their defective VFs, even if it is present in only one eye, as displayed by patient example C. However, this is the subject of further research.
We found that once the object had been localized, the programmed reach parameters—that is, the PV, ttPV, and ttPD—were similar between the groups. However, Spearman’s correlation analysis shows that times to reach PV and PD
TABLE2. Correlation between Visual Field Defect Severity, Participant Age, and Stereoacuity on Movement Kinematics toward an Object in a Far Location under Binocular Conditions
Binocular Age (y)
Stereoacuity
(sec arc) IVF Score
General
MO (ms) 0.20 (0.270) 0.29 (0.112) 0.55* (0.001) OMD (ms) 0.20 (0.280) 0.30 (0.096) 0.32 (0.075) Reach parameters
PV (mm/s) 0.00 (0.992) 0.02 (0.910) ⫺0.34 (0.058) ttPV (ms) 0.07 (0.711) 0.09 (0.616) 0.52* (0.002) ttPD (ms) ⫺0.02 (0.919) ⫺0.13 (0.461) 0.37† (0.037) LVP (ms) 0.19 (0.302) 0.43† (0.015) 0.29 (0.108) Grasp parameters
ttPGA (ms) 0.10 (0.604) 0.15 (0.421) 0.48* (0.006) GCT (ms) ⫺0.14 (0.431) 0.22 (0.229) 0.16 (0.392) PGA (mm) 0.18 (0.334) 0.24 (0.180) 0.06 (0.753) GOC (mm) 0.18 (0.322) 0.06 (0.744) 0.28 (0.122) GAT (ms) 0.04 (0.835) 0.01 (0.945) 0.29 (0.104) Path length (mm) 0.01 (0.971) 0.12 (0.523) 0.05 (0.806)
Data are correlations obtained by Spearman’s rho (P). Age had no effect on movement kinematics in binocular viewing conditions. Subjects with worse VF defect reached maximum speeds and deceleration earlier in the movement, whereas subjects with worse stereoacuity displayed longer times in the final approach to the object (i.e., longer LVP).
* Significant atP⬍0.01. † Significant atP⬍0.05.
TABLE3. Patient Example Data Compared with Control and Patient Group Medians
Parameter
Patient Group Median
Control Group Median
Example A
Example B
Example C
MO (ms) 500 425 525 500 682
MD (ms) 967 833 920 1125 1158
PV (mm/s)
Near 622 635 689 562 571
Far 964 961 1035 817 905
ttPV (ms)
Near 254 225 250 300 250
Far 300 263 317 400 350
ttPD (ms)
Near 383 350 367 400 400
Far 442 429 483 600 467
LVP duration (ms)
Near 275 225 317 300 383
Far 396 329 400 450 500
PGA (mm)
Large 87 85 93 85 80
Small 69 65 78 66 58
ttPGA (ms)
Large 488 450 442 450 475
Small 504 458 583 716 850
GCT (ms)
Large 204 179 192 300 367
Small 221 175 250 250 250
GAT (ms)
Large 183 163 150 250 167
Small 129 154 133 200 290
GOC (ms)
Large 60 58 65 63 55
Small 43 39 49 36 34
[image:7.594.113.474.78.251.2] [image:7.594.46.544.397.704.2]occurred sooner in the movement with increasing severity of VF defect, suggesting an initial misjudgment of object position when it was placed in the far location. Group comparisons illustrated that patients showed deficits in online control of reaching movements, as shown by the longer LVP in the patient group, particularly for objects in the far location (Fig. 5).
The effects of restricting absolute field of view (FOV) on prehension tasks have been studied in young, normal adult control subjects. Using specially designed goggles that permit-ted only 10° of binocular central vision, Sivak and MacKenzie21
found an overall longer movement execution time compared with normal, full vision. This effect was explained by delays in the late transport component, with longer post-PD movements suggesting that subjects incorrectly estimated object distance in these restrictive peripheral conditions. Watt et al.22
per-formed a similar experiment in five reduced FOV conditions and found a consistent underestimation of object distance which increased linearly with reducing FOV. Loftus et al.23
have suggested that reducing FOV results in an increased variability in movements and less precision of online control and that degraded visual information leads to more cautious movements.
Increasing object distance from the subject increases the index of task difficulty, resulting in longer movement duration
(Fitt’s law, cited in Ref. 34), which explains why the control group exhibited longer LVPs with the object in the far location. The LVP was further prolonged in patients with glaucoma, suggesting a deficit in online control that became more appar-ent as the object was placed farther away.
Efficient reaching requires precise visual information of the goal object’s location within its surroundings, as well as con-tinually updated visual information of the position of the hand relative to the object.23,35,36
A visually rich environment will provide more information regarding the object’s position within the scene and relative to the approaching hand, leading to an increased speed and accuracy of reach. Reducing the FOV, degrades the visual information available, leading to a degree of perceptual uncertainty. This in turn, results in a more tentative approach to the object.23
Our patient group exhib-ited VF defects of various depths which would have altered the visual information available to execute an efficient reach to the object.
In addition to the severity of VF defect, another factor shown to correlate with reach parameters, in particular the LVP, was stereoacuity. Although there were statistically signif-icant differences in stereoacuity between the two participant groups, it has been suggested that a clinically acceptable level of stereoacuity is 60 sec arc,37
with up to 100 seconds of arc being classified as stereonormal.38
Thus, the participants we
FIGURE7. Example A. VF defect (gray scale): right eye MD⫺12.6 dB, left eye MD⫺16.5 dB, and IVF score 34.
[image:8.594.46.545.58.240.2] [image:8.594.46.543.539.721.2]studied did not fall into the stereodeficient range. However, even with subtle intergroup differences, our analysis showed that the time spent in the final approach to the object (i.e., the LVP) correlated significantly with stereoacuity levels. The ef-fects of binocular vision on prehension have been extensively studied in our laboratory.29,30,39
Recently, prehension move-ments were characterized in normal subjects who were pre-sented with either a small monocular blur that induced a decrement in binocular stereoacuity or horizontally placed prisms to alter vergence-induced distance information. We found that binocular disparity processing primarily influenced the control of grasp posture and, to a lesser extent, end-phase reaching. In contrast, vergence contributed to aspects of reach planning.39
In the present study, we found that stereoacuity contributed to the end-phase reaching, but not to grasp param-eters, although the latter finding may be explained by the limited range of stereoacuity in the group studied. However, our data suggest that severity of VF defect and deficits in stereoacuity cannot completely explain the differences in pre-hension kinematics between patients with glaucoma and con-trol subjects.
There were no significant differences in grasping character-istics between the patient and control groups. Sivak and MacK-enzie21
also studied the effects of occluded central vision with unimpeded peripheral vision on reaching and grasping and found that subjects showed earlier times to PGA, wider PGAs, and longer GCTs. They concluded that high-resolution central vision was essential for efficient grasp programming. In their study, all participants had good central acuity (6/12 or better). Previous work has shown that disparity processing is impor-tant for grasp planning and control,29,30
and in the present study, both patients and control subjects had adequate stereoa-cuity (median values: 55 seconds of arc in patient group, 40 seconds of arc in control group). Although group differences in grasp dynamics were not found, there was significant variabil-ity within the patient group, as highlighted by the three exam-ples. Longer times to PGA and GCTs were found in the two patients with asymmetric monocular VF defects, suggesting an impairment of movement planning and control. We have al-ready speculated that the location of these field defects may lead to perceptual uncertainty of object location, and this is further reflected in these delayed grasp characteristics.
There appeared to be no deficits in spatial awareness of object location and size between the control and patient groups, as illustrated by the similar path lengths adopted and GOC. Another observation from the presented data set is that in binocular viewing conditions, both patients and control
subjects performed better than when in monocular conditions, agreeing with previous work from our laboratory and others that have shown an advantage of binocular over monocular viewing for prehension tasks.29,40
In all the cited studies examining the effects of VF restric-tion on reaching and grasping, restricrestric-tion was introduced to normal subjects, and therefore each case acted as its own control, significantly reducing measurement variability. How-ever, the present study comprised two separate subject groups, with the glaucoma group including patients with var-ious degrees of disease asymmetry and severity. Further sources of intersubject variability may include subject lifestyle and general health issues, particularly within this older age group. The presence of comorbidities, such as diabetes or hypertension, and the use of systemic medication may influ-ence overall general functional ability. In our study, more patients than control subjects were taking -blocker medica-tion, which may account for some of the variability in the results. However, ABILHAND scores suggest that both patients and control subjects had similar degrees of manual dexterity. Other sources of variability may lie in selective attention defi-cits, or a reduction in a subject’s functional field (i.e., their ability to simultaneously process central and peripheral visual information). This useful FOV has been shown to decline with age,41,42
and differences in attention processing within and between groups may contribute to the variability of prehen-sion movements observed. It would be useful to measure these additional subject factors in future studies. Although all partic-ipants were allowed a practice run of 6 to 10 movement trials before the recordings, it is likely that there were differences in subjects’ confidence in performing the test procedure, which would also have contributed to the variability. Furthermore, increasing age brings with it a decrease in manual dexterity and strength,43
and while differences in subject group ages and ABILHAND scores were not statistically significant, subjects in the glaucoma group were slightly older. The increased within-group variability of prehension movements displayed by the glaucoma group may in part reflect the slightly older age sampled.
Stereoacuity has been shown to be impaired in patients with glaucoma, with or without VF defects.44,45
However, it has also been shown that both monocular and binocular retinal image defocus affect stereoacuity more profoundly than Snellen visual acuity.46
Thus, although our participants all had relatively good Snellen visual acuity, it is unknown to what extent the impaired stereoacuity in the glaucoma group was caused by the presence of lens opacities that did not affect
high-contrast visual acuity, and what decrement was caused by the disease process itself. These differences would also con-tribute to the within-group measurement variability expressed by the glaucoma subjects.
Nonetheless, despite the considerable intersubject variabil-ity within the patient group, we detected significant differ-ences in movement planning and online control between sub-ject groups. That the movements were impaired in the presence of asymmetrical VF defects and relatively mild binoc-ular deficits is worthy of note. It challenges the general belief that only patients with advanced disease display defects in functional performance.
A further avenue of research that should be explored is the effect of VF defect location on prehension kinematics. As illustrated by the three patient examples, the effect of VF loss in the inferior hemifield appeared to have a greater impact on prehension movements than did severe superior hemivisual VF loss, perhaps because the task presented was to reach out and grasp a table top object. It has been shown that there is a greater density of ganglion cells in the superior hemiretina47
and that the inferior VF has a greater sensitivity compared with the superior hemifield.48 Furthermore, there is evidence to suggest a superior functional performance when visually guided motor actions are performed using the inferior VF.49,50
Patients with macular degeneration are found to perform read-ing tasks much better when usread-ing eccentric viewread-ing locations within the inferior hemifield,51,52
and inferior hemifield losses are known to affect mobility performance,53
whereas severe losses increase the risk of motor vehicle crashes.54
The two patient examples illustrated had inferior losses in only one eye, and we may speculate that in view of the importance of the inferior hemifield for most other visually guided motor tasks, the effect of monocular inferior VF losses may be more pro-found when asked to perform a table-top task. This requires further study.
The purpose of this study was to examine prehension kine-matics in real-world patients with glaucoma—that is, individu-als with asymmetric VF deficits of various depths. Our data have shown that the depth of VF defect and differences in stereoacuity cannot fully explain our findings, particularly when we examine individual patient data, where some with marked VF loss exhibit little deficits in prehension whereas others with mild loss appeared severely impaired.
Studies using self-reports of functional ability have assessed the impact of VF losses on the ability to perform daily tasks, finding very modest correlations between task difficulty and depth of VF defect,55,56
suggesting that defects in the VF cannot fully explain our patients’ experiences with the disease. A criticism of self-reports is that they are subjective measures of disability, in that they rely on patients’ assessment of the task’s relative difficulty and their perceptions of their ability to per-form that task. This study has shown an impairment of actual functional performance in patients with glaucoma, albeit in laboratory conditions. Further work assessing a more homoge-neous sample of patients with glaucoma may yield greater information as to how kinematic parameters are affected at the different stages of the disease and whether our current clinical measures of visual disability, such as the VF test, are adequate predictors of the difficulties faced by this patient group.
Acknowledgments
The authors thank Deborah Kamal and David Garway-Heath (Glaucoma Research Unit, Moorfields Eye Hospital, London) for permitting recruit-ment of patients from their clinics.
References
1. Resnikoff S, Pascolini D, Etya’ale D, et al. Global data on visual impairment in the year 2002.Bull World Health Org.2004;82(11): 844 – 851.
2. Tuck MW, Crick RP. The age distribution of primary open angle glaucoma.Ophthalmic Epidemiol. 1998;5(4):173–183.
3. Viswanathan AC, McNaught AI, Poinoosawmy D, et al. Severity and stability of glaucoma: patient perception compared with objective measurement.Arch Ophthalmol.1999;117(4):450 – 454. 4. Parrish RK 2nd, Gedde SJ, Scott IU, et al. Visual function and
quality of life among patients with glaucoma.Arch Ophthalmol.
1997;115(11):1447–1455.
5. Mills RP, Janz NK, Wren PA, et al. Correlation of visual field with quality-of-life measures at diagnosis in the Collaborative Initial Glaucoma Treatment Study (CIGTS). J Glaucoma. 2001;10(3): 192–198.
6. Jampel HD, Friedman DS, Quigley H, et al. Correlation of the binocular visual field with patient assessment of vision. Invest Ophthalmol Vis Sci.2002;43(4):1059 –1067.
7. Feinstein AR, Josephy BR, Wells CK. Scientific and clinical prob-lems in indexes of functional disability.Ann Intern Med. 1986; 105(3):413– 420.
8. Turano KA, Rubin GS, Quigley HA. Mobility performance in glau-coma.Invest Ophthalmol Vis Sci.1999;40(12):2803–2809. 9. McGwin G Jr, Mays A, Joiner W, et al. Is glaucoma associated with
motor vehicle collision involvement and driving avoidance?Invest Ophthalmol Vis Sci.2004;45(11):3934 –3939.
10. Adler G, Bauer MJ, Rottunda S, et al. Driving habits and patterns in older men with glaucoma.Soc Work Health Care. 2005;40(3):75– 87.
11. Owsley C, McGwin G Jr, Sloane ME, et al. Timed instrumental activities of daily living tasks: relationship to visual function in older adults.Optom Vis Sci. 2001;78(5):350 –359.
12. Owsley C, Sloane M, McGwin G Jr, et al. Timed instrumental activities of daily living tasks: relationship to cognitive function and everyday performance assessments in older adults. Gerontol-ogy. 2002;48(4):254 –265.
13. Ross CK, Stelmack JA, Stelmack TR, et al. Preliminary examination of the reliability and relation to clinical state of a measure of low vision patient functional status.Optom Vis Sci. 1991;68(12):918 – 923.
14. Szlyk JP, Fishman GA, Grover S, et al. Difficulty in performing everyday activities in patients with juvenile macular dystrophies: comparison with patients with retinitis pigmentosa.Br J Ophthal-mol.1998;82(12):1372–1376.
15. Szlyk JP, Seiple W, Fishman GA, et al. Perceived and actual perfor-mance of daily tasks: relationship to visual function tests in indi-viduals with retinitis pigmentosa.Ophthalmology. 2001;108(1): 65–75.
16. Altangerel U, Spaeth GL, Steinmann WC. Assessment of function related to vision (AFREV).Ophthalmic Epidemiol.2006;13(1):67– 802006.
17. Jeannerod M. Mechanisms of visuomotor coordination: a study in normal and brain-damaged subjects. Neuropsychologia. 1986; 24(1):41–78.
18. Fortenbaugh FC, Hicks JC, Hao L, et al. Losing sight of the bigger picture: peripheral field loss compresses representations of space.
Vision Res.2007;47(19):2506 –2520.
19. Friedman DS, Freeman E, Munoz B, et al. Glaucoma and mobility performance: the Salisbury Eye Evaluation Project. Ophthalmol-ogy.2007;114(12):2232–2237.
20. Turano KA, Geruschat DR, Stahl JW, et al. Perceived visual ability for independent mobility in persons with retinitis pigmentosa.
Invest Ophthalmol Vis Sci.1999;40(5):865– 877.
21. Sivak B, MacKenzie CL. Integration of visual information and mo-tor output in reaching and grasping: the contributions of periph-eral and central vision. Neuropsychologia.1990;28(10):1095– 1116.
22. Watt SJ, Bradshaw MF, Rushton SK. Field of view affects reaching, not grasping.Exp Brain Res. 2000;135(3):411– 416.
reduce precision and may cause calibration problems.Exp Brain Res.2004;158(3):328 –335.
24. Gonzalez-Alvarez C, Subramanian A, Pardhan S. Reaching and grasping with restricted peripheral vision. Ophthalmic Physiol Opt.2007;27(3):265–274.
25. Castiello U, Bennett KM, Mucignat C. The reach to grasp move-ment of blind subjects.Exp Brain Res.1993;96(1):152–162. 26. Crabb DP, Viswanathan AC, McNaught AI, et al. Simulating
binoc-ular visual field status in glaucoma. Br J Ophthalmol 82(11):1236 – 1241,1998.
27. Crabb DP, Fitzke FW, Hitchings RA, et al. A practical approach to measuring the visual field component of fitness to drive. Br J Ophthalmol. 2004;88(9):1191–1196.
28. Crabb DP, Viswanathan AC. Integrated visual fields: a new ap-proach to measuring the binocular field of view and visual disabil-ity.Graefes Arch Clin Exp Ophthalmol.2005;243(3):210 –216. 29. Melmoth DR, Grant S. Advantages of binocular vision for the control
of reaching and grasping.Exp Brain Res. 2006;171(3):371–388. 30. Grant S, Melmoth DR, Morgan MJ, et al. Prehension deficits in
amblyopia.Invest Ophthalmol Vis Sci.2007;48(3):1139 –1148. 31. Penta M, Thonnard JL, Tesio L. ABILHAND: a Rasch-built measure
of manual ability.Arch Phys Med Rehabil.1998;79(9):1038 –1042. 32. Geruschat DR, Turano KA. Estimating the amount of mental effort required for independent mobility: persons with glaucoma.Invest Ophthalmol Vis Sci. 2007;48(9):3988 –3994.
33. Vargas-Martin F, Peli E. Eye movements of patients with tunnel vision while walking. Invest Ophthalmol Vis Sci. 2006;47(12): 5295–5302.
34. Harris CM, Wolpert DM. Signal-dependent noise determines motor planning.Nature.1998;394(6695):780 –784.
35. Loftus A, Servos P, Goodale MA, et al. When two eyes are better than one in prehension: monocular viewing and end-point vari-ance.Exp Brain Res. 2004;158(3):317–327.
36. Connolly JD, Goodale MA. The role of visual feedback of hand position in the control of manual prehension. Exp Brain Res.
1999;125(3):281–286.
37. Elliott DB. Post-refraction binocular vision testing.Clinical Proce-dures in Primary Eye Care. London: Butterworth-Heinemann: 1999:86.
38. Zaroff CM, Knutelska M, Frumkes TE. Variation in stereoacuity: normative description, fixation disparity, and the roles of aging and gender.Invest Ophthalmol Vis Sci.2003;44(2):891–900. 39. Melmoth DR, Storoni M, Todd G, et al. Dissociation between
vergence and binocular disparity cues in the control of prehen-sion.Exp Brain Res.2007;183(3):283–298.
40. Servos P, Goodale MA, Jakobson LS. The role of binocular vision in prehension: a kinematic analysis.Vision Res.1992;32(8):1513–1521.
41. Ball K, Owsley C. The useful field of view test: a new technique for evaluating age-related declines in visual function. J Am Optom Assoc.1993;64(1):71–79.
42. Ball K, Owsley C, Sloane ME, et al. Visual attention problems as a predictor of vehicle crashes in older drivers.Invest Ophthalmol Vis Sci.1993;34(11):3110 –3123.
43. Shim JK, Lay BS, Zatsiorsky VM, et al. Age-related changes in finger coordination in static prehension tasks.J Appl Physiol.2004;97(1): 213–224.
44. Essock EA, Fechtner RD, Zimmerman TJ, et al. Binocular function in early glaucoma.J Glaucoma.1996;5(6):395– 405.
45. Gupta N, Krishnadev N, Hamstra SJ, et al. Depth perception defi-cits in glaucoma suspects.Br J Ophthalmol.2006;90(8):979 –981. 46. Westheimer G, McKee SP. Stereoscopic acuity with defocused and spatially filtered retinal images.J Opt Soc Am A.1980;70(7):772– 778.
47. Curcio CA, Allen KA. Topography of ganglion cells in human retina.J Comp Neurol.1990;300(1):5–25.
48. McAnany JJ, Levine MW. Magnocellular and parvocellular visual pathway contributions to visual field anisotropies. Vision Res.
2007;47(17):2327–2336.
49. Danckert J, Goodale MA. Superior performance for visually guided pointing in the lower visual field.Exp Brain Res.2001;137(3– 4): 303–308.
50. Brown LE, Halpert BA, Goodale MA. Peripheral vision for percep-tion and acpercep-tion.Exp Brain Res.2005;165(1):97–106.
51. Frennesson C, Nilsson SE. The superior retina performs better than the inferior retina when reading with eccentric viewing: a com-parison in normal volunteers. Acta Ophthalmol Scand. 2007; 85(8):868 –970.
52. Petre KL, Hazel CA, Fine EM, et al. Reading with eccentric fixation is faster in inferior visual field than in left visual field.Optom Vis Sci.2000;77(1):34 –39.
53. Turano KA, Broman AT, Bandeen-Roche K, et al. Association of visual field loss and mobility performance in older adults: Salisbury Eye Evaluation Study.Optom Vis Sci.2004;81(5):298 –307. 54. Rubin GS, Ng ES, Bandeen-Roche K, et al. A prospective,
popula-tion-based study of the role of visual impairment in motor vehicle crashes among older drivers: the SEE study.Invest Ophthalmol Vis Sci.2007;48(4):1483–1491.
55. Noe G, Ferraro J, Lamoureux E, et al. Associations between glau-comatous visual field loss and participation in activities of daily living.Clin Exp Ophthalmol.2003;31(6):482– 486.
56. McKean-Cowdin R, Varma R, Wu J, et al. Severity of visual field loss and health-related quality of life.Am J Ophthalmol.2007;143(6): 1013–1023.
A
PPENDIXDetailed Kinematic Data
TABLEA1. General Kinematic Data
General Kinematics
Binocular Better Eye Worse Eye
Patient Control Difference Patient Control Difference Patient Control Difference
MO (ms) 500 (465–577) 425 (383–479) 75,P⬍0.0001 546 (458–604) 433 (400–481) 113,P⬍0.0001 538 (492–619) 433 (400–483) 105,P⬍0.0001 OMD(ms) 967 (809–1142) 833 (727–998) 134,P⫽0.06 1063 (844–1342) 854 (744–1098) 209,P⬍0.05 1100 (917–1263) 883 (742–1090) 217,P⬍0.01
TABLEA2. Reaching Characteristics of Study Participants
Reaching Component
Object Position
Binocular Better Eye Worse Eye
Patient Control ⌬ Patient Control ⌬ Patient Control ⌬
PV (mm/s) Near 622 (531–717) 635 (551–766) ⫺13 625 (547–715) 636 (568–776) ⫺11 661 (569–737) 643 (577–795) 17 Far 964 (797–1080) 961 (879–1197) 3 946 (833–1089) 953 (880–1196) ⫺7 990 (841–112) 1001 (896–1180) ⫺11
ttPV (ms) Near 254 (206–300) 225 (183–242) 29 267 (217–294) 242 (194–267) 25 250 (204–300) 221 (185–267) 29
Far 300 (252–338) 263 (233–283) 38 300 (250–350) 267 (235–315) 33 296 (244–338) 275 (250–321) 21 ttPD (ms) Near 383 (356–433) 350 (310–398) 33 367 (350–438) 379 (327–400) ⫺13 375 (323–427) 350 (300–404) 25 Far 442 (408–515) 429 (383–527) 13 433 (400–510) 458 (400–515) ⫺25 442 (398–544) 433 (388–533) 8 LVP duration (ms) Near 275 (183–354) 225 (142–265) 50 300 (192–433) 225 (188–304) 75 346 (304–431) 262 (179–338) 84*
Far 396 (333–531) 329 (237–373) 67* 467 (404–556) 338 (258–471) 129* 458 (404–602) 346 (269–444) 112* Path length (mm) Near 257 (243–263) 250 (236–260) 7 258 (239–268) 249 (231–266) 9 257 (238–271) 252 (236–260) 5
Far 462 (445–483) 455 (437–482) 7 467 (434–475) 338 (434–476) 13 458 (439–488) 346 (437–479) 6
Data shown are the median (IQR). The patients and control subjects showed similar PV, ttPV, and PD when reaching for objects in all three viewing conditions. Low-velocity profiles were significantly longer for patients when reaching for the object in a far location. There were no differences in path length adopted to reach either the near or far objects, suggesting no impairment of spatial awareness in the patient group.⌬, difference.
*P⬍0.05 (Mann-Whitney U test).
TABLEA3. Grasping Characteristics of Study Participants
Grasping Component
Object Size
Binocular Better Eye Worse Eye
Patient Control ⌬ Patient Control ⌬ Patient Control ⌬
PGA (mm) Large 87 (79–97) 85 (80–90) 2 87 (80–97) 86 (81–91) 1 88 (80–97) 88 (81–94) 0
Small 69 (63–79) 65 (59–74) 4 74 (68–87) 73 (65–77) 1 72 (67–87) 72 (64–80) 0
ttPGA (ms) Large 488 (435–650) 450 (350–596) 38 504 (450–646) 467 (379–558) 37 488 (406–623) 467 (383–615) 21 Small 504 (415–615) 458 (392–556) 46 513 (446–704) 450 (375–575) 63 513 (463–640) 483 (373–588) 29
GCT (ms) Large 204 (129–300) 179 (144–258) 25 267 (167–363) 213 (167–267) 54 308 (208–383) 225 (144–279) 83
Small 221 (146–258) 175 (129–231) 46 242 (165–333) 196 (135–265) 46 242 (173–327) 196 (144–254) 46
GOC (mm) Large 60 (57–64) 58 (53–61) 2 59 (54–68) 59 (55–62) 0 59 (56–67) 62 (58–66) ⫺3
Small 43 (36–49) 39 (32–48) 4 48 (41–54) 45 (38–55) 3 49 (43–57) 46 (40–54) 3
GAT (ms) Large 183 (150–242) 163 (133–200) 20 200 (146–292) 183 (150–221) 17 217 (150–275) 200 (150–250) 17