relationship between morphological features and acoustical properties of the external ear of bat species. The beam pattern ofRousettus leschenaultii’s right ear is measured and compared to that of receiver structures whose design is inspired by the bat ear itself and made of appropriate geometric shapes. The regular shape of these receivers makes it possible to control the key reception parameters and thus to understand the effect on the associated beam pattern of the parameters themselves. Measurements show one receiver structure has a beam pattern very similar to that ofR. leschenaultii’s ear, thus explaining the function of individual parts constituting its ear. As it is applicable to all bat species, this approach can provide a useful tool to investigate acoustics in bats, and possibly other mammals.
1. Introduction
The acoustical properties of the ears play a fundamental role in bat echolocation. Bat species performing echolocation have evolved a huge variety of ear shapes and sizes whose external structure, features and dimensions depend on the task, as well as several parameters [1] such as the frequency range the bat uses to echolocate. The complex shapes of the external ears in bats are known to support target localization [2, 3, 4] and beam formation [5, 6]. A common feature of bat receivers is directionality; indeed, depending on the frequency range, the size of receiver narrows the acoustic beam pattern (the bigger the ear size the lower the frequency of the bat signals necessary to achieve this purpose), this characteristic being addressed as a morphological adaptability [7]. Directionality of the bat ear beam pattern means a lobe is dominant and therefore it constitutes its main feature, as it allows the bat to discriminate between different directions.
Being able to understand and then to replicate acoustical properties as close as possible to those the bats exhibit is therefore crucial not only for biological research but also in the attempt to engineer biomimetic sonar systems which are inspired by bat echolocation. To this extent, this research into bat acoustics has a twofold aim: providing insight into the acoustics of bats and the functionality of their receiver morphology, and implementing the principles on an artificial sonar system.
Biomimetic sonar systems are equipped with an emitter and two receivers to resemble bat mouth and ears, and measure time of flight between emission and reception of the ultrasonic signal and/or spectral information from the target to recover the distance and bearing of the target. In [8], both time and spectral information are combined to locate a target and estimate its distance from the receivers: a time-frequency representation similar to that in the bat cochlea is used. Biomimetic sonar systems are also engineered to recognise objects using echo processing inspired by the mammalian auditory system [9]. Spectral information can be used alone in a bat inspired method to estimate target elevation [10].
The complex structure of bat ears is associated with directional beam patterns. Acoustic simulations and measurements of beam patterns associated with bat ears have previously been carried out [11, 12, 13]. The accuracy bat species demonstrate in locating targets has encouraged the engineering of artificial biomimetic receivers for sonar systems attempting to reproduce echolocation [14, 15]. Research on a mathematical characterisation of the variety of bat ears has also been conducted [16]: bat ears are generated by a linear combination of “eigenears” recovered from averaging of a large number of ears from different bat species. Measurements to understand the role of the tragus have been performed [17], as well as flexible receivers developed to analyse the effect of ear deformations on the associated beam pattern [18].
directional properties as R. leschenaultii. The geometric receiver structure is 22 mm high, 13 mm wide and has a lower aperture of 3 mm. It comprises two truncated cones: the lower one has a linear flare rate while the upper one is parabolic and has a truncation of 10◦ orientation with respect to the vertical plane.
R. leschenaultii’s ear is the inspiration for the design of a receiver structure made of known geometries. The control of constituent parts thus makes it possible to modify the corresponding beam pattern accordingly, and therefore to understand the functionality
of the parts comprising the bat ear itself. Such a strategy is drawn from being inspired by nature which does not mean simply copying natural systems’ working principle or design. Investigation of the natural world should provides us with models and techniques that can lead to novel approaches and technologies.
The modification of known geometries of the template of Fig. 1 B generates further receiver shapes whose acoustical beam patterns are measured and analysed in this paper. Parameters that are modified are: tragus, perimeter shape (circular and elliptical) and perimeter size. Understanding the role these parameters have in the beam pattern corresponding to the final receiver structure will help in analysing the acoustical properties of R. leschenaultii bat ear regarding echolocation purposes. This strategy is of course extendable to other bat species for the same reason. Such a strategy has two main purposes:
(i) understanding the role of different parts constituting the external receiver of a bat specie in order to get more insight into bat acoustics and
(ii) improving the design of biomimetic receiver structures.
Furthermore, these measurements were performed using a robotic arm which was deployed to this task for the first time. The accuracy of this robot along with the short execution time to complete the task ensure reproducibility of the experiments described in the following.
This paper is structured as follows: Section 2 illustrates the procedure of designing and building the receiver structures; Section 3 describes the experiments of measuring the beam pattern of these receivers, whose results are in Section 4. These results are discussed and commented in Section 5, while final conclusions on the utility and applicability of such a strategy and choice of the best bioinspired receiver are drawn in Section 6.
2. Receiver Shapes
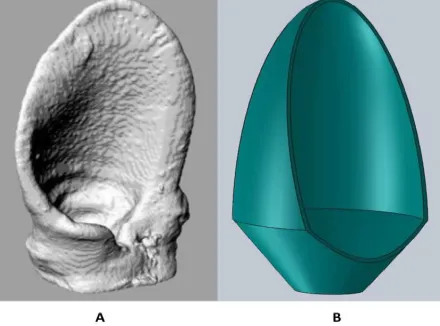
Fig. 1 A shows a 3D rendering of the bat ear recovered from micro CT scanning while Fig. 1 B is the basic template designed from observations of bat ear features. R. leschenaultii’s ear is composed of a lower part which widens almost linearly, a small tragus, and an upper pinna with a parabolic flare rate as it closes. These features suggest the structure of the template of Fig. 1 B whose lower part is modelled as a cone with linear flare rate, while its upper part has a parabolic flare rate.
The 3D printing facility at the University of Strathclyde was used to produce the receiver shapes from STL files.
2.1. Design
A 3D printed version of the R. leschenaultii right ear from micro-CT scanning is shown in Fig. 1 A. This bat ear measures 20 mm in height, 19 mm in its widest point and a maximum of 7.5 mm in depth, while the aperture at the bottom is approximately 3 mm by 2 mm. R. leschenaultii uses echolocation signals with most of the acoustic energy concentrated in the range [20,32] kHz.
To understand how the features in this bat ear make the acoustic field so direcitonal within [20,32] kHz, a geometric model was created in order to analyse its acoustic behaviour under different conditions defined by combinations of those features. The receiver model in Fig. 1 B allows us to analyse these situations by adding parts to it or modifying its structure. This receiver has a height of 27 mm and, being circular, a width and depth of 20 mm. The circular opening at the bottom of the structure has a diameter of 3 mm, and the thickness of the structure is 0.2 mm. The template is a combination of two truncated cones: the lower one has a linear flare while the upper one has a parabolic flare and is obliquely truncated with an angle of 10◦ with respect
to the vertical plane to resemble the upper opening ofR. leschenaultii’s right ear. The lower cone of the template is intended to geometrically model the lower part of the bat ear.
Figure 1. Bat ear (A) is resembled by the structure (B) consisting of two truncated cones joined together and with an opening in the upper part.
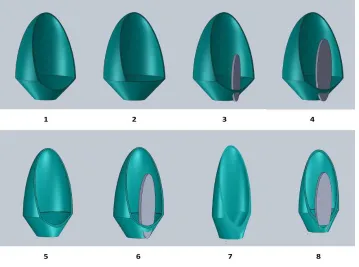
to define other receiver shapes which are shown in Fig. 2. Template 1 in Fig. 2 can be equipped with a lower lip to reduce the upper opening thus giving template 2, and with a flat structure in front of the upper opening to model a tragus (templates 3 and 4). The cone shape can be set to be ellipsoidal instead of circular to resemble more closely the structure of the bat ear (templates 5 and 6, the latter with a tragus). Finally, templates 7 and 8 are obtained by reducing the size of templates 5 and 6, respectively. Each of these modifications were performed singularly and also combined together in order to study the effect they have on the resulting beam pattern of the receiver. All templates were designed using SolidWorks and saved as STL files to be 3D printed.
Fig. 3 illustrates the 3D printed structures of the templates indicated with numbers 4, 5 and 7 in Fig. 2 along with the printed version of R. leschenaultii’s ear. Receiver structures 4, 5 and 7 are those whose beam patterns will be shown and compared to that of the bat ear in the rest of the paper.
3. Measurement of Beam Pattern
Figure 2. Models of receiver structures designed to investigate the corresponding beam pattern. Structure 1 is the basic template. Receivers 2−4 have circular parimeter
and 3 and 4 have a tragus. Receivers 5−8 have elliptical perimeter among which 6
and 8 have a tragus while 7 and 8 have a smaller size.
Figure 3. Left to right: 3D printed versions of receiver structures 4, 5 and 7, and bat ear.
3.1. Experimental Setup
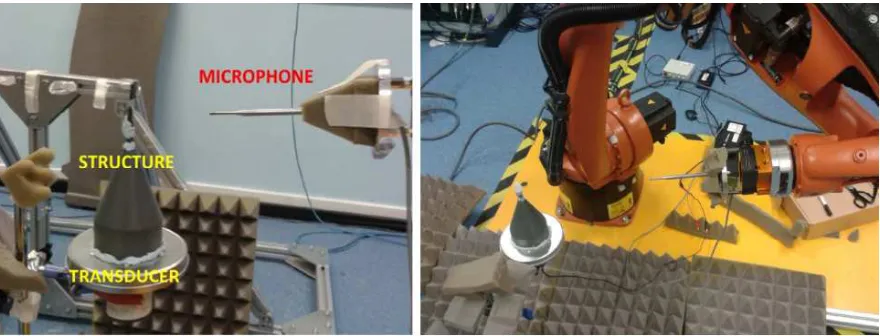
[image:6.595.120.473.442.577.2]Figure 4. Experimental setting for measuring the beam patterns associated with receiver structures. LEFT - An acoustic signal is produced by the loudspeaker at the base of the cone directing the acoustic energy to the receiver structure. The signal from the receiver structure is recorded by the B&K microphone mounted on top of the robot arm. RIGHT - The KUKA robot allows to move the B&K microphone at positions along a spherical surface, centred at receiver location, at which the signal through the structure is recorded.
long hollow tube with an inner diameter of 3 mm to fit the lower opening of the receiver structures was attached to the 5 mm diameter aperture of the cone. In this arrangement, the frontwave of the acoustic pressure travelling through the 3 mm diameter tube and the lower aperture of the receiver structure can be considered flat. The PVC cone and the 3 mm diameter tube between the transducer and the receiver structure are all shown in Fig. 4 A. Blu-tack was used to fix together transducer, cone, tube and receiver, as well as to prevent sound leakage out of the cone structure and to provide uniform coupling. The acoustic signal from the transducer and through the structure was recorded at positions on a quarter of sphere using a 1/8 inch B&K microphone (Br¨uel and Kjær, Type 4138) at a distance of 300 mm from the receiver, and therefore in the far-field. The microphone was mounted on the tip of a robot arm, the KUKA KR5 arc HW (Hollow Wrist) robot [26], as depicted in Fig. 4 A, while the robot arm and the arrangement for the experiment are shown in Fig. 4 B. The KUKA robot is a 6 axes robotic arm. A sensor can be mounted on the tip of the robot arm in order to be placed with high degree of accuracy within an area of positions that can be reached by the robot arm. The KUKA robot is programmable to investigate geometric shapes over which to move the sensor. To this extent, the KUKA robot was used to position a microphone at the desired locations at which the signal from the receiver had to be recorded. The KUKA robot guarantees that measurements are repeatable as further similar measurements can be performed at the same positions.
placed as in the left picture of Fig. 4. Once the structure was placed at this location, the robot with the microphone was settled at positions with 0◦ as elevation and 0◦ and
180◦ as the azimuth in order to properly align the structure to the robot position so
that the edges of the structure corresponded to the extreme azimuth values. While executing this procedure, a misalignment of 5◦ offset angle of the microphone at the
top of the KUKA arm was evaluated: this did not affect the measurement through the B&K microphone for its beam pattern’s main lobe was always ensonified by the signal from the structure in the range of interest [20,40] kHz.
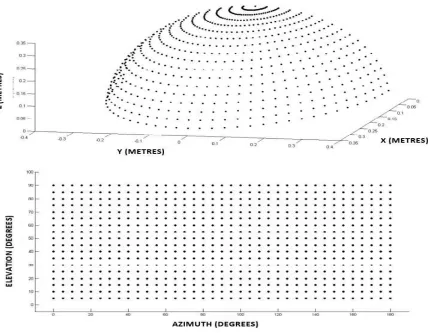
The signal produced by the transducer was a linearly swept chirp with a Hanning window covering frequencies [20,100] kHz and lasting 3 ms. The signal modulated by the receiver structure was recorded at a distance of 300 mm on points of a quarter of a sphere with origin in the receiver structure. The points on this sphere were drawn by the KUKA robot in a grid with 5◦ spacing in azimuth and elevation. The grid of
points was defined by azimuth in [0◦,180◦] and elevation in [5◦,90◦], returning a set
of 667 points where the signal from the transducer was recorded. The measurement experiment was performed using a LabVIEW program that was triggered by the robot moving to a new position and, once triggered, it recorded the signal. The positions where the signal was recorded along the 300 mm quarter of sphere are depicted in Fig. 5 (top). These positions’ coordinates were then converted into a square where X and Y axes refer to azimuth and elevation, respectively, see Fig. 5 (bottom).
3.2. Data Processing
The signal produced by the transducer consisted of 5 replications of a linear chirp with frequency content across [20,100] kHz. An average over these 5 replications was calculated in the frequency domain to recover one acoustic signal for each position, that is for each orientation. The same chirp was calculated from 5 replications with the microphone right in front of the transducer and the cone structure, but without the receiver structure, at the same distance as the recordings with the structure: this is referred to as thereference. For clarity, the signals calculated from the average of those recordings associated with a receiver structure are measurements. Both the reference and the measurements were band-pass filtered from 20 to 100 kHz in order to remove low frequency acoustic noise due to the movements of the KUKA robot arm.
The modulus of the Fourier transform of the reference signalR(f) as well as all the measurementsMi,j(f) were calculated, whereiandj are associated with the orientation the measurement is taken at,
Mi,j(f) = M(θi, φj, f) . (1)
The directivity D of each receiver structure was computed as the ratio between each
Figure 5. TOP - Dots correspond to locations on spherical surface at which the signal from the receiver structure is recorded. BOTTOM - Azimuth and elevation grid corresponding to the same points: this grid is used to contour plot the beam patterns, and between these points where the beam pattern values are measured, 3D linear interpolation is performed.
D(θi, φj, f) =
M(θi, φj, f)
R(f) . (2)
Template Size Description
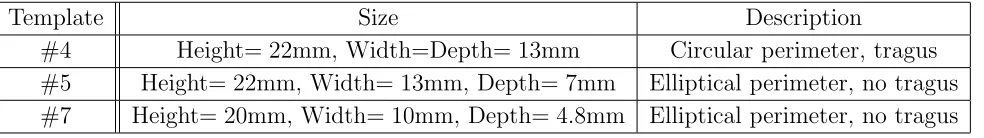
[image:10.595.74.566.88.157.2]#4 Height= 22mm, Width=Depth= 13mm Circular perimeter, tragus #5 Height= 22mm, Width= 13mm, Depth= 7mm Elliptical perimeter, no tragus #7 Height= 20mm, Width= 10mm, Depth= 4.8mm Elliptical perimeter, no tragus
Table 1. Templates’ size and description. Tragus of template #4 is 2 mm wide and 8 mm high.
4. Results
The beam pattern of 3 receiver shapes from those in Fig. 2 are presented in this paper, as they were the most representative in revealing which parameters are the most significant in altering the beam pattern. These receivers are templates 4, 5 and 7. As reported in Table 1, the size of templates 4 and 5 is the same except for the depth, as template 5 has an elliptical perimeter; also template 7 has an elliptical perimeter though its overall size is slightly reduced with respect to the other two templates.
The results are presented as contour plots of the beam patterns for receivers in Table 1. As mentioned in Sect. 1-2, the frequency range where R. leschenaultii concentrates most of its echolocation signal energy is [20,32] kHz [19], therefore the beam pattern contour plots shown in the following are associated with the same frequency range. In this frequency range, comparison between the beam pattern associated with the bat ear and those associated with the receiver shapes 4, 5 and 7 is drawn.
The rows of Fig. 6 show the beam pattern contour plots associated with templates 4, 5 and 7, and, in the last column, with the R. leschenaultii ear, for frequencies 20, 24, 28 and 32 kHz. Beam pattern contour plots are shown for azimuth angles [0◦,180◦]
and elevation angles [5◦,90◦]. For each row, the color bar shows attenuation values
in dB with respect to the maximum gain value (0dB) of the beam pattern. The beam pattern ofR. leschenaultii’s ear presents a main lobe across frequencies with an azimuth extension of approximately [40◦,150◦] and elevation extension [25◦,45◦] roughly in the
frequency range [20,32] kHz. The main lobe position in the azimuth and elevation plane does not change over the considered frequency range.
Contour plots in the first column of Fig. 6 show most of the acoustic energy in template 4 is directed upward at elevations higher than 30◦. Only at frequencies higher
than 35 kHz, that is, out of the considered frequency range, does a significant lobe appear around 25◦-30◦. Hence, despite a size comparable to the bat ear, template 4
does not provide a directional beam pattern.
Template 5 (second column in Fig. 6) is associated with a beam pattern having a main lobe at low frequencies (20 and 24 kHz) which is steered upwards as frequency increases.
beam pattern to R. leschenaultii’s ear, that is, template 7 of Fig. 2.
As the main feature occurring in the beam patterns shown in Fig. 6 is the presence of a main lobe across frequencies and its orientation, the comparison between receivers and their evaluation will consist of measuring the extension of the associated main lobe and the amplitude of its maximum peak across frequencies.
4.1. Evaluation
Beam patterns from receiver templates were evaluated in terms of the beam pattern extension over orientations at some frequency values, and the maximum value of the beam pattern at the same frequencies. The main feature of the beam pattern associated with the bat ear is the presence of a main lobe: therefore, the resemblance of the beam patterns recovered from the receivers 4, 5 and 7 is evaluated by measuring the extension of the beam pattern in the azimuth and elevation, as well as the changing of the beam pattern maximum values across frequencies.
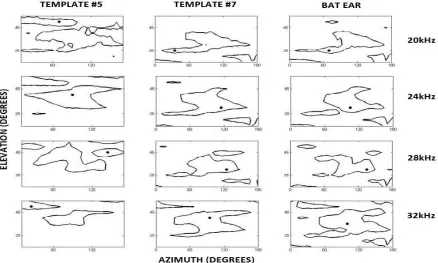
Fig. 7 depicts the contour line delimiting the main lobes (along with other secondary peaks) in the beam patterns in order to visualise the extension of the main lobes in the azimuth and elevation ranges. These extensions were measured using a threshold value. The first column in Fig. 7 shows the contour lines of the beam pattern associated with template 5, the second with template 7 and the third one with the contour from the bat’s acoustic field. Template 4 was not considered as no main lobe appeared in its beam pattern across the frequency range of interest. At 20 kHz, template 5 has a main lobe within the azimuth angles [30◦,180◦] and elevation angles [25◦,45◦].
This is quite different from the extension of template 7 whose main lobe at the same frequency extends to azimuth in [10◦,160◦] and elevation in [25◦,40◦], with the shape
of the beam being narrower and like that of the bat’s beam pattern, whose extension is also in [10◦,160◦] for the azimuth and [25◦,40◦] for the elevation. At frequencies
24 kHz, 28 kHz and 32 kHz the main lobe of template 5 moves upwards and gets narrower showing different orientations of its peak value. On the other hand, the lobe of template 7 appears to be always between azimuth [25◦,150◦] and [25◦,45◦] elevation
Figure 6. Beam pattern associated with templates 4, 5 and 7 and ofR. leschenaultii’s ear at some frequencies in the range [20,32] kHz where the bat uses most acoustic
Figure 7. Evaluation of beam patterns: main lobe extension in azimuth and elevation and orientation of maximum gain in beam pattern of bat compared to those of receivers 5 and 7.
and the bat ear show a few secondary lobes, due to the fact that the maximum value of the main lobe is moderately smaller than at 20 kHz or 25 kHz.
Maximum values of the beam patterns are indicated with a dot in the contour plots of Fig. 7. For template 5 the orientation of the maximum gain is not stable as peaks are detected with different orientations. For template 7 the positions of the maximum gain are more stable for frequencies 28 kHz and 32 kHz as they are located in the same area as that ofR. leschenaultii’s beam pattern, despite the different symmetries of these two receiver shapes: orientation (125◦,30◦) at 28 kHz and (95◦,40◦) at 32 kHz, while for
the bat orientations are (135◦,30◦) at 28 kHz and (100◦,35◦) at 32 kHz. The different
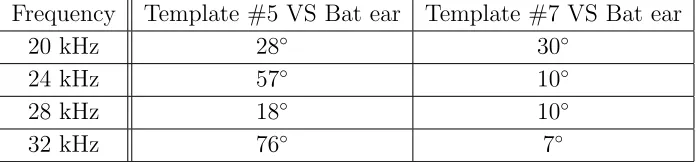
orientations of the maximum gain values for the beam patterns were quantitatively evaluated: Table 2 contains the distance values (in degrees) between orientations of the maximum gain in the beam patterns associated with the templates 5 and 7 and with the bat ear at frequencies 20 kHz, 24 kHz, 28 kHz and 32 kHz.
Frequency Template #5 VS Bat ear Template #7 VS Bat ear
20 kHz 28◦ 30◦
24 kHz 57◦ 10◦
28 kHz 18◦ 10◦
[image:14.595.121.469.89.170.2]32 kHz 76◦ 7◦
Table 2. Angular distance between orientations of maximum value in the beam patterns associated with Template 5 and with bat ear, and between Template 7 and bat ear’s beam patterns.
maxima and minima. The peak values are similar between templates 5 and 7 and the bat ear, though there is more discrepancy in the peak values at frequencies [23,25] kHz. The difference between the peak values of templates 5 and 7 and the bat ear is also seen at 32 kHz. Finally, template 4 shows different local maxima and minima at different frequencies.
Using the values of the beam patterns’ maximum gain, another difference between the templates 5 and 7 from the bat ear is quantified. The maximum values of the beam patterns associated with templates 5 and 7 are expressed as percentage of the maximum value of the bat ear’s beam pattern, at some frequencies. In particular, it is measured that the maximum for Template 5 is 8% of the bat ear’s directivity maximum at 20 kHz and 60% at 24 kHz, while beam pattern’s maximum associated with Template 7 differs between 10% and 30% of bat ear’s directivity maximum at frequencies 20 kHz and 27 kHz.
5. Discussion
In Sect. 4 the effects of modifications to the template in Fig. 1 B on the associated beam patterns were shown. Since the R. leschenaultii ear has a beam pattern dominated by a main lobe, the final receiver structure inspired by it should also be characterised by a beam pattern with a main lobe having an extension in the azimuth and elevation similar to that of the bat. Hence, provided that a similar beam pattern had been recovered, the associated receiver shape would answer the question addressed at the beginning of this paper: what receiver features have the most dominant effect on the beam pattern, and therefore what features in the bat ear are the most important in providing the bat with such a directional acoustic field.
Template 7 of Fig. 6 is associated with a beam pattern having a main lobe in the same region (in the azimuth and elevation plane) and for the same frequency range as the R. leschenaultii bat ear. To design this receiver shape, the main modifications to template 1 of Fig. 2 were a reduction of the size and the introduction of an elliptical perimeter.
Figure 8. Maximum value of main lobe over frequencies in the range [20,32] kHz.
First row shows values for template #4, second row for template #5, third row for template #7 and last row for bat’s ear.
looks like a main lobe does appear at 28 kHz and at higher frequencies, and it is flattened at about 25◦ elevation while it widens over all the azimuthal range. Introduction of a
tragus was suggested by the fact that it would have reduced the upper opening of the template, thus extending the main lobe in the elevation.
The extension over the azimuth plane of the main lobe is associated with binaural hearing in the process of determining azimuthal location of a target. On the other hand, binaural hearing does not produce the same effect in achieving localization in the elevation, thus causing the main lobe to be narrower in the elevation plane in order to compensate for the lack of binaural hearing in this case and to improve the accuracy in localization in elevation.
Widening of the beam pattern across elevation angles is hence accomplished by changing the perimeter of template 1: the elliptical shape makes it possible to reduce the opening along the one dimension associated with the dynamics of the beam pattern in elevation, and leaves unaltered the opening along the other dimension having an effect on the beam pattern along the azimuth. This is evident in the beam pattern of template 7 (see Fig. 6), where the elliptical perimeter promotes directionality with a main lobe that is narrower than that associated with template 5.
Results shown in Sect. 4 make it possible to analyse the effect on the beam pattern of each single modification to receiver 1. In particular, Sect. 4 focusses on the modifications which had the biggest effect on the beam pattern among all the receivers in Fig. 2, namely the elliptical parimeter and the reduction of the size of template 1.
The beam patterns associated with templates 5 and 7 in Fig. 6 show the presence of small secondary lobes at frequencies 20 kHz, 24 kHz and 28 kHz. These sidelobes are located at the edges of the beam pattern domain and not around the main lobe and are probably induced by the interference of the acoustic wave with the edge of the receiver structure.
Finally, the beam pattern maximum gain values across frequencies of templates 5 and 7 in Fig. 8 closely match those of the bat ear.
6. Conclusions
Both the design of bat-inspired receiver shapes and the printing and measurement of their beam pattern are described in this paper. Modifications of the structure of a basic template led to a structure having an elliptical perimeter and no tragus. This receiver structure is associated with a beam pattern having a main lobe in the same azimuth and elevation range as the beam pattern of R. leschenaultii as well as similar attenuation values and their dynamics across frequencies.
The procedure described in this paper has two purposes. The first is taking inspiration from the acoustics of bats’ external receivers in order to implement receiver shapes that have a regular structure which can be geometrically defined and controlled. Such receiver templates represent an important tool in the design of sonar systems which make use of their beam patterns for target localization. The second is proposing a novel technique to quantitatively analyse and understand the role of each part constituting the external ear of a bat specie in order to explore their acoustic function. Such a technique is based on the comparison between the measured beam pattern of a bat receiver and the newly designed receiver templates.
The use of the KUKA robot in measuring the beam pattern of receiver structures and bat external ears is novel. The experiments described in this paper are a new technique guaranteeing short execution time and reproducibility. These characteristics make it possible to compare the real acoustic beam profile of receiver shapes in a quick and reliable way.
features contribute to the final acoustic field and have not been taken into account, i.e. ridges and the outward and inward curve of the receiver edges. These and other parameters will have an effect on the overall beam pattern of the receiver (ridges for instance create spectral notches at high frequencies which play an important role in sound localization). This paper aims to prove the importance of the basic parameters involved in forming the beam pattern of artificially designed receivers inspired by bat ears: the receiver templates shown in Fig. 2 are therefore a first attempt at reducing the complicated shapes of bat ears into a more controllable structure. Further research will take into account other morphological features leading to more complex receiver structures than those in Fig. 2.
The production of a receiver structure like template 7 can benefit sonar systems which take inspiration from bat echolocation, some of which were mentioned in Sect. 1. In [27] receivers with a directional beam pattern are accurate tools to discriminate between the directions the echoes may come from. The emitter produces a broadband signal whose echoes from targets are reflected back to 2 receivers. While distance is recovered from a measurement of time of flight, orientation of the target is estimated from comparison between the receivers’ beam pattern and the attenuation at different frequencies of the received signals. Distance and orientation of the target with respect to the sonar system allow us to estimate the location of the target. Inspiration from bat acoustics is therefore the most useful suggestion in this case on what is the best receiver to perform target localization, and indeed further research was performed to this purpose [28].
spectral notches were not taken into account but can be addressed in follow-on work.
Acknowledgment
The research leading to these results has received funding from the European Research Council under the European Union’s Seventh Framework Programme (FP/2007-2013) / ERC Grant Agreement n. [615030], and the EPSRC Grant EP/G038627/1, New Imaging Systems for Advanced Non-Destructive Evaluation.
[1] Obrist M. K., Fenton M. B., Eger J. L. and Schlegel P. A., What ears do for bats: a comparative study of pinna sound pressure transformation in Chiroptera, Journal of Experimental Biology, 180(1), pp. 119-152, 1993.
[2] Chiu C., and Moss C. F.,The role of the external ear in vertical sound localization in the free flying bat, Eptesicus fuscus, The Journal of the Acoustical Society of America, 121(4), pp. 2227-2235, 2007.
[3] Lawrence B. D. and Simmons J. A., Echolocation in bats: the external ear and perception of the vertical positions of targets, Science, 218(4571), pp. 481-483, 1982.
[4] Wotton J. M., Haresign T. and Simmons J. A.,Spatially dependent acoustic cues generated by the external ear of the big brown bat, Eptesicus fuscus, The Journal of the Acoustical Society of America, 98(3), pp. 1423-1445, 1995.
[5] Kuc R., Model predicts bat pinna ridges focus high frequencies to form narrow sensitivity beams, The Journal of the Acoustical Society of America, 125(5), pp. 3454-3459, 2009.
[6] Wang X. and M¨uller R.,Pinna-rim skin folds narrow the sonar beam in the lesser false vampire bat (Megaderma spasma), The Journal of the Acoustical Society of America, 126(6), pp. 3311-3318, 2009.
[7] Findley J. S. and Wilson D. E., Ecological significance of chiropteran morphology, In Ecology of bats (pp. 243-260). Springer US, 1982.
[8] Reijniers J., Peremans, H., Biomimetic Sonar System Performing Spectrum-Based Localization, Robotics, IEEE Transactions on , vol.23, no.6, pp.1151,1159, Dec. 2007.
[9] Kuc R., Biomimetic sonar recognizes objects using binaural information, The Journal of the Acoustical Society of America, 102(2), pp. 689-696, 1997.
[10] Kuc R., Echolocation with bat buzz emissions: Model and biomimetic sonar for elevation estimation, The Journal of the Acoustical Society of America, 131(1), pp. 561-568, 2012. [11] De Mey F., Reijniers J., Peremans H., Otani M. and Firzlaff U., Simulated head related transfer
function of the phyllostomid bat Phyllostomus discolor, The Journal of the Acoustical Society of America, 124(4), pp. 2123-2132, 2008.
[12] Firzlaff U. and Schuller G.,Spectral directionality of the external ear of the lesser spear-nosed bat, Phyllostomus discolor, Hearing research, 181(1), pp. 27-39, 2003.
[13] Fuzessery Z. M.,Monaural and binaural spectral cues created by the external ears of the pallid bat, Hearing research, 95(1), pp. 1-17, 1996.
[14] Peremans H. and Reijniers J.,The CIRCE head: a biomimetic sonar system, In Artificial Neural Networks: Biological Inspirations-ICANN 2005 (pp. 283-288). Springer Berlin Heidelberg, 2005. [15] Schillebeeckx F., De Mey F., Vanderelst D. and Peremans H., Biomimetic sonar: Binaural 3D localization using artificial bat pinnae, The International Journal of Robotics Research, 0278364910380474, 2010.
[16] Ma J. and M¨uller R., A method for characterizing the biodiversity in bat pinnae as a basis for engineering analysis, Bioinspiration & biomimetics, 6(2), 026008, 2011.
[24] Fahy F. J.,Some applications of the reciprocity principle in experimental vibroacoustics, Acoustical Physics, 49(2), pp. 217-229 (2003).
[25] Whiteley S.,An engineering study into the bisonar system of fruitbats in the genus rousettus, PhD diss., University of Strathclyde, 2013.
[26] KUKA robotics. See http://www.kukarobotics.com/ last viewed September 25, 2014.
[27] Guarato F., Windmill J., Gachagan A., A beam based method for target localization: Inspiration from bats’ directivity and binaural reception for ultrasonic sonar, The Journal of the Acoustical Society of America, Vol. 133 (6), pp. 4077-4086, 2013.

![Figure 8. Maximum value of main lobe over frequencies in the range [20, 32] kHz.First row shows values for template #4, second row for template #5, third row fortemplate #7 and last row for bat’s ear.](https://thumb-us.123doks.com/thumbv2/123dok_us/1590130.111734/15.595.80.512.85.350/figure-maximum-frequencies-values-template-second-template-fortemplate.webp)
