City, University of London Institutional Repository
Citation
:
Rybynok, V.O. & Kyriacou, P. A. (2007). A systematic approach for the accurate non-invasive estimation of blood glucose utilizing a novel light-tissue interaction adaptive modelling scheme. Journal of Physics: Conference Series, 85(012033), doi: 10.1088/1742-6596/85/1/012033This is the accepted version of the paper.
This version of the publication may differ from the final published
version.
Permanent repository link:
http://openaccess.city.ac.uk/14295/Link to published version
:
http://dx.doi.org/10.1088/1742-6596/85/1/012033Copyright and reuse:
City Research Online aims to make research
outputs of City, University of London available to a wider audience.
Copyright and Moral Rights remain with the author(s) and/or copyright
holders. URLs from City Research Online may be freely distributed and
linked to.
A systematic approach for the accurate non-invasive
estimation of blood glucose utilizing a novel light-tissue
interaction adaptive modelling scheme
Rybynok V O and Kyriacou P A
City University, London
Abstract. Diabetes is one of the biggest health challenges of the 21st century. The obesity epidemic, sedentary lifestyles and an ageing population mean prevalence of the condition is currently doubling every generation. Diabetes is associated with serious chronic ill health, disability and premature mortality. Long-term complications including heart disease, stroke, blindness, kidney disease and amputations, make the greatest contribution to the costs of diabetes care. Many of these long-term effects could be avoided with earlier, more effective monitoring and treatment. Currently, blood glucose can only be monitored through the use of invasive techniques. To date there is no widely accepted and readily available non-invasive monitoring technique to measure blood glucose despite the many attempts. This paper challenges one of the most difficult non-invasive monitoring techniques, that of blood glucose, and proposes a new novel approach that will enable the accurate, and calibration free estimation of glucose concentration in blood. This approach is based on spectroscopic techniques and a new adaptive modelling scheme. The theoretical implementation and the effectiveness of the adaptive modelling scheme for this application has been described and a detailed mathematical evaluation has been employed to prove that such a scheme has the capability of extracting accurately the concentration of glucose from a complex biological media.
1. Introduction
Diabetes mellitus is a disease characterized by persistent hyperglycaemia (high blood sugar levels). Since the first therapeutic use of insulin in 1921 diabetes has been a treatable, however chronic condition and the main risks to health are its characteristic long-term complications. These include cardiovascular disease, chronic renal failure, retinal damage which can lead to blindness, nerve damage, erectile dysfunction, to gangrene [1]. Around 1.9 million people in the UK and more than 194 million worldwide have been diagnosed with diabetes. Regular blood glucose testing, especially in Type 1 diabetics, is essential to keep adequate control of the glucose levels and to reduce the chance of long-term complications of the disease [2].
market today. These measurements must be taken several times, up to half a dozen, a day by those with diabetes. The risk of infection and measurement inaccuracy are present with all of the invasive techniques. In addition, to the discomfort caused by the pinprick and the resultant bruising, many diabetics (especially children) do not check their glucose levels as often as recommended and as a result increase their chance of developing hyperglycaemia or diabetic coma.
Advances in technology have allowed the investigation of new techniques for assessing blood glucose in an attempt to find one that is non-invasive, accurate, continuous, easy to use, reproducible and inexpensive. Examples of techniques used for the non-invasive monitoring of blood glucose include fluid extraction from skin (or reverse iontophoresis), interstitial fluid harvesting, non-optical electromagnetic radiation (far infrared (FIR) spectroscopy, radio wave impedance), optical rotation of polarized light, thermal emission spectroscopy, and visible light and near infrared spectroscopy. All of these techniques [3][4] share advantages and disadvantages, as well as have limitations that preclude their routine application for non-invasive monitoring of blood glucose. The main problem experienced with prior attempts at blood glucose measurement is calibration. Because of varying amounts of protein, fats, and water in different people, a single, universal measurement scheme has not been developed yet. Interference in the absorption of these with the absorption of blood glucose has caused the most problems with prior research.
The actual measurement of blood glucose through absorption in the visible to low near infrared light region has the problems of interference through protein and fat absorption. Measurement in the near infrared region has the problems with interference from water [5][6]. Due to the strong interference in the visible and near-infrared bands as mentioned above, none of these optical techniques have currently shown much success when brought to clinical trials. Some of these techniques may also cause mild discomfort when applied to the skin. Also, some of them are designed as single use devices and consequently the expense of these disposables could impede frequent use of the monitor. Therefore, to date there is no widely accepted and readily available non-invasive monitoring technique to quantify blood glucose.
We believe we can develop a new novel invasive optical glucose sensor based on a non-empirical analytical technique called “adaptive modelling measurement” to overcome the calibration problems and to provide continuous and accurate measurements of blood glucose concentration in diabetic patients. The description of this technique and a mathematical evaluation demonstrating how this technique will allow the accurate estimation of blood glucose will be the subject of this paper.
2. Methods
In the methodology, the hypothesis of using a novel adaptive modelling scheme as a basis for the development of a complete system (hardware and software) for the estimation of blood glucose will be explained. A detailed mathematical approach demonstrating the theoretical extraction of blood glucose concentration (based on optical techniques) from a complex biological media will be employed.
2.1. Adaptive modelling measurement technique
Adaptive modelling measurement is a non-empirical analytical technique that will not require individual calibration and in theory it could be used to measure other blood chemical components, apart from glucose. Its implementation for the optical absorption spectroscopy non-invasive blood glucose concentration measurement is presented in Figure 1.
[image:4.595.91.517.533.742.2]This adaptive modelling could be implemented by using either transmittance or reflectance photometric techniques applied to vascular tissue of diabetic patients. This is shown in
Figure 1 as “Vascular tissue”. Properties of interest of the “Vascular tissue” are represented numerically by a vector of parameters X
x1,x2,x3...xn
. The emitted optical radiation wavelength and intensity IE should be selected in such a way so that alteration of any chosen property of the “Vascular tissue” will produce a change in the detected optical radiation ID. One of the properties of the “Vascular tissue” will be glucose concentration, which is represented by one of the parameters in the vector X.The relationship between emitted and detected optical radiation will be established by a mathematical approximation of the “Vascular tissue” defined in Figure 2 as “Vascular tissue
model”. When the parameters in the vector X match the properties of the “Vascular tissue”, then the “Model-detection difference” will become small, and vector X could be accepted as a description of the real properties of the vascular tissue. Mathematically the existence of more than one vector X producing close “Model-detection differences” is possible. Therefore, the “Optical emitter” must emit radiation with a certain number of different intensities, wavelengths and in different geometrical positions in respect to the “Optical
detector” depending on the “Control information set”. Thus, the correct vector X will be the one which produces the smallest “Model-detection difference” for a sufficiently large number of “Control information sets”.
Measurement of glucose concentration using an optical technique employing the adaptive modelling scheme can be represented by the two following nested loops (first nested into second):
1. The “Control information set” is fixed and consequently the “Detected information set” is also fixed. The “Vascular tissue model” takes initial predefined parameters and produces a “Modelled information set”. The “Modelled information set” and the “Detected information set” are subtracted by the “Comparator” to find the “Model-detection difference”. The “Model parameters adaptation” adjusts the parameters striving to decrease the “Model-detection difference” and passes them back to the “Vascular tissue model”. The cycle is repeated until the best matching vector of parameters is found.
2. “Model parameters adaptation” changes the “Control information set” and repeats the first cycle. These repetitions occur until the vector of parameters X which works for all “Control information sets” is found. The information of the glucose concentration is then extracted from the vector of parameters.
This algorithmic blood glucose estimation procedure will allow continuous “auto-calibration” of the blood glucose measuring system, making it efficient without the need of individual calibration. This suggested technique is intended to overcome the empirical calibration problem of existing technologies as outlined above.
2.2. Signal Separation and Information Extraction (SSIE)
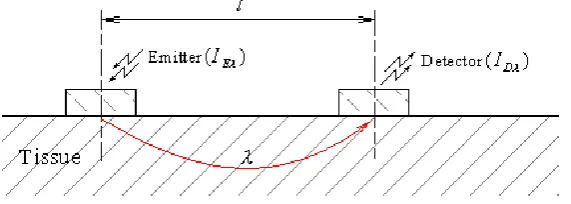
Figure 2 shows the radiation propagation through tissue, between emitter (light emitting diode) and photodetector (photodiode). Where is a monochromatic radiation wavelength,
E
I is an emitted radiation intensity, ID is a detected radiation intensity, and l is a relative emitter–detector position.
2.2.1. Signal separation
The purpose of this subsection is to identify which part of the optical radiation emitted on the biological media is lost either due to scattering or absorption [10][11]. To do that, let IL represent radiation intensity losses in tissue. Then for the wavelength :
E D
L I I
I 1
Modern quantum theory of light postulates that intensity losses occur due to the different kinds of photons scattering and absorption [12][13]. Thus, if S are the losses occurring due to the scattering and A are the losses due to the absorption on light at wavelength , then the following sum can be stated as:
S A
IL 2
Suppose that there is an optical model describing the propagation of the light in the tissue [7][14]-[19]. This model (Figure 2) should provide sufficient approximation of the experimentally obtained light intensity, IL and should allow functional parameterization of the tissue properties and separation of the absorbed and scattered parts of the light intensity losses (like in Equation 2):
) , , ( ) , ,
(
F P l IE G H l IE
E 3
Where E is a model approximation for the radiation intensity losses in the tissue IL; )
, , (P l IE
F is a approximating parameterized function for the radiation losses occurring due
to the tissue scattering S; and G(H,l,IE) is the approximating parameterized function for
the losses occurring due to the tissue radiation absorption A. P
p1,p2,p3...pn
, and
h h h hm
H 1 , 2 , 3 ... are parameter vectors describing scattering and absorption properties
[image:6.595.157.443.199.301.2]of the tissue.
Suppose that the optical measuring device allows the measurement of light intensity losses
L
I at wavelength at k different geometric locations li. Then k sets of variables
l,IE,IL
can be obtained experimentally and substituted into Equation 3: ) , , ( ) , , ( ... ) , , ( ) , , ( ... ) , , ( ) , , ( ) , , ( ) , , ( 2 2 2 2 2 1 1 1 1 1 Ek k Ek k k Ei i Ei i i E E E E I l H G I l P F E I l H G I l P F E I l H G I l P F E I l H G I l P F E k k Lk i i Li L L A S I A S I A S I A S I ... ... 2 2 2 1 1 1 4
If the left system of equations approximates the right system, for the sufficiently high number k of the different experimentally measured variable sets
l,IE,IL
(Figure 2) then the following hypotheses can be stated for each line in Equation 4: li IEi Si P
F( , , ) 5
li IEi Ai H
G( , , ) 6
Equations 5 and 6 mean that the model E in a set of Equations 4 that closely approximates scattered and absorbed parts of the light intensity loses in the tissue. Thus, this set of equations can be rewritten into the following form:
Lk Ek k Ek k Li Ei i Ei i L E E L E E I I l H G I l P F I I l H G I l P F I I l H G I l P F I I l H G I l P F ) , , ( ) , , ( 0 ... ) , , ( ) , , ( 0 ... ) , , ( ) , , ( 0 ) , , ( ) , , ( 0 2 2 2 2 2 1 1 1 1 1 7
“Approximately equal sign” has been intentionally substituted by the “equal sign”. This form corresponds to the ideal case of the “perfect optical tissue model”. Unknown variables in these equations are scalars of the tissue parameters vectors P
p1,p2,p3...pn
, and
h h h hm
H 1 , 2 , 3 ... , total number of those unknown variables is mn. Thus, the number of equations k in the system of Equations 7 required to keep the system solvable is:
n m
k 8
This number determines the minimum amount of the optical emitter-detector combinations in the measuring device required to obtain the variable sets
l,IE,IL
necessary to build a solvable system of Equations 7.allow to eliminate all except one solution by cancelling, mathematically allowable although physiologically impossible, tissue parameters sets H and E.
Unlike an ideal case of the “perfect optical tissue model”, substitution of the physically correct parameters sets H and E into model Equation 3 would result in a model approximation error :
E
IL 9
Practically this error should be less than some pre-required value, which is obtained empirically. This value reflects the required accuracy of the glucose concentration measurement results (e.g. 5%). Thus, each equation in the set of Equations 7 should be changed into model error inequality:
i Ei i Ei
i
Li F P l I G H l I
I ( , , ) ( , , ) 10
It may not be possible to solve such system of inequalities analytically and some adaptive algorithm may have to be used to numerically evaluate P and H tissue parameter vectors.
The number mn will depend on the particular optical tissue model. Selected variable sets
l,IE,IL
must not produce dependency in the system of Equations 7. Thus, the model should be constructed prior to the variable sets selection. Generally, a model of higher complexity should result in better measurements accuracy, although higher complexity would significantly increase the sensor’s hardware and software requirements. Therefore, unnecessary accuracy should be avoided during optical tissue model design, keeping it as simple as measurement results would allow.Assume that the mathematical and physiological correct set of parameters
P,H
describing tissue optical properties on wavelength is found, then those parameters would be the averaged values for all tissue light absorbing components, and they would not allow distinguishing between different components. To evaluate a particular tissue component such as glucose the concentration of more than one light wavelength is required.2.2.2. Information extraction
U U
U U A
U U
U U A
U U
U U A
U U
U U A
i
j j
i j
j j
i i
... ...
....
... ...
...
... ...
... ...
2 1
2 1
2 2
2 2 2 1 2
1 1
1 2 1 1 1
11
Where Uij is the part of the radiation intensity loss at wavelength j, occurring due to the absorption by the tissue component i.
Practically, system of Equations 11 means that if there are 1 components which absorb light on the same wavelengths as glucose, then the measuring device should be able to emit and measure light intensities on at least different wavelengths. Each wavelength must also have k physical channels for Signal separation modelling, in order to distinguish between absorbed and scattered parts of the light intensity losses.
The Beer-Lambert equation is a well known empirical law [12][22] relating light absorbance to absorbing component concentration in simple non-scattering samples. In its roots this equation is a solution of a linear integral of the light intensity losses occurring during light propagation along the straight line through the sample. The basic assumption, taken in the derivation of this integral is that for small parts of the sample mater, light intensity absorbed by the particular sample absorber is proportional to the absorber’s concentration [23][24]. This assumption can be used even if the light does not propagate along straight lines, although the integral in this case will not be linear.
Another assumption used in conventional spectroscopy is that if there are two or more absorbing components in the material then the total sample’s absorption will be the sum of absorptions of each component obtained separately [12]. This assumption is the classic case of the linear superposition principle and it has been used to construct the system of Equations 11. The optical tissue model used in the Signal separation process can be used to create another set of equations. One integral equation should be built for the each absorbing component i in the tissue, which would relate its concentration ci [10], absorbed part of the light intensity Uij at wavelength j and the emitted radiation intensity IEj. To build such equations, absorption coefficients (not the same as Beer-Lambert law absorptivities, although they are related [21]) of the all tissue components on each wavelength j are required:
) , , ,
( i i j j Ej j
i Lc Y P I
U 12
where L is an integral equation; P
p1,p2,p3...pn
are parameters describing scattering property of tissue (obtained during the Signal separation process); and
i j ij i j ijq
j
i y y y y
) , , , ( ... ) , , , ( ... ) , , , ( ) , , ( .... ) , , , ( ... ) , , , ( ... ) , , , ( ) , , ( ... ) , , , ( ... ) , , , ( ... ) , , , ( ) , , ( ) , , , ( ... ) , , , ( ... ) , , , ( ) , , ( 1 1 1 1 2 2 2 2 2 2 2 2 2 1 1 2 2 2 1 1 1 1 1 1 1 1 1 1 1 1 1 1 k E k k k k k E k k i i k E k k k E k k i E i i k k i E i i i i i E i i i E i i E k k E i i E E E k k E i i E E I P Y c L I P Y c L I P Y c L I l H G I P Y c L I P Y c L I P Y c L I l H G I P Y c L I P Y c L I P Y c L I l H G I P Y c L I P Y c L I P Y c L I l H G 13
The only unknown variables in this equations system are tissue components concentrations ci. The number of the equations is equal to the number of the unknown variables, by construction. Thus, in theory, by solving this equations system, component concentrations ci (including glucose) could be found analytically or by adaptation (numerically).
3. Conclusions and discussion
This paper challenges one of the most difficult non-invasive monitoring techniques, that of blood glucose, and proposes a new novel approach that will enable the accurate, and calibration free estimation of glucose concentration in blood. This approach is based on spectroscopic techniques and a new adaptive modelling scheme.
The theoretical implementation and the effectiveness of the adaptive modelling scheme for this application has been presented and a detailed mathematical approach has been employed to prove that such a scheme has the capability of extracting accurately the concentration of glucose from a complex biological media comprised of many light absorbing material such as tissue, venous and arterial blood, water, fat, bone, etc. The mathematical derivation shown above has demonstrated that the accuracy of the glucose concentration depends on the complexity of the model. The more the information in the model relating to others absorbers within the biological media the more accurate the concentration of glucose will be extracted.
This stage of the work paves the way and suggests the software and hardware specifications including the optical glucose sensor design. It also sheds light of what will be the minimum number of wavelengths used for the estimation of blood glucose of an accuracy that will be acceptable by the clinical experts.
Further developmental (software and hardware) and experimental (in vitro) stages are suggested to support the successful implantation of the proposed adaptive modelling scheme.
References
[1] [http://en.wikipedia.org/wiki/Diabetes] – Diabetes mellitus
[2] [http://www.heartstats.org/datapage.asp?id=5340] – Coronary heart disease statistics 2005
[3] Klonoff DC 1997 Noninvasive Blood Glucose Monitoring, Diabetes Care 20(3)
433-437
[4] Malchoff CD 2002 A novel noninvasive blood glucose monitor, Diabetes Care 25(12)
2268-75
Investigation into various optical methods for Non-Invasive Blood Glucose Measurement, Villanova University, ECE Department
[6] Burmeister JJ et al 1998 Phantoms for noninvasive blood glucose sensing with near infrared transmission spectroscopy, Photochem Photobiol.67(1) 50-5
[7] [http://www.ieee.org/organizations/pubs/newsletters/leos/apr98/contents.htm] LEOS newsletter volume dedicated to optical blood glucose monitoring 1998 Leos newsletter12(2)
[8] Mendelson Y et al 1990 Blood glucose measurement by multiple attenuated total reflection and infrared absorption spectroscopy, IEEE Trans Biomed Eng 37(5)
458-65
[9] Bruulsema JT et al 1997 Correlation between blood glucose concentration in diabetics and noninvasively measured tissue optical scattering coefficient, Applied optics
22(3) 190-192
[10] Kienle A et al 1997 Spatially resolved absolute diffuse reflectance measurements for noninvasive determination of the optical scattering and absortion coefficients of biological tissue, Applied optics35(13) 2304-14
[11] Gemert MJ et al 1989 Skin optics, IEEE Trans Biomed Eng.36(12) 1146-54
[12] [http://elchem.kaist.ac.kr/vt/chem-ed/analytic/ac-basic.htm] – Analytical Chemistry Basics
[13] Danzer K 1998 Near-Infrared Diffuse Reflection Spectroscopy for Non-Invasive Blood-Glucose Monitoring12(2)
[14] Arnold MA et al 1998 Phantom glucose calibration models from simulated noninvasive human near-infrared spectra, Anal Chem.70(9) 1773-81
[15] Iyad SS et al 1995 Mie and Rayleigh modeling of visible-lightscattering in neonatal skin, Applied optics34(31) 7410-18
[16] Judith R et al. 1998 Mechanisms of light scattering from biological cells relevant to noninvasive optical tissue diagnostics, Applied optics37(16) 3586-93
[17] Pedersen GD et al 1976 Transport Calculations for Light Scattering in Blood Biophysical Journal16 199-207
[18] Flock ST et al (1989)., Monte Carlo modeling of light propagation in highly scattering tissue--I: Model predictions and comparison with diffusion theory IEEE Trans Biomed Eng.36(12) 1162-8
[19] Flock ST et al 1989 Monte Carlo modeling of light propagation in highly scattering tissues--II: Comparison with measurements in phantoms IEEE Trans Biomed Eng.
36(12) 1169-73
[20] Jason JB 1998 Spectroscopic Considerations for Noninvasive Blood Glucose Measurements with Near Infrared Spectroscopy12(2)
[21] Heise HM 1998 Diffuse Reflectance Near-Infrared Spectrometry for Non-Invasive Blood Glucose Monitoring12(2)
[22] [http://en.wikipedia.org/wiki/Beer-Lambert_law] – Beer-Lambert law
[23] Christie GE 2001 The Art and Science of Chemical Analysis (John Wiley & Sons, Inc.) 138-181