City, University of London Institutional Repository
Citation
:
Grafton, M. A., Fothergill, J., Dissado, L. A., Elgood, S., Stevens, G. C. and
Thomas, J. L. (2001). Controlling flashover between electrode segments in DC power
capacitors. Paper presented at the IEEE 7th International Conference on Solid Dielectrics,
25-29 June 2001.
This is the unspecified version of the paper.
This version of the publication may differ from the final published
version.
Permanent repository link:
http://openaccess.city.ac.uk/1328/
Link to published version
:
Copyright and reuse:
City Research Online aims to make research
outputs of City, University of London available to a wider audience.
Copyright and Moral Rights remain with the author(s) and/or copyright
holders. URLs from City Research Online may be freely distributed and
linked to.
City Research Online:
http://openaccess.city.ac.uk/
[email protected]
CONTROLLING FLASHOVER BETWEEN ELECTRODE SEGMENTS IN DC POWER
CAPACITORS
M.A. Grafton, J.C. Fothergill, L.A. Dissado and J.R.R. Shirley-Elgood G.C. Stevens and J. Thomas Electrical and Electronic Power Engineering Research Group,
Department of Engineering, University of Leicseter
Polymer Research Centre University of Surrey Leicester, LE1 7RH, UK Guildford, Surrey, GU2 5XH, UK
ABSTRACT
Electrical flashover on the surfaces of 10 m polypro-pylene films has been measured in specimens designed to emulate DC power capacitors. The following have been characterised: variation of flashover voltage with gap, statistical variation of flashover voltage, and physical characteristics of film surface before and after flashover. An optimum gap size appears to be less than 300 m as above this there is a significant stress en-hancement from the electrode edges. There may be two mechanisms of flashover and remnant surface charge may be important in determining the subsequent flashover characteristics.
INTRODUCTION
The aim of this research is to gain an understanding of the mechanisms leading to electrical failure in DC power capacitors based on a polypropylene (PP) di-electric and a “self-healing” electrode structure, Con-nolly et al [1]. In this structure the electrode is sec-tioned into small parts, which are interconnected by fusible bridges. If a localised flashover occurs, the bridges connecting that part of the electrode fuse and isolate it from the neighbouring regions. Such a me-thod for „graceful‟ ageing will be reduced in effec-tiveness if surface flashover occurs between the dis-connected sections.
EXPERIMENTAL PROCEDURE
Specimen Preparation
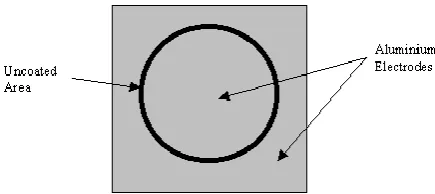
[image:2.595.315.533.293.390.2]All the results in this paper were derived from speci-mens comprising a thin film of capacitor grade PP 9 µm thick with a evaporated coating of aluminium on one side. This was 200 1 nm thick according to the evaporator‟s quartz crystal thickness monitor (Edwards FTM 7). However SEM and AFM measurements of cross sections of the specimens set in epoxy showed the coating was very uneven and varied in thickness from 0.5 to 2.0 m. Flashover took place across an annulus formed in the evaporated aluminium using a circular metal mask. This left a central circular electrode of diameter 47 mm surrounded by a gap, which could be varied from 100 to 1500 m. This is shown in Figure 1.
Fig 1. Specimen for measuring flashover
Experimental Protocol
Samples with gaps of varying width were subjected to automated surface flashover tests. The outer electrode was grounded. A positive voltage was applied to the inner electrode ramped up at 1000V/min until flashover occurred. Following a delay of 20 seconds the process was repeated. The parameters measured were applied voltage, flashover voltage and surface current flowing between the electrodes. The same experiment was undertaken with an extra layer of PP pressed on top of the gap so as to simulate the conditions in a capacitor block. The interface was sealed using silicone oil and de-gassed so that flashover could no longer occur across an air gap. These samples were placed in a test jig with a force applied to an area including the annulus. This force, using weights, was used to emulate the electrostatically produced compressive stress that one would expect for the rated working voltage of the ca-pacitor – typically 100 kPa.
RESULTS AND DISCUSSION
Figure 2: Flashover voltage as a function of annulus width shown with corresponding Paschen curve
For small gaps the flashover voltage appears to be limited by the breakdown strength of the air. At larger gaps (> 300 m) the flashover voltage is limited by other factor(s) for example, the field intensification at the electrode edge. This intensification was calculated using finite elements and the “Paschen values” were scaled down accordingly; these are shown as triangular points with an associated trendline. This suggests that for larger gaps the flashover is likely to be controlled by the stress enhancement.
Preliminary experiments have been carried out in which the annulus is covered by a film of uncoated PP under a pressure of 100 kPa to simulate the electrostatic force between capacitor plates. A thin layer of silicone oil exists in the annulus between the two PP films largely excluding the air. In this case, for a 300 m gap, the flashover voltage is greater than 5 kV. This is rea-sonable as it was found that the breakdown strength of the oil is approximately 2.8 times greater than air suggesting that a 300 m gap would require approx-imately 5.7 kV.
Statistical distribution of flashover voltages The fla-shover test was repeated 100 times for each sample. This is possible as the aluminum electrode evaporates at the flashover site thereby widening the gap and ex-tinguishing the discharge. Subsequent discharges take place at either other parts of the annulus or adjacent to the previous flashover where the remaining aluminum leaves a distorted shape that gives a local field en-hancement. Figure 3 shows results for 6 annuli gaps (with 680 m repeated). The data is shown for the smallest and largest gaps but only best fitting straight lines are shown for the other cases (for the sake of clarity). 0 1 2 3 4
[image:3.595.318.547.94.236.2]0 20 40 60 80 100 Test Number F las hov er V ol tage ( k V )
Figure 3: Increase in flashover voltage with successive flashovers. The gap sizes in increasing order of fla-shover voltage for test 1 were: 120, 220, 540, 680, 940,
680 (repeated) and 1430 m
The voltage can deviate from these trendlines by as much as 500V. The flashover voltage tends to increase for the larger gaps since topographic imperfections and asperities cause reduced flashover voltages. These flashover first. These increasing trends tend to be more prominent at larger gaps. From figure 2 this is likely because the narrower gaps‟ flashover voltages are de-termined by the air (or material in the annulus) whereas the specimen geometry is more influential at larger gaps. At present there is some inconsistency in the results, possibly due to variation in humidity or PP surface preparation, which is reflected in the two dif-ferent sets of results for the 680 m gap.
A statistical analysis of deviations of the flashover voltages from the trend lines (using Weibull statistics) suggests that there may be two mechanisms responsible for flashover.
Physical Characterisation Following a flashover the electrode is found to be eroded in a characteristic “butterfly” shape, figure 4.
Fig. 4: Erosion of electrodes due to a flashover across a
[image:3.595.310.539.546.721.2]This effect has been observed on a repeatable basis and is not well understood at present. However one would expect that the highest field points are the corners in-dicated by an arrow in Fig. 4. This would cause pre-ferential erosion at these points and leave a characte-ristic central protrusion. The surface of the PP is eroded in tracks but these appear to be very clean and not prone to subsequent tracking, Fig. 5.
Fig. 5: Surface tracks that appear on polypropylene
following a flashover event.
[image:4.595.320.532.130.272.2]
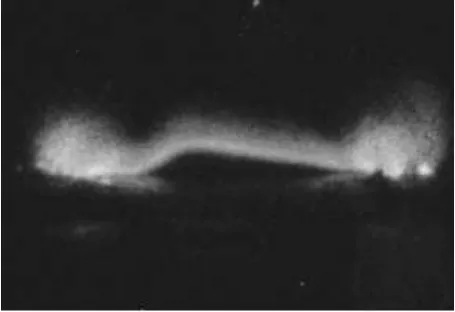
Observation of Arc Fig.6 is a photograph of a typical arc observed during data acquisition. It is evident from the photograph that the arc does not traverse the PP surface but actually „leapfrogs‟ across from electrode to electrode. This may be due to convection from the heat of the arcing plasma but may be due to repulsion of the negative head of the discharge from negative charges trapped on the PP surface.
Fig. 6: Photograph of typical flashover in air
Measurement of Current The current was monitored using a Keithley 617 electrometer and plotted as a function of time. Fig. 7 shows this for a sample with an annulus of 280 m. A conduction (Ohmic) process would give a current that ramped up with voltage whereas a displacement (capacitive) process would result in a constant current since i C.dV dt. Any other dominant characteristics one may find would be due to charge injection and accumulation. In spite of
noise generated by the measurement system, one can observe the Ohmic and capacitive characteristics al-though it was rather difficult to see evidence of charge injection and accumulation on the PP surface.
Fig. 7: Current measured for first flashover
[image:4.595.319.532.366.508.2]For subsequent flashovers on the same sample, the current plot does not start at zero amps. This is shown in Fig.8 for the fifth flashover subsequent to that in Fig. 7.
Fig. 8: Current measured for 5th flashover
In fact the current starts at approximately -6nA due to residual charges left in the system from the previous flashover. Using a dielectric spectroscopy it was found that a typical sample of 300µm annulus had a capacit-ance between the inner and outer electrodes of C=6 pF
5%. Since the first 20 seconds of each test had zero volts applied, the area under this part of the curve represents the remnant charge from the previous test. Using integration it was found that the total charge was approximately 74nC. This cannot be “capacitive” charge for two reasons. Firstly the previous discharge voltage was V=1.55kV at the time of flashover. The maximum charge stored was therefore V.C = 9.3 nC. Secondly the charge is only slowly removing – taking about 20s. It seems likely that this charge is trapped on the surface of the PP in the annulus gap.
[image:4.595.56.284.481.637.2]or charge injection into the PP surface. Further study of this effect is required.
CONCLUSIONS
Surface flashover across narrow gaps (<300 m) of PP film is controlled by the air or oil in which the gap is immersed. For larger gaps the flashover appears to be controlled by the geometrical stress enhancements. The shape of the erosion of the electrode following a fla-shover suggests that electrode asperities give rise to a field enhancement that affects the flashover signifi-cantly. There may be two different flashover mechan-isms. This is requires further work but they may be related to whether or not the flashover is triggered by an asperity or other field enhancement point. There ap-pears to be a significant residual charge on the dielec-tric surface. This is seen in the slowness and magnitude of the charge decay. It may also play some part in forming the shape of the arc.
ACKNOWLEDGEMENTS
The work is carried out with the support of EPSRC grant number GR/M 74238 and with the collaboration of ABB Power T&D, Ellesmere Port, UK whose sup-port is also gratefully acknowledged. The University Of Leicester‟s assistance is acknowledged in providing study leave for J.C. Fothergill. Stephane Holé is thanked for his help with FE calculations.
REFERENCE
1 Connolly, J and Dunn, M.: “High energy density capacitor development at ABB Power T & D”, IEEE ICSD, (1998), p 110-113