City, University of London Institutional Repository
Citation
:
Kopanidis, A., Theodorakakos, A., Gavaises, M. and Bouris, D. (2011). Pore
scale 3D modelling of heat and mass transfer in the gas diffusion layer and cathode channel
of a PEM fuel cell. International Journal of Thermal Sciences, 50(4), pp. 456-467. doi:
10.1016/j.ijthermalsci.2010.11.014
This is the accepted version of the paper.
This version of the publication may differ from the final published
version.
Permanent repository link:
http://openaccess.city.ac.uk/13586/
Link to published version
:
http://dx.doi.org/10.1016/j.ijthermalsci.2010.11.014
Copyright and reuse:
City Research Online aims to make research
outputs of City, University of London available to a wider audience.
Copyright and Moral Rights remain with the author(s) and/or copyright
holders. URLs from City Research Online may be freely distributed and
linked to.
City Research Online:
http://openaccess.city.ac.uk/
[email protected]
Pore scale 3D modelling of heat and mass transfer in the gas diffusion layer
and cathode channel of a PEM fuel cell
A. Kopanidis
a, A. Theodorakakos
b, M. Gavaises
c, D. Bouris
a,*aDept. of Mechanical Engineering, University of Western Macedonia, Bakola & Sialvera, 50100 Kozani, Greece bFluid Research Co, Harilaou Trikoupi 25, 10681 Athens, Greece
cCity University London, Northampton Square, EC1V 0HB London, UK
Keywords:PEMfuelcell, CFD, Carboncloth, PorescalegeometryWatervapourtransport
a b s t r a c t
Floodingofthegasdiffusionlayer(GDL)ofprotonexchangemembrane(PEM)fuelcellscanbeabottlenecktothesystem’s e fficiencyandevendurability
undercertain operating conditions.Due to thesmall scaleandcomplex geometryofthematerialsinvolved,detailed insightinto thepore scale
phenomenathattakeplacearedifficulttomeasureorsimulate.Inthepresenteffort,adirect3DmicroscalemodelofaportionofthePEMcathode
channelandcarbonclothGDLisusedtopara-metricallyinvestigatelocalheatandfluidflowattheGDL’sporescaleandtheireffectsoncondensationof
watervapourthatleadstoflooding.The3Dsimulationthroughthemicroscalegeometryisamongthefirstappearingintheinternationalliterature.The
NaviereStokes,energyandwatervapourtransportequationsaresolvedatsteadystateandinthree-dimensionalspaceforarangeofinletvelocitiesand
clothfibrematerialproperties, usingaconjugateheat transferapproachtocalculate thetemperaturefieldwithinthesolidfibres. Psychrometric
calculationsareappliedtoprovideindicationsoftheconditionsandareasmostpronetocondensationbasedonthecalculatedlocaltemperaturesand
watervapourconcentration.
1. Introduction
Fuel cells are a rapidly developing energy technology which offers major advantages and a broad range of applications in stationary and mobile systems. Its concept lies in the conversion of chemical energy to electricity in a series of fuel cell types for which different reactants and operating conditions apply e.g. Solid Oxide Fuel Cells (SOFCs) and Proton Exchange Membrane (or Polymer Electrolyte Membrane-PEM) fuel cells. In all cases, it has been observed that, at certain operating conditions, parts of the fuel cells may behave as bottlenecks to the whole system’s efficiency and even durability. Characteristic examples are the formation of“hot spots”or“flooding”in the gas diffusion layer of the PEM fuel cell. These phenomena primarily appear at the micro or pore scale of the involved materials and detailed in situ insight into the physical mechanisms is rarely possible. Notable exceptions are recent works involving neutron radiography [1,2,3] which implements the
transparency to neutrons of common materials such as aluminium as opposed to the attenuating properties of hydrogenous materials, such as water. However, the cost and effort required for imple-mentation of these techniques still justifies exploration of other approaches. The present study is one of thefirst appearing in the international literature where the geometry at the pore scale of the Gas Diffusion Layer (GDL) is included in a 3D numerical simulation of theflow and heat transfer in a PEM fuel cell.
Numerous works have dealt with theflow in PEM channels, at a macroscopic level, both experimentally and numerically. Grujicic and Chittajallu[4]found that the optimum PEM cathode geometry is associated with parameters which promote the role of convective oxygen transport to the membrane-catalystecathode interface,
reduce the thickness of the boundary diffusion layer and lower the possibility for cathodeflooding. Quan and Lai[5]have numerically studied the airflow in the cathode channel for various operating conditions with the channel geometry and air inlet velocity as parameters. They found that hydrophilic surfaces increase pressure drop and that two-phase pressure drop inside the airflow channel increases almost linearly with increasing air velocity. A similar study was conducted for various channel geometries by Kumar and Kolar[6], who found that large values of channel heights lead to favourable conditions forflooding. Su et al. [7] have conducted
*Corresponding author. Tel.:þ30 24610 56675; fax:þ30 24610 56676.
studies concerning flooding in PEM fuel cell cathode channels,
finding thatflooding mostly occurs downstream in the serpentine inter-digitated structures and typically at the corners of the chan-nels. This suggests that the design of the path of the flow field should be streamlined in order to decrease the corner effect. Nguyen et al. [8] presented a three-dimensional computational
fluid dynamics model of a PEM serpentine flow channel which, along with a voltage-to-current algorithm, calculates convective and diffusive heat and mass transfer along with local activation overpotential. In terms of temperature effects and water manage-ment, Zong et al.[9]developed a water and thermal management model for PEM fuel cells comparing results from uniform and non-uniform stack temperature models while Khandelwal and Mench
[10]calculated the temperature difference across the thickness of a PEM fuel cell’s porous GDL. Water management has been an object of thorough research[11,12]since it is crucial with regard to the performance of a PEM fuel cell. Most studies focus on the impact of the materials and operating conditions on the conden-sation phenomena taking place at the cell’s cathode. Quick et al.
[12]also quantified and modelled the vapour-water to air diffusion coefficients through experimental measurements and Siegel et al.
[13]introduced a 3D model of the catalyst layer as an agglomerate instead of an homogenous material. There have also been a few experimental studies of the behaviour of water droplets on the surface of common GDL materials and in the channel under the influence of airflow[14,15,16]. However, most of the attention has been directed towards the formation of liquid water above the GDL and in the channel rather than the phenomena at the catalyst layer above the membrane and through the GDL. Finally, there have been attempts at experimental studies of the flow within fuel cell channels, such as the one by Yoon et al.[17]using PIV techniques, but their interest was again focused more on the 180 channel bends rather than the GDL itself.
In all of the cases mentioned above, the physical phenomena at the GDL were approached macroscopically, i.e. either by using the Darcy pressure drop relation as a source term in the momentum equations or by directly measuring macroscopic effects. Since the GDL is usually made of either carbon cloth or carbon paper, both being porous media that are considered to follow Darcy’s law, this approach is acceptable but it provides limited insight regarding the details of theflow and temperaturefield inside the GDL. Only very recently have some publications appeared where the 3D geometry of the GDL microstructure is numerically reconstructed and included in the analysis. Mukherjee and Wang[18]and Kasula et al.
[19]stochastically reconstructed afibrous GDL from 2D electron microscopy while Innoue et al.[20]and Park et al.[21]modelled the GDL as randomly distributed straight cylinders.
The present effort continues in this direction by including a 3D model of the micro/pore-scale geometry of a portion of the PEM cathode channel and woven carbon cloth GDL in a 3D numerical simulation. This is thefirst time a woven carbon cloth is directly modelled at the pore scale as a part of a numerical study to para-metrically investigate the heat and mass transfer induced under various operating conditions. The main objective is to make a connection between the pore scale geometry, the local heat and
fluid flow and the condensation of water vapour that leads to
flooding. Spatial discretisation is performed with a 3D unstructured tetrahedral mesh for both the gas phase as well as the solidfibres, in a conjugate solution of the temperature equation. The steady state momentum, continuity, energy and water vapour conserva-tion equaconserva-tions are numerically solved using a SIMPLE-based algo-rithm. This is similar to previous work[22]where vapour phase transport was not considered and the effect of temperature and
flow field could only be assumed. Quick et al. [12], state that although capillary and/or convective liquid water transport may
(and usually does) exist in the GDL, it is evaporation and water vapour transport that is the dominant transport mechanism. The focus of the present work is on the water vapour transport and it is shown that the representation of the pore scale structure combined with a computationalfluid dynamics (CFD) solution of a represen-tative portion of the macro scale geometry can be used to realisti-cally simulate macroscopirealisti-cally observed characteristics. Numerical results are obtained with regard to channel pressure drop and convective heat transfer and their effect on heat and mass transfer within the porous GDL is evaluated. Parametric studies are per-formed concerning entrance flow velocity, fibre temperature (constant or variable through its solid interior) andfibre material properties. This provides pore scale details for comparison and a better understanding of the heat and mass transfer phenomena, including condensation potential.
2. Modelling approach
The heat and mass transfer through a portion of the cathode channel and the carbon cloth GDL of a PEM fuel cell is considered. Initially, a 3D geometrical model of the carbon cloth, including individualfibres, and the overlying cathode channel was created. The whole domain was spatially discretised with an unstructured tetrahedral mesh in order to directly solve the NaviereStokes and
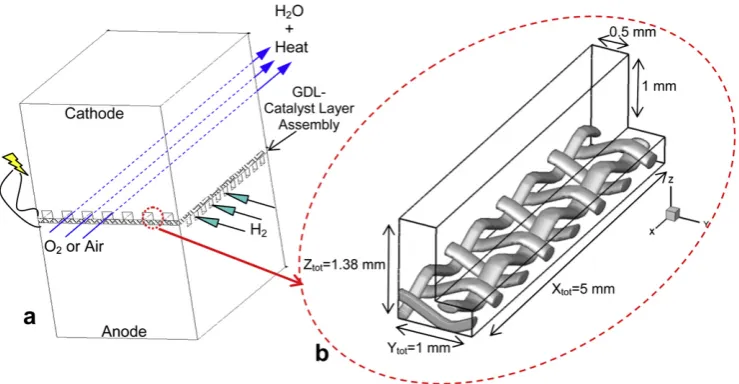
Energy equations, using boundary and operating conditions that will permit investigation of water condensation. The GDL is the part of a PEM fuel cell through which one of the reactants is convected and diffused from the channel towards the membrane and the catalytic substrate, where the reaction takes place (Fig. 1). Here, the dimensions of the cathode channel were chosen according to relevant international literature ([13,23]) and are denoted inFig. 1b. PEM GDLs use either carbon paper or carbon cloth as the diffusing medium, taking advantage of their porous structure and chemical properties. The individualfibres of carbon cloths may be randomly strewn together or in the form of a well defined“knitted”structure
[24]but this is not the case for carbon paper, whose topology is always random and difficult to be defined geometrically (Fig. 2). The“knitted”carbon cloth local topology was the material of choice for modelling in this work.
For reconstructing the geometry of the cloth, periodic repetition of a unitfibre cell was assumed (Fig. 3) in order to give thefibre structure that was included in the computational model (Fig. 1b). This unitary volume was initially created with the Wisetex software package for textile structure simulation[25]and then exported to a commercial 3D computer aided design (CAD) software in the form of a neutralfile (IGES). The 4-fiber volume was scaled to dimensions that were in accordance with relevant measurements from a proprietary carbon cloth sample (Fig. 2b). In the present study, the compression of the carbon cloth within the fuel cell assembly has been assumed uniform, neglecting compression variation due to the more significant forces acting under the lands of the bipolar plate. Although this effect has been documented in the literature
[26], including it here would have involved calculation of the structural deformation of the solidfibres, which goes beyond the scope of the study. However, rather than neglecting deformation altogether, it was assumed uniform across the cloth by taking the
fibres’ cross section to be elliptical thus accounting for tension between them and the overlyingflow channel. The large axis of the elliptical fibre cross section wasd¼0.3 mm, the space between parallel fibres in the large axis direction wasm¼0.4 mm while the cloth’s thickness, i.e. 2 fibres þvoid space perpendicular to the large axis of the elliptical cross section, was Zth ¼0.38 mm
(Fig. 3).
3
¼ VtotVsVtot (1)
Actual clothfibres are in turn made up of thinnerfibres (Fig. 2b) and thus have a porosity of their own. In the present approach, each
fibre is considered solid with noflow through it and afibre porosity value of unity, while a basic weaving structure is applied rather than a random overlaying offibres. However, care has been taken to preserve the overall porosity of the present woven carbon cloth model at
3
¼0.75, which is in accord with common GDL media porosity values of 0.6e0.9[24]. Of course, this implies thattrans-port through the GDL is only possible between and not through the model’sfibres. The full computational domain andfinal structure included thefibres and the channel, leaving the appropriate void space in the cloth (Figs.1b and3c). Based on the constraint that the overall porosity value is preserved, the major characteristics of the
flow are expected to be relevant to the actual situation.
Solution of the flowfield assumed steady state flow for the simulated operating conditions, so time derivatives are omitted
from the equations presented. As far as theflowfield is concerned, the NaviereStokes and continuity equations are solved, for
incompressibleflow:
u
!,Vð
r
!Þ ¼ u VPþmV
2!u (2)V,ð
r
!Þ ¼u 0where (!u) is the velocity vector, (P) is static pressure, (
m
) isfluid dynamic viscosity and (r
) is density, which varies depending on temperature alone. As the portion of the channel being studied is small, the conservation of mass does not take into account water vapour production and oxygen consumption along the computa-tional domain. Reynolds number (Re) defines the kind of theflowfield, since it gives a measure of the inertia forces to viscous forces ratio, thus characterising thefield as laminar or turbulent. HereRe
number is calculated based on hydraulic diameter (Dh):
Re¼ DhUo
r
m
Dh ¼ 4Achan
J (3)
with Uo[ms1] being the mean (or inlet) air velocity, Dh[m] the
hydraulic diameter, Achan[m2] the free path area (including the part
filled with the carbon cloth) of the domain cross section and J [m] the cross-section’s wetted perimeter.
For the temperature field, the energy equation is formulated assuming constant specific heat (Cp) but actually allows for local
variation by solving for the value of (CpT) instead of temperature
alone:
r
!uVðCPTÞ V,
k CPVð
CPTÞ
¼SF (4)
where (T) is temperature, (k) is thermal conductivity and S4 represents any possible heat source terms e.g. thermal source or due to viscosity. In the present case, viscous heat is negligible and there is no other heat generation, soSF¼0. The above system of equations is volume averaged on the unstructured tetrahedral volume mesh and then solved using a SIMPLE-based methodology
[image:4.595.109.479.65.257.2][27]. The finite volume method was used for discretisation with hybrid upwind differencing for the convection terms and second
[image:4.595.37.280.517.724.2]Fig. 2.a) Carbon paper photo b) Carbon clothfibres’detail.
order central differencing for the diffusion and source terms. The code was not parallelised and convergence was assumed when equation residuals fell by at least three orders of magnitude and were also below 0.5% of incoming massflow weighted values.
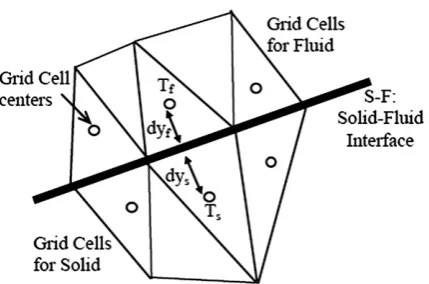
For the case of the conjugate solution inside the fibres, the temperature at the commonfibre-fluid boundary should be given by the equation[28]:
TSF ¼
cksTsþkfTf
cksþkf
(5)
where TS-Fis the temperature at the common boundary, TSis the
temperature of the solid phase, Tfis thefluid temperature and ksand
kfthe thermal conductivity of the solid andfluid respectively. Lastly,
c is the ratio of the normal distance between thefirst mesh node and the solid-fluid boundary on thefluid (dyf) and solid (dys) side (Fig. 4):
c ¼ dydyf
s (6)
Finally, mass conservation for water vapour is expressed through the equation of transport for water vapour concentration YH2O[kgH2Okggm1]:
r
!uVYH2O ¼ V,
r
Dgm;H2OVYH2O
þSH2O (7)
where the index“gm”indicates gas mixture and the source term SH2O
is the production rate of water vapour per unit volume. After volume averaging for the grid cell volume (Vcell). the source term
becomes R
Vcell
SH2OdV ¼m_w,Asurf, wherem_wis the water production
per unit surface of catalyst-membrane layer and Asurfis the surface
of the grid cell volume in contact with the water producing layer. Results regarding water vapour are presented in the form of relative humidity (
4
), which determines proximity to saturation:4
¼ PWPWS
(8)
In (8), PWis the vapour partial pressure while PWSis the
satu-ration pressure, both at the temperature of the mixture. Calculation of the saturation pressure as a function of temperature has been a subject of study for many years and numerous empirical corre-lations have been proposed for various temperature ranges. Bolton
[29]suggests that
PWS ¼ 611,10
7:5T
Tþ237:3 (9)
is acceptable except when extreme accuracy (>2%) is required at very low temperatures, in which case
PWS ¼ 611,eTþ17243:67T:3 (10)
gives an accuracy of 0.1% between30C and 35C. In the previous equations, T is the temperature inC. There are high order poly-nomials [30]that can give better accuracy for a wider range of temperature values but for the present calculations, (9) was considered sufficient.
If the humidity ratio is defined as the ratio of the water mass and the dry air mass [kgH2O kgdry air1 ], then using their molecular
weights and mole fractions (x) will give :
W ¼ mw
mda ¼
18:01528,xw
28:9645,xda ¼
0:62198xw xda
(11)
Assuming ideal gas behaviour, the mole fraction is equal to the ratio of partial pressure to total pressure and(11)gives:
PW ¼
W,P
[image:5.595.132.472.66.265.2]ð0:62198þWÞ (12)
[image:5.595.62.277.584.726.2]Fig. 4.Detail of local grid at the solid-fluid interface.
with P being the static pressure of the mixture [Pa]. The relative humidity can now be calculated from the mixture’s local pressure, temperature and humidity ratio:
4
¼W,P
ð0:62198þPÞ
611,10Tþ7237:5T:3
(13)
Further details and a concise analysis of basic psychrometric calculations can be found in[31]and[32].
Since there is a local variation of the gas mixture quality i.e. due to humidity production, the values of mixture density, viscosity and specific heat appearing in eqs.(2), (4) and (7)are calculated based on the molecular weight and local humidity concentration. However, due to the short length of the computational domain, mass variations due to humidity production and oxygen consumption are neglected and therefore the equation of conti-nuity(2)is applied for the whole mixture without any sources or sinks.
3. Boundary and operating conditions
For the computational domain shown in Fig. 1b, the flow is always in thexdirection, the catalyst layer above the membrane is on theZ¼0 plane,Y¼0 and Y¼Ytotare symmetry planes and all
other outer surfaces are solid adiabatic walls. Several researchers report operating conditions for PEM fuel cells [5,33,34]. In this study, all calculations were performed assuming a constant and uniform inlet air distribution with values ranging betweenUo¼0.3
and 8.4 ms1. Constant pressure boundary conditions were attempted, in order to simulate fully developedflow, but stagnation regions on thefibres just in front of the inlet led to convergence difficulties and the approach was abandoned. Other simplifications have also been applied here, most notably the adiabatic tempera-ture boundary condition at the bipolar plateechannel interface.
Defining the temperaturefield at the cathode channel walls has been a matter of discussion for some time and a variety of numerical approaches have been applied[35], including constant temperature and constant heatflux conditions, which have been deemed inappropriate[36]. On the other hand, most experimental approaches strive to maintain a uniform temperature distribution, i.e. isothermal conditions throughout the cell[2,3,37]. Typically, the bipolar plates would include a cooling circuit but in order to accommodate this in the present approach, the cooling channels
would have to be included in the solid region of the plates and they would have to be solved using the conjugate heat transfer approach. Given the extensive computational demand of directly modelling the carbon cloth itself, this was prohibitive. Alterna-tively, prescribing a constant temperature or heatflux at the plates would significantly, and questionably, affect the area under the lands of the bipolar plates. In effect, the current approach neglects the effect of the bipolar plate on the temperaturefield (not theflow
field) in the channel and the GDL. This is a conservative assumption with regard to the scope of the study since lower temperatures of the plates would facilitate condensation.
With regard to the boundary condition for the energy equation at the catalyst layer, in reality heat is mainly generated due to thermodynamic irreversibilities. However, solving at the pore scale of the carbon cloth, local variations in these reactions should be taken into account and a variable heatflux would arise along the catalyst layer. Chemical reactions are not included in the present simulations and therefore a simplification of constant heatflux or constant temperature must be chosen. For the short channel length being simulated, a constant temperature boundary condition was considered sufficient for the present study.
Finally, another point worth mentioning in regard to theflow
field is the fact that when multiple neighbouring channels are considered i.e. as part of a serpentine, it has been documented that certainflow conditions may lead to a by-pass of the channel and mixing of theflows in neighbouring channels[41]. This is, of course, an undesirable condition and understanding of the phenomenon is of value in order to avoid it but for its inclusion in a simulation of channel flow, at least two channels must be included in the geometry. This increases computational effort and has not been included in the present study.
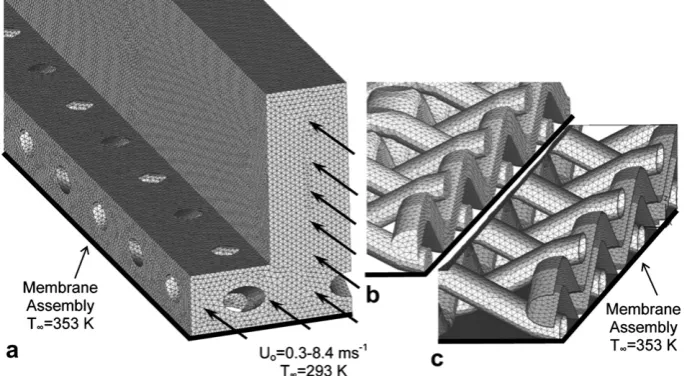
After the topology of the computational domain was con-structed, it was discretised with an unstructured mesh of 6.72∙105 tetrahedral volume elements (Fig. 5). Mesh quality was checked for excessive skewness and then three further grids consisting of 2.72∙105, 8.87∙105 and 1.28∙106 elements were constructed for grid independence confirmation. For the same entrance velocity (1.43 ms1), differences in calculated pressure drop per unit length were 1.77, 0.0, 0.08 and 1.02% in ascending order of the four grids’ densities respectively, thus indicating mesh independency of the solution.
[image:6.595.122.465.538.726.2]For heat transfer calculations, air inlet temperature was 293 K while the temperature at the catalyst layer was a constant 353 K. The inlet temperature is quite low for typical operating
temperatures of a PEM fuel cell membrane[13,23] but may be considered relevant to start up conditions, before normal operating temperatures are attained. Fibre temperature was either solved conjugately with the flow or assumed at the same constant temperature as the catalyst (T¼353 K). In conjugate heat transfer solutions, spatial discretisation extended within the solid fibres (Fig. 5c), where two individual sets of physical properties were assigned to the fibre material: pure carbon/graphite (k¼3 W m1K1,
r
¼1225 kg m3andCP¼700 J kg1K1) anda commercial ELATÒcloth (k¼0.27 W m1K1,
r
¼330 kg m3andCP¼610 J kg1K1). These are within the wide range of effective
thermal conductivities for typical carbon felts as documented by Ramousse et al.[38]. The thermal conductivity of graphite is much higher but the applied values are in accordance with the previously mentioned simplification that the fibres in the present model actually represent a composition of smallerfibres and therefore an effective thermal conductivity must be applied. The difference in axial and radial thermal conductivity has not been taken into account for thefibres and the larger value is expected to be closer to the actualfibre thermal conductivity[38]. Finally, although gravi-tational effects are included in the calculations, their effect is minor since the density driven buoyancy effects were found negligible compared to convection.
The present calculations consider only heat andfluidflow for a very small portion of a typical cathode channel length. Water vapour production, gasflow rate and cell voltage and power are all related but since electrical phenomena are not included in the present calculation, momentum and mass transfer parameters were chosen so that they are in agreement with the relevant parameters of the whole fuel cell system. Therefore, with regard to water vapour production and transport, production per unit membrane area was assumed constant atm_w ¼4.66∙104
[kgH2Os1m2]. Indicatively, this corresponds to a PEM fuel cell
with 5 cm2membrane area, operating at a voltage ofVe¼0.65 V
and producing Pew1.6 W. These values are in agreement with an
available experimental configuration of a PEM fuel cell[39]and also the theoretical analysis for PEM FC water production m_H2O
[kgH2Os1], according to Larminie and Dick[40]:
_
mH2O ¼ 9:34,10
8Pe
Ve (14)
Since the pore scale simulation does not permit solving for the whole serpentine channel, a choice had to be made with regard to the values of relative humidity at the entrance of the computational domain. Larminie and Dick[40]state that the produced fuel cell power can be ideally expressed as :
Pc ¼ Vc,4,F,MO2,m_O2 (15)
whereF¼96485.34 [Cmol1] is Faraday’s constant and MO2is the
molecular weight of Oxygen. Taking the molecular weight of air MB¼28.97 with 21% oxygen concentration by volume, the stoi-chiometric air requirementm_air;stoich[kgairs1] becomes:
_
mair;stoich ¼ 3:57,107
Pe
Ve (16)
and an air ratio can be defined as
l
¼m_air=m_air;stoich. For the presentchannel geometry and a 5 cm2fuel cell operating at atmospheric pressure with inlet velocities Uo ¼ 0.3e8.4 ms1, the air ratio
is
l
z 0.3e10. It is reiterated that the purpose of the previous [image:7.595.318.553.66.699.2]analysis is to put the present calculations of a small portion of the cathode channel length into perspective with regard to the fuel cell to which it belongs. The lowest velocity value, which gives an air-fuel ratio of
l
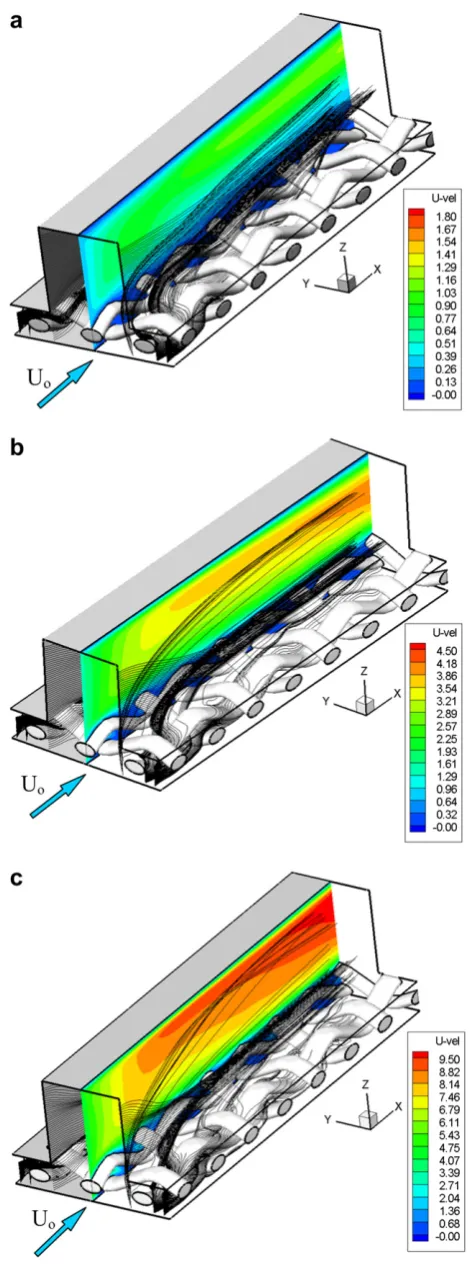
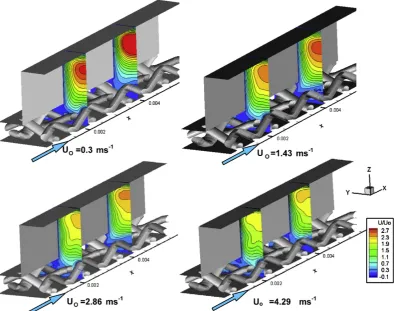
¼0.3 for the 5 cm2fuel cell, is not realistic since it would lead to cathode starvation. However, for a smaller fuel cellFig. 6.Velocity distribution contours and streamlines inside the GDL and cloth computational domain for the cases of a) Uo¼ 0.3 ms1, b) Uo¼ 1.43 ms1c)
with a shorter channel length, it would correspond to an air-fuel ratio above unity and so results will be presented for the U ¼
0.3 ms1value, mostly for comparison purposes and to underline the effect of theflow velocity and momentum.
In agreement with the above mentioned values for air-fuel ratio and a typical total length of the cathode channel, the computational domain corresponds to a downstream portion of the cathode channel, where relative humidity levels have already risen to near saturation and are taken to be between 99 and 99.6%. Of course neither humidity nor velocity distributions will actually be uniform but, as will be shown in the results of the calculations, they do develop within a relatively short distance from the inlet so that reliable conclusions may be drawn.
4. Results
Initially, parametric studies were performed at isothermal conditions for a range of inlet velocities between 0.3 and 8.4 ms1, corresponding to laminarflow Reynolds numbers ReDh¼14e400.
Since gravitational effects are negligible, the conclusions with regard to theflowfield will not be influenced by the subsequent introduction of a temperature difference.
The non-dimensional pressure drop through the channel, expressed as the friction coefficientf ¼Dh
D
P=0:5r
LU2 , is higherby a factor of two compared to the well knownf¼64/Relaw for laminar ductflow for all inflow velocity values except the lowest, which is in perfect agreement [28]. This is expected since the laminar ductflow law corresponds to the same channel confi gu-ration without the carbon cloth, whose presence obviously intro-duces an extra pressure drop and even more so at higher velocity values. Rawool et al.[41]made similar observations with porous
transport layers of low permeability leading to higher pressure drop. A closer look at Figs. 6e8 supports this explanation. The
higher inlet velocities force the flow through the carbon cloth where pressure drop is highest. Theflow pathlines inFig. 6clearly show that for the lowest velocity value theflow quickly leaves the clothfibre matrix and enters the channel while at higher velocities this is not as prominent. Contours of iso-velocity at two down-stream planes perpendicular to the mainflow direction are shown inFig. 7. Velocity is presented in non-dimensional form to aid in the comparison and it is clear that higher velocities lead to a more uniformflow, possibly because the pressure drop in the channel becomes comparable to that of the lower velocities in the cloth. Velocity profiles taken at a position in between the planes ofFig. 7
are presented inFig. 8where it is obvious that the non-dimensional velocity profile within the cloth becomes self similar and fully developed at a much lower velocity than the channelflow. These results are in agreement with those of Grujicic and Chittajallu[8]
who found that increased oxygen transport to the catalyst/ cathode interface and reduction of the thickness of the boundary layer are prerequisites for optimum PEM cathode geometry and may help to minimiseflooding. It is shown here (Figs. 6e8) that
higher inflow velocities will facilitate this and should further help with the removal of the water vapour that is produced.
The effect of temperature on fuel cell operation has been documented in the past for a large range of operating temperatures (303e353 K)[42]. Here, taking advantage of thefibre-scale
simu-lation, the investigated parameters have been extended towards the effect of the clothfibres’material properties. Although calcu-lations have been performed for common inlet temperatures of
[image:8.595.96.491.412.723.2]T¼353 K andT¼333 K[43], heat transfer results are presented for inlet temperatures equal to ambient (T¼293 K) - a situation that
will only arise during the transient start up periodein order to
underline the effect. The base case has been that thefibres assume the same temperature as the catalyst (T¼353 K) but conjugate solutions of the temperaturefield in theflow and in the solidfibres have also been performed for two differentfibre materials.
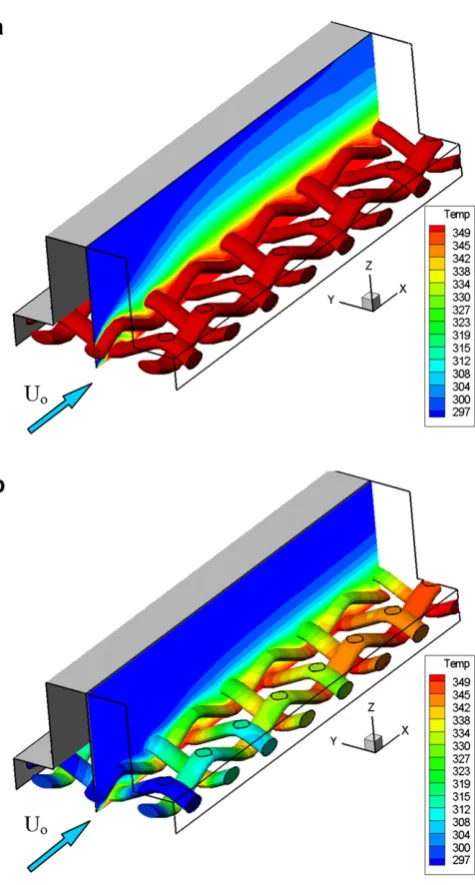
The temperaturefield on the surface of thefibres and a plane midway along the channel (Y/Ytot) is portrayed inFig. 9.Fig. 9a
shows the case when thefibre temperature is imposed equal to that of the catalyst (T¼353 K) andFig. 9b shows the same regions when the temperaturefield in the solidfibres is solved for ELAT material properties. The result shows much lower temperatures within the region of the GDL although the effect does not manage to reach the upper part of the channel in the length of the computational domain. However, thefibre temperatures seem to increase down-stream so that, given a long enough channel, a situation resembling that inFig. 9a may eventually be attained. In any case, the effect of the fibre material properties is evident within this developing region. This is better quantified in Fig. 10 where the mean air outflow temperature is presented for three configurations and a range of inlet air velocity values. The three configurations are: i) constantfibre temperature assumption (T¼353 K), ii) conjugate temperature solution throughfibre material assuming ELAT carbon cloth properties and iii) conjugate temperature solution through
fibre material assuming pure carbon (graphite) properties. It is obvious that the conjugate solutions result in consistently lower outflow temperatures compared to the assumption of constant
fibre temperature. Specifically, the commercial cloth properties (ELAT) lead to lower outflow temperature and are more sensitive to convective effects i.e. higher inlet velocities lead to larger temper-ature variations. In all cases however, an asymptotic state appears for high velocities, where convection can be considered dominant. In Fig. 11, the mean temperature on a plane parallel to the membraneeseparating the GDL from the channelehas been
calculated for the two differentfibre properties and a range of inlet velocities to give the temperature differences between the catalyst
X/Xtot=0.6
Y/Ytot=0.25
0
0.1
0.2
0.3
0.4
0.5
0.6
0.7
0.8
0.9
1
0.0
1.0
2.0
3.0
U/U
oZ/
Z
o
Uo=0.3 ms
Uo=1.43 ms
Uo=2.86 ms
Uo=3.0 ms
Uo=4.29 ms
Uo=8.4 ms -1
-1
-1
-1
-1
-1
[image:9.595.320.558.57.500.2]GDL
Fig. 8.Dimensionless velocity profiles at the channel mid-section (Y/Ytot ¼0.25) through the GDL and the height of the channel for various entrance velocities. The GDL thickness from Z/Ztot¼0 to Z/Ztot¼0.27 is marked on thefigure for clarity.
Fig. 9.Contours of constant temperature on thefibres and an XZ plane at Y/Ytot¼0.25 forUo¼8.4 ms1. a) Constant temperature imposed atfibres’surface, b) Conjugate temperature solution through the solidfibres with the properties of carbon cloth (ELAT). (Domain has been mirrored across XZ plane and the bipolar plate walls removed, for clarity).
295 300 305 310 315 320 325
0 50 100 150 200 250 300 350 400 450
ReDh
T / K
Tair outflow (T fiber constant)
Tair outflow (T fiber variable-carbon cloth properties)
[image:9.595.83.259.65.321.2]Tair outflow (T fiber variable-pure carbon properties)
[image:9.595.317.559.578.711.2]and the top of the GDL. Here, mean temperatures were calculated for both thefibre material in the plane as well as the whole plane (fibresþair). From the present results in the region whereflow is developing, temperature variation within the GDL seems to reach values >10e12 K while Khandelwal and Mench [10] expect
temperature variations of 7e8 K in diffusion media of the present
thickness. This may be explained by the fact that much larger lengths were examined there and is in agreement with Fig. 9, where the temperature differences in the cloth are smaller as the
flow progresses downstream.
Based on psychrometric processes[31] and for the calculated mean flow temperature at atmospheric pressure, the humidity concentration values at which 100% relative humidity (i.e. potential condensation) is attained are plotted inFig. 12for a range of inlet velocities and the three fibre conditions (constant temperature, ELAT and carbon properties). The resulting difference of over 30% in the“condensing”humidity ratio for differentfibre properties and the same flow velocity underlines the importance of the heat transfer mechanisms in the GDL.
[image:10.595.37.282.60.213.2]During operation of a PEM fuel cell, the reaction taking place at the catalyst is assumed to produce water vapour and not liquid
[40,44,35]. Following the numerical simulation of heat andfluid
flow in the GDL, the final effort of this work focused on water vapour production, vapour mass transport and psychrometric interaction with the temperature field in an attempt to obtain indications of potential water vapour condensation. A range of inlet air velocities (0.3e4.3 ms1), temperatures (293e353 K) and
rela-tive humidity (40e99.6%) values were applied while the two sets of 0
2 4 6 8 10 12 14
0 1 2 3 4 5 6 7 8 9
U / ms-1
ΔT
/
K
[image:10.595.305.548.81.673.2]Tin=293K,cloth & air, ELAT properties Tin=293K,fibers only, ELAT properties Tin=293K,cloth & air, pure carbon properties Tin=293K,fibers only, pure carbon properties
Fig. 11.Mean temperature values between PEM catalyst layer (DT ¼ TCateTLocal,
TCat¼353 K) and the top of the GDL for thefibres and the mean plane temperature (fibre and air).
0 0.01 0.02 0.03 0.04 0.05 0.06 0.07 0.08
0 50 100 150 200 250 300 350 400 450
ReDh
W /
kg
H2
O
kg
dry
a
ir
-1
Wsaturation-(T fiber constant)
Wsaturation-(T fiber variable-carbon cloth properties)
Wsaturation-(T fiber variable-pure carbon properties)
[image:10.595.39.279.589.719.2]Fig. 12.Humidity ratio leading to condensation for each outflow temperature of Fig. 10.
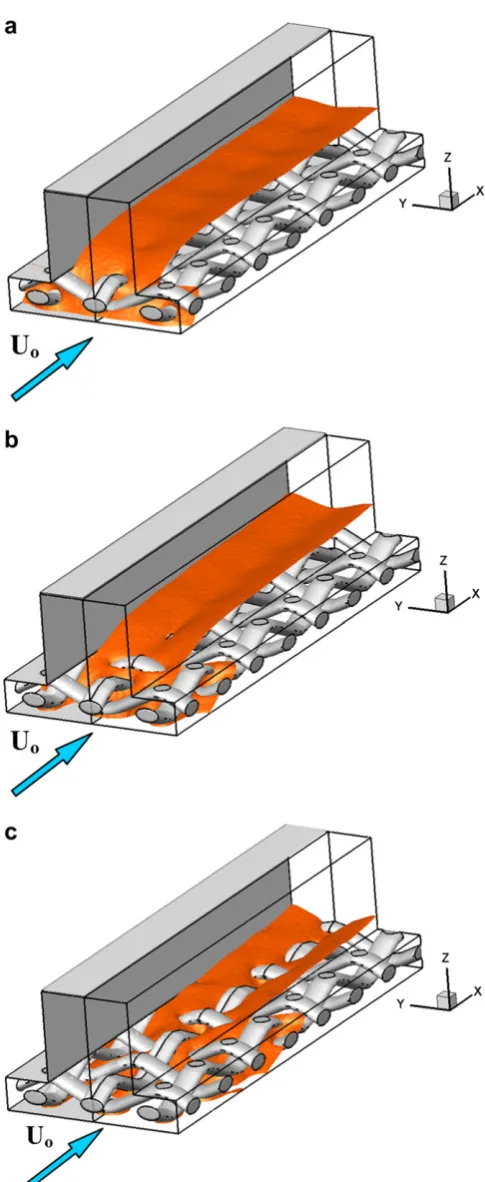
Fig. 13.Constant relative humidity condensation (4 ¼ 100%) iso-surfaces for
4in¼99.6%,Tin¼Tmembrane¼353 K, and a)Uo¼0.3 ms1, b)Uo¼1.43 ms1and c)
properties (graphite and ELAT) were also considered for thefibres. Humidity production and temperature at the catalyst layer was assumed to be constant for all cases. As previously stated, the set inlet parameters may be thought of as representative of a down-stream position in the fuel cell’s serpentine channel.Fig. 13 pres-ents iso-surfaces of 100% relative humidity (condensation front) below which condensation is predicted to have occurred. Phase change is not considered here so the condensation front is indica-tive of the region where condensation will form. The effect of liquid water on the flow cannot be predicted within the scope of this investigation. It is obvious however that higher inlet velocities will delay condensation since the inlet airflow penetrates the cloth and it takes longer for the locally produced water vapour at the catalyst layer to provide the extra humidity needed for saturation of the incoming air. Temperature has no effect here since the inlet air is assumed to be at the catalyst temperature. When lower inlet temperatures where examined, representative condensation situ-ations could not be attained since the higher catalyst layer temperature heated the air giving lower relative humidity values for the same humidity ratio. However, it is obvious from Fig. 13
[image:11.595.49.290.73.679.2]that higher inlet velocities help in removing water vapour from the GDL and therefore delay the development of condensation conditions.
Fig. 14a and b show a comparison of constant humidity ratio contours for
4
in¼99.6% and 97% respectively (Uo¼1.43 ms1). Atthe lower inlet humidity value, condensation does not appear but the maximum values are indicative precursors. A clearer view is presented with iso-surfaces inFig. 14c. Results show that the areas most favourable for condensation are in the constriction under the bipolar plate and between fibres and the membrane. These are actually regions that are farthest from the influence of the chan-nelein the Y directioneand far enough downstream for water
vapour to build up.
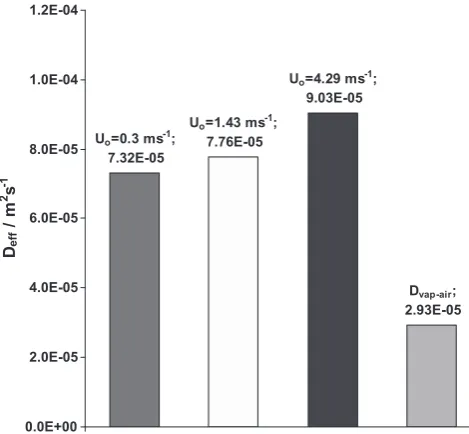
[image:11.595.317.552.502.719.2]Velocity effects can be quantified using the effective diffusion coefficient[12]. Due to the presence of the carbon cloth as well as the convective effects of theflow through the channel, this does not represent diffusion alone but can be used to compare the effective transport of water vapour compared to pure diffusion. The effective diffusion coefficient is defined as[12]:
Fig. 14.a) Constant relative humidity contours on planes parallel to the mainflow direction forUo¼1.43 ms1,Tin¼Tmembrane¼353 K and4in¼99.6%, b) Constant relative humidity contours on planes parallel to the main flow direction for
Uo¼1.43 ms1,Tin¼Tmembrane¼353 K and4in¼97% and c) Iso-surfaces of maximum local relative humidity values - precursors of first condensation spots for
Uo¼1.43 ms1,Tin¼Tmembrane¼353 K and4in¼97%.
Uo=0.3 ms-1; 7.32E-05
Uo=1.43 ms-1; 7.76E-05
Uo=4.29 ms-1; 9.03E-05
Dvap-air; 2.93E-05
0.0E+00 2.0E-05 4.0E-05 6.0E-05 8.0E-05 1.0E-04 1.2E-04
Def
f
/ m
2 s
-1
Deffvap ¼
1 Zth
_
mH2O=Acell
n
r
mixW
1þW
GDL
r
mixW
1þW
memb
o (17)
where (
r
mix) is the density of humid air, W is the humidity ratio, _mH2O is the water production at the membrane and Acell is the
membrane area in the computational domain. The denominator is actually the water vapour concentration gradient calculated from the mean concentration values at the membrane plane and the plane that defines the top of the cloth. Since water production is an imposed boundary condition in this work, the effective diffusion coefficient is actually solely dependent on the concentration gradient but it is interesting to compare it to the value of Dair-vap¼2.93∙105 m2 s1 given by Quick et al. [12] for water
vapour in air at 60C. Results are presented inFig. 15for various inlet velocities and at inlet temperatures equal to that of the cata-lyst, in order to include only the effects of the water production on the concentration gradient. Even at the lowest velocity values, vapour transport is increased compared to pure diffusion and as velocities increase, convective effects dominate and the effective diffusion coefficient increases significantly.
5. Conclusions
A 3D model simulating the pore scale topology of PEM cathode channel and GDL, including the carbon cloth structure has been presented. Heat and mass transfer have been solved for a range of inlet velocities as well as different clothfibre material properties, using a conjugate heat transfer approach. Water vapour production at the catalyst layer is included in the calculations and its transport through the GDL is combined with psychrometric calculations to provide indications of the conditions and areas most prone to condensation i.e. where liquid formation originates.
In its present state, the numerical model is not in a position to provide for simulations of a PEM fuel cell’s performance; indeed, there are a number of physical mechanisms missing: anode geometry, membrane, bipolar plates and cooling system, larger serpentine channel geometry, electrochemical phenomena etc. The study is an attempt to look at the pore scale heat andfluidflow phenomena in the GDL, while taking into account the fact that it belongs to a larger system. However, the computational effort that has been put into the pore scale has necessarily put some limita-tions on the modelling effort e.g. inclusion of the bipolar plates would be relatively simple with conjugate heat transfer but it would greatly increase both memory and computing time requirements. Also, modelling for voltage-current production and chemical reactions for a larger portion of the fuel cell channels may be too demanding computationally.
However, the results from the heat and mass transfer simula-tion may provide important insight for use in simpler models of the whole system. It has been shown that the assumption of constant GDL temperature as well as the choice of GDL material properties has a significant effect on the prediction of condensation and/or hot spot formation. Furthermore, the details of the heat and
fluidflow interaction with local geometry, which determine where saturationfirst appears may aid in the channel geometry design procedure.
Acknowledgements
This research was funded under the operational program “Competitiveness” of the Greek Ministry of Development (Community Support Framework 2000e2006), as approved by the
General Secretariat for Research and Technology (PENED 2003, 03ED902) and by Fluid Research Co.
References
[1] T.A. Trabold, J.P. Owejan, D.L. Jacobson, M. Arif, P.R. Huffman, In-situ investi-gation of water transport in an operating PEM fuel cell using neutron radi-ography. Part 1dexperimental method and serpentineflowfield results, Int. J. Heat Mass Trans. 49 (2006) 4712e4720.
[2] J.P. Owejan, T.A. Trabold, D.L. Jacobson, D.R. Baker, D.S. Hussey, M. Arif, In-situ investigation of water transport in an operating PEM fuel cell using neutron radiography. Part 2dtransient water accumulation in an interdigitated cathodeflowfield, Int. J. Heat Mass Trans. 49 (2006) 4721e4731.
[3] J.P. Owejan, T.A. Trabold, D.L. Jacobson, M. Arif, S.G. Kandlikar, Effects of flowfield and diffusion layer properties on water accumulation in a PEM fuel cell, Int. J. Hydrogen. Energy. 32 (2007) 4489e4502.
[4] M. Grujicic, K.M. Chittajallu, Optimization of the cathode geometry in polymer electrolyte membrane (PEM) fuel cells, Chem. Eng. Sci. 59 (2004) 5883e5895. [5] P. Quan, M.C. Lai, Numerical study of water management in the airflow channel of a PEM fuel cell cathode, J. Power Sources 164 (2007) 222e237. [6] P.M. Kumar, A.K. Kolar, Effect of cathode channel dimensions on the
perfor-mance of an air-breathing PEM fuel cell, Int. J. Thermal Sci. 49 (2010) 844e857. [7] A. Su, F.B. Weng, C.Y. Hsu, Y.M. Chen, Studies onflooding in PEM fuel cell
cathode channels, Int. J. Hydrogen. Energy. 31 (2006) 1031e1039. [8] P.T. Nguyen, T. Berning, N. Djilali, Computational model of a PEM fuel cell with
serpentine gasflow channels, J. Power Sources 130 (2004) 149e157. [9] Y. Zong, B. Zhou, A. Sobiesiak, Water and thermal management in a single PEM
fuel cell with non-uniform stack temperature, J. Power Sources 161 (2006) 143e159.
[10] M. Khandelwal, M.M. Mench, Direct measurement of through-plane thermal conductivity and contact resistance in fuel cell materials, J. Power Sources 161 (2006) 1106e1115.
[11] J.H. Nam, K.J. Lee, G.S. Hwang, C.J. Kim, M. Kaviany, Microporous layer for water morphology control in PEMFC, Int. J. Heat Mass Transfer 52 (2009) 2779e2791. [12] C. Quick, D. Ritzinger, W. Lehnert, C. Hartnig, Characterization of water transport in gas diffusion media, J. Power Sources 190 (1) (2009) 110e120. [13] N.P. Siegel, M.W. Ellis, D.J. Nelson, M.R. von Spakovsky, Single domain PEMFC
model based on agglomerate catalyst geometry, J. Power Sources 115 (2003) 81e89.
[14] A. Theodorakakos, T. Ous, M. Gavaises, J.M. Nouri, N. Nikolopoulos, H. Yanagihara, Dynamics of water droplets detached from porous surfaces of relevance to PEM fuel cells, Int. J. Colloids Interface Sci. 300 (2) (2006) 673e687. [15] T. Ous, C. Arcoumanis, Visualisation of water droplets during the operation of
PEM fuel cells, J. Power Sources 173 (1) (2007) 137e148.
[16] T. Ous, C. Arcoumanis, Visualisation of water accumulation in the flow channels of PEMFC under various operating conditions, J. Power Sources 187 (1) (2009) 182e189.
[17] S.Y. Yoon, J.W. Ross, M.M. Mench, K.V. Sharp, Gas-phase particle image velocimetry (PIV) for application to the design of fuel cell reactant flow channels, J. Power Sources 160 (2) (2006) 1017e1025.
[18] P.P. Mukherjee, C.Y. Wang, Stochastic microstructure reconstruction and direct numerical simulation of the PEFC catalyst layer, J. Electrochem. Soc. 153 (2006) A840eA849.
[19] B.V. Kasula, L. Mercado, P. Asinari, M.R. von Spakovsky, 3D microstructure reconstructions of solid oxide and proton exchange membrane fuel cell electrodes with applications to numerical simulations of reacting mixture flows using LBM, in, Proc. ASME Int. Mech. Eng. Congress Exposition 6 (2008) 643e654.
[20] G. Inoue, T. Yoshimoto, Y. Matsukuma, M. Minemoto, Development of simu-lated gas diffusion layer of polymer electrolyte fuel cells and evaluation of its structure, J. Power Sources 175 (2008) 145e158.
[21] J.W. Park, K. Jiao, X. Li, Numerical investigations on liquid water removal from the porous gas diffusion layer by reactantflow, Appl. Energy Press. (2010). doi:10.1016/j.apenergy.2009.11.021.
[22] Kopanidis A., Theodorakakos A., Gavaises E., Bouris D., Direct Modelling of the Microscale Flow through a PEM Fuel Cell GDL and Channel, in: S. Colin, G.L. Morini, Proceedings of the first European Conference on Microfluidics, Bologna, Italy, (2008),mFlu’08e180.
[23] Siegel N.P., Development and validation of a computational model for a proton exchange membrane fuel cell, PhD thesis (2003) Virginia Polytechnic Institute and State University.
[24] J.P. Feser, A.K. Prasad, S.G. Advani, Experimental characterization of in-plane permeability of gas diffusion layers, J. Power Sources 162 (2006) 1226e1231. [25] I. Verpoest, S.V. Lomov, Virtual textile composites software Wisetex: inte-gration with micro-mechanical, permeability and structural analysis, Comp. Sci. Technol. 65 (15e16) (2005) 2563e2574.
[26] R. Roshandel, B. Farhanieh, E. Saievar-Iranizad, The effects of porosity distri-bution variation on PEM fuel cell performance, Renewable Energy 30 (2005) 1557e1572.
[27] S.V. Patankar, B.D. Spalding, A calculation procedure for heat, mass and momentum transfer in three-dimensional parabolicflows, Int. J. Heat Mass Transfer 15 (1972) 1787e1806.
[28] A. Kopanidis, A. Theodorakakos, E. Gavaises, D. Bouris, 3D numerical simula-tion of flow and conjugate heat transfer through a pore scale model of open cell metal foam, Int. J. Heat Mass Transfer 53 (11-12) (2010) 2539e2550. [29] D. Bolton, The Computation of equivalent potential temperature, Monthly
[30] R.W. Hyland, A. Wexler, Formulations for the thermodynamic properties of the saturated phases of H2O from 173.15 K to 473.15 K, ASHRAE Transactions
89 (2A) (1983) 500e519.
[31] ASHRAE, Handbook, Fundamentals, SI Edition. Ashrae, 2009, ISBN 978-1-933742-55-7.
[32] Y.O. Devres, Psychrometric properties of humid air: calculation procedures, Appl. Energy 48 (1994) 1e18.
[33] P. Quan, B. Zhou, A. Sobiesiak, Z. Liu, Water behavior in serpentine micro-channel for proton exchange membrane fuel cell cathode, J. Power Sources 152 (2005) 131e145.
[34] M.H. Chang, F. Chen, H.S. Teng, Effects of two-phase transport in the cathode gas diffusion layer on the performance of a PEMFC, J. Power Sources 160 (2006) 268e276.
[35] S.G. Kandlikar, Z. Lu, Thermal management issues in a PEMFC stackeA brief review of current status, Appl. Thermal Eng. 29 (2009) 1276e1280. [36] J. Yuan, M. Rokni, B. Sunden, A numerical investigation of gasflow and heat
transfer in proton exchange membrane fuel cells, Numer. Heat Transfer Part A 44 (2003) 255e280.
[37] I.S. Hussaini, C.Y. Wang, Visualization and quantification of cathode channel flooding in PEM fuel cells, J. Power Sources 187 (2009) 444e451.
[38] J. Ramousse, S. Didierjean, O. Lottin, D. Maillet, Estimation of the effective thermal conductivity of carbon felts used as PEMFC Gas Diffusion Layers, Int. J. Thermal Sci. 47 (2008) 1e6.
[39] E. Kikkinides, D. Bouris, D. Tsiplakides, G. Marnellos, E. Smotkin, Under-standing Microscale Mechanisms in the Cathode Gas Diffusion Layer Of Proton Exchange Membrane Fuel Cells (2006e2008). General Secreteriat for Research and Technology, Ministry of Development, 2008, GreeceeUSA Collabo-rationeFinal Report.
[40] J. Larminie, A. Dick, Fuel Cell Systems Explained. Wiley, 2003, ISBN 0470 84857X. [41] A.S. Rawool, S.K. Mitra, J.G. Pharoah, An investigation of convective transport in micro proton-exchange membrane fuel cells, J. Power Sources 162 (2006) 985e991.
[42] M. Coppo, N.P. Siegel, M.R. von Spakovsky, On the influence of temperature on PEM fuel cell operation, J. Power Sources 159 (2006) 560e569.
[43] P.C. Sui, S. Kumar, N. Djilali, Advanced computational tools for PEM fuel cell design Part 2. Detailed experimental validation and parametric study, J. Power Sources 180 (2008) 423e432.