Abstract: Multiple medical images of different modalities are fused together to generate a new more informative image thereby reducing the treatment planning time of medical practitioners. In recent years, wavelets and deep learning methods have been widely used in various image processing applications. In this study, we present convolutional neural network and wavelet based fusion of MR and CT images of lumber spine to generate a single image which comprises all the important features of MR and CT images. Both CT and MR images are first decomposed into detail and approximate coefficients using wavelets. Then the corresponding detail and approximate coefficients are fused using convolutional neural network framework. Inverse wavelet transform is then used to generate fused image. The experimental results indicate that the proposed approach achieves good performance as compared to conventional methods.
Index Terms: Medical image fusion, Multi-modal image fusion, Wavelets, Deep Leaning, Convolutional Neural Network.
I. INTRODUCTION
Spine is one of the most essential parts of human body. Because of spine we can bend and move freely. It is divided into different parts: cervical, thoracic, lumber and sacroiliac and coccyx. Many people today suffer from lower back pain. This pain is associated with lumber region of spine. The number of patients worldwide with lower back disease has increased by 54% from 1990 to 2015 [1]. Because of this, there has been tremendous increase in number of imaging scans of different modalities. Each modality offers its own advantages and disadvantages. Computed Tomography (CT) scan is used to view bony structures like vertebras of spine. Magnetic resonance (MR) scan is used to view details related to soft tissues. In most of the cases doctors suggest both CT and MR scans to check the structure and shape of lumbar spine. Then based on the scans they decide further treatment on the spine.
In recent times many researchers have come up with different algorithms to fuse multi modal medical images. Fusion algorithms basically fall into three categories: – pixel level fusion, feature level and decision level fusion. In pixel level fusion, original pixels intensities of the source images are fused. In feature level fusion, different objects are fused based on their extracted features. Decision level fusion uses results of multiples algorithms followed by a decision rule to fuse the results. The decision rule could be a statistical method or voting based method or simply a fuzzy logic based
Revised Manuscript Received on July 05, 2019.
Bhakti Palkar, Department of Computer Engineering, MPSTME, NMIMS,Mumbai, India.
Dhirendra Mishra, Department of Computer Engineering, MPSTME, NMIMS, Mumbai, India.
method. Among all the three types, pixel level fusion methods are simple, efficient and they preserve the information content in original images more accurately. Existing pixel level image fusion methods can be divided into three major types: 1) spatial domain techniques, 2) multi-scale decomposition based techniques, 3) sparse representation based techniques
Spatial domain techniques which work on the original pixel intensities of images suffer from low contrast or colour distortion [2].The most commonly used multi-scale decomposition based techniques are divided into two types: 1) pyramid based fusion and 2) wavelet transform based fusion. Since the input images are different from each other in various aspects such as content, size, shape and noise, these factors greatly affect the performance of pyramid based fusion methods [2]. For brain diagnosis morphological pyramid filtering method has been used [3]. Discrete Cosine Transform can be used in conjunction with Laplacian pyramid to fuse CT and MR images of human brain [7]. It removes the ‘patchy effect’ drawback of pyramid based fusion.
DiscreteWavelet Transform (DWT) based fusion techniques have been used to fuse multi-modal medical images [4]. DWT
based fusion methods give directional information which is not provided by spatial domain and pyramid based fusion methods. Fused images generated by DWT don’t show patchy effect and theyhave good signal to noise ratio.On the other hand DWT also has some disadvantages like shift variance and lack of phase information which is turn results into inconsistent reconstruction of original image. Dual Tree Complex Wavelet Transform (DT-CWT) which is a variant of DWT offers shift invariance and phase information. It has been used successfully for medical image fusion [5]. Stationary wavelet transform (SWT)is another modified DWT where the ‘shift-invariance’ drawback is removed by completely eliminating the down samplingand up sampling in DWT [6]. Lifting wavelet transform (LWT), a variant of DWT, reduces computation time and memory requirement greatly. LWT has been used to fuse multi modal images of brain [8].However, all these variants of DWT cannot extract curves and edges of images clearly.Sparse representation based image fusion methods, have been used to fuse multi-modal medical images [9]. With the rapid development in the field of image processing, many people have used deep features of multi-modal images as saliency features to generate fused image. Convolutional sparse representation (CSR) [10] and convolutional neural network(CNN) [11] [12]based methods are used
to fuse multi focus and
multi-modal images.
However, these methods use
Fusion of Multi Modal Lumber Spine Scans
Using Wavelet and Convolutional Neural
Network
the results obtained by last layer and all the important information obtained by middle layers is not considered in deciding final fusion. It is also yet not clear how much deep a network should go. If the network is very deep, it may end up losing all important information.
In this paper, a hybrid method based on wavelet and deep learning is used to fuse CT and MR images of lumber spine. The source images are decomposed into detailcontent and approximate coefficients by using wavelet. Then VGG-19 deep learning network is used to fuse corresponding parts of the two images. The final fused image is generated by the applying inverse wavelet transform. We have used dataset1 of SpineWeb [16] which has CT and MR scans of lumber spine. This paper is organized as follows: Section two focuses on discrete wavelet transform. Section three is for VGG-19 network. Section four talks about the proposed fusion method.Section five shows results and experiments. Conclusion is presented in section six.
II. DISCRETE WAVELET TRANSFORM
Using wavelet transform any waveform or signal in time domain can be converted into a series of coefficients based on small finite waves called wavelets.
A. 1D Discrete Wavelet Transform
FigureII.1:1D-Discrete Wavelet Transform
Given a signal s of length N, the Discrete Wavelet Transform (DWT) can be computed in at most log2N stages. Original 1D signal (let this be cAj) is convolved with low pass filter followed by down sampling by 2 to generate approximate coefficients cAj+1. It is also convolved with high pass filter followed by down sampling by 2 to generate detail coefficients cDj+1 as shown in Fig.1. This process can be applied recursively on approximation coefficients generated in previous level to generate approximation and detail coefficients at next levels.
[image:2.595.51.285.586.716.2]B. 2D Discrete Wavelet Transform
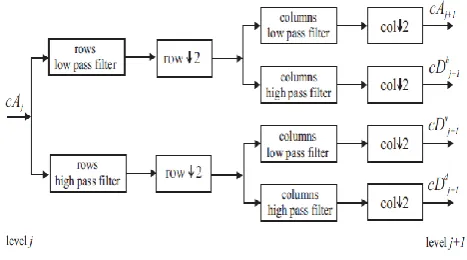
Figure 2: 2D-Discrete Wavelet Transform
2D-DWT is being used efficiently for image processing and computer vision applications. Steps for 2D-DFT are as follows:
Step 1: Apply 1D-DWT on rows to generate approximation coefficients and detail coefficients.
Step 2: Apply 1D-DWT on columns of approximation coefficients obtained in step 1. This generates approximation coefficients cAj+1 (LL) and detail coefficients with horizontal orientation cDhj+1 , (LH).
Step 3: Apply 1D-DWT on columns of detail coefficients obtained in step 1. This generates detail coefficients with vertical orientation cDvj+1 , (LV) and detail coefficients with
diagonal orientation cDdj+1 , (LD) as shown in Fig. 2.
This completes only one level of decomposition which extracts only highest frequencies. To extract lower frequencies this process can be applied repeatedly on LL band generated in previous level.Like 1D inverse wavelet transform, 2D inverse wave transform is obtained by applying the decomposition step in reverse.
III. VISUAL GEOMETRY GROUP (VGG)-19 Image
Size: 224×224 Conv1_1, Depth-64 Conv1_2, Depth-64
Max-Pool Size: 112×112 Conv2_1, Depth-128
Conv2_2, Depth-128 Max-Pool Size: 56×56 Conv3_1, Depth-256
Conv3_2, Depth-256 Conv3_3, Depth-256 Conv3_4, Depth-256
Max-Pool Size: 28×28 Conv4_1, Depth-512
Conv4_2, Depth-512 Conv4_3, Depth-512 Conv4_4, Depth-512
Max-Pool Size: 14×14 Conv5_1, Depth-512
Conv5_2, Depth-512 Conv5_3, Depth-512 Conv5_4, Depth-512
Max-Pool
Size: 7×7 FC-4098
FC-4098 FC-4098 Figure 3: VGG-19 Network
The VGG-19 is 19 layer deep convolutional neural network that is trained on more than a million images from the ImageNetdatabase [13][14]. It can classify images into 1000 object categories. As a result, the network has learned rich feature representations for a wide range of images. Two important characteristics of VGG-19 are ‘simple’ and ‘deep’. The VGG-19 has fairly straightforward architecture. The network has an image input size of 224×224. The image is passed through a stack of convolutional layers, where 3 × 3 filters are used. All convolutional layers are equipped with the rectification (ReLU) non-linearity. Spatial pooling is carried out after five convolutional layers by max-pooling layers over a 2×2 pixel window, with stride 2. The stack of convolutional layers is followed by three Fully-Connected (FC) layers: the first two
have 4096 channels each, the
third performs 1000
contains 1000 channels (one for each class).
IV. PROPOSED FUSION METHOD
This section discusses how to fuse CT and MR images of lumber spine using wavelets and VGG-19 convolutional neural network. We have used wavelets to decompose MR and CT scans into approximation and detail coefficients separately. Then VGG-19 network based fusion method is used to fuse corresponding coefficients of the two input images. Finally inverse wavelet transform is used to obtain fused image.
A. Fusion Algorithm
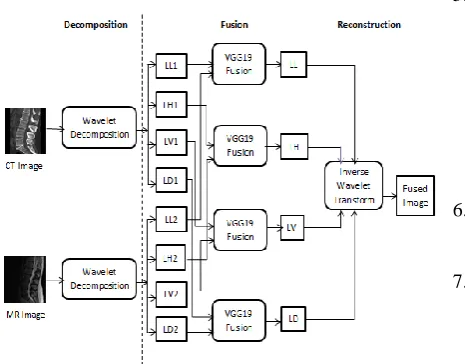
[image:3.595.60.293.239.421.2]Fig. 4 demonstrates the overall fusion method. It is summarized as below:
Figure 4: Medical image fusion using wavelets and VGG-19 network
Step1: Apply wavelet decomposition on CT image to generate approximate coefficient LL1 and three detail coefficients: LH1(horizontal) ,LV1 (vertical) ,LD1(diagonal) Step2: Apply wavelet decomposition on MR image to generate approximate coefficient LL2 and three detail coefficients: LH2(horizontal) ,LV2 (vertical) ,LD2(diagonal) Step3: Apply fusion based on VGG-19 network on four pairs: (LL1 and LL2), (LH1 and LH2), (LV1 and LV2) and (LD1 and LD2), to generate LL band, LH band, LV band and LD band.
Step4: Apply inverse wavelet transform on the four bands generated in step 3 to obtain fused image.
B. VGG-19 Fusion
We have used VGG-19 convolutional neural network to extract deep features. This section
describes the fusion strategy designed using pre-trained VGG-19 model. The algorithm for VGG-19 fusion is as follows:
Input:Source images Ikwhere k={1,2}.
Output: Fused coefficients Steps:
1.For each image Ik,, generate
feature maps where ‘i’ is
layer number and ‘m’ is the channel number of the ithlayer
where k={1,2} and i={1,2,3,4}, .
2.Calculate initial activity level map L1-norm as shown in equation 1:
(1)
3. Calculate final activity level map using block based average operator as shown in equation 2:
(2)
where r is 1.
4. Calculate initial weight map using soft-max operator as shown in equation 3:
(3)
5. Calculate modified weight map as shown in equation 4.by applying up-sampling operator to resize the weight map to that of the size of input image.
(4)
This generates four pairs of weight maps
6. For each pair calculate the initial fused coefficients using equation 5.
(5)
7. Obtain final fused content using max operator
(6)
Once the fused coefficients are obtained for four pairs (one pair of approximation coefficients and three pairs of detail confidents) we use inverse wavelet transform on the four coefficients to obtain fused image.
V. RESULTS AND DISCUSSIONS
The aim of this section is to validate and compare the proposed method with conventional methods using quantitative and qualitative criteria.
A. Dataset
In our experiment the proposed fusion method is applied on T2 weighted MR images and CT images of ten patients suffering from various lumbar spine diseases. The MR and CT scans are taken from publically available dataset1 of SpineWeb [16]. All pairs of CT and MR images have been registered with each other using landmark based registration technique in MATLAB.
B. Fusion
a b c
Figure 4: Case 1 Registration process a) Fixed Image(MR)-landmark points selection b) Moving Image(CT)- landmark points selection
c) Registered CT
a b c
d e
Figure 5: Case 1- Fusion Results a)VGG-Fusion b) SWT
c) DCT-LP d) DWT e) DT-CWT
Fig. 4 shows original MR (a) and CT (b) images of case 1. User selects 11 matching control points from the two images, and then the geometrical transformations are inferred to register CT with MR image. Figure ‘c’ is the registered CT image. Once the registered CT image is obtained, fusion is performed on original MR(a) and registered CT (c) images. Fig. 5 shows the fused images obtained using different methods for case 1.
C. Quantitative assessment of fused images
Tables 1, 2, 3 and 4 show the quantitative assessment of fused images using four quality parameters: entropy, standard deviation, spatial frequency [2] and universal quality index[15] respectively. Entropy ( E) indicates the amount of information contained in the image. The higher value of entropy implies that the fused image has more information than any of the input images. Standard Deviation (SD) measures the contrast in the fused image. So it should be high. Image with high spatial frequency (SF) offers better quality. Universal image quality index (UQI) models any distortion in the image using three different factors: loss of correlation, luminance distortion and contrast distortion. The higher the UQI value better is the quality of the image. Colour codes are used to indicate the algorithm that has showed best value of the quality parameter. Table cells with dark red background shows the best value as opposed to light background which shows worst value.
As we can observe in table I that VGG-fusion method showed highest (best) value for 8 out of 10 patients. DT-CWT is another method which could show entropy values near to VGG-Fusion entropy values. SWT and DCT-LP fusion methods do not show good entropy values. DWT method is worst as it has shown lowest entropy values
for 9 out 10 cases which mean that DWT fused images do not carry much information. DT-CWT and VGG-Fused images are more informative than SWT and DCT-LP fused images.
Table -I: Quantitative Assessment-Entropy
Case VGG-
Fusion SWT DT-CWT DCT-LP DWT
1 7.8219 7.0563 7.3104 7.1009 7.0092 2 7.8225 7.7465 7.7801 7.7638 7.7436 3 7.6481 7.6188 7.6343 7.6439 7.6030 4 7.4500 7.2499 7.6075 7.2842 7.2244 5 7.6107 7.5319 7.8304 7.5496 7.5418 6 7.4312 7.0763 7.3688 7.0913 7.0741 7 7.7159 7.5529 7.4140 7.5725 7.5341 8 7.8027 7.2755 7.4366 7.2855 7.2870 9 7.8540 7.5770 7.7843 7.5991 7.5526 10 7.7437 7.3090 7.5206 7.3388 7.2759 Table II shows standard deviation values which should be high to indicate good contrast. DT-CWT has shown highest SD values for 9 out of 10 cases. VGG-Fusion method has shown SD values very near to DT-CWT values. DWT could show highest SD values for any of the cases which indicate that the fused images obtained using DWT are of low contrast. Contrast of DT-CWT and VGG-Fused images is better than SWT and DCT-LP.
Table -II: Quantitative Assessment-Standard Deviation
Case VGG-
Fused SWT DT-CWT DCT-LP DWT
1 62.8561 43.6251 56.4697 44.0244 42.9024 2 60.1074 56.6511 71.5696 57.1373 56.5296 3 57.0075 54.5636 70.6445 54.9777 54.2845 4 49.1442 43.2058 54.9181 43.7830 41.9642 5 48.8266 45.9384 64.5806 46.4274 46.2874 6 46.9885 36.0115 47.0770 36.2756 35.5292 7 71.2319 58.8815 72.4750 59.1172 59.0526 8 60.6287 42.3452 54.1153 42.3834 42.5562 9 59.2885 47.5669 62.0904 48.2776 46.8118 10 59.5328 50.4212 62.0333 50.5876 50.0371
Table III shows spatial frequency (SF) values which indicate quality of the fused image. Again we can observe that the quality of VGG-Fused images is remarkably better than the fused images obtained using other three methods. DWT has always shown least values of spatial frequency for all ten cases.
Table -IIIV: Quantitative Assessment-Spatial Frequency
Case VGG-
Fused SWT DT-CWT DCT-LP DWT
1 10.5606 7.8878 8.5463 8.8059 3.9119 2 13.6450 9.4554 9.8815 10.2033 6.7283 3 11.5609 9.0088 8.9245 9.7461 5.7287
4 9.8641 8.9289 7.5440 9.7604 4.7077
5 12.3010 9.5563 9.8970 10.3995 6.0516
6 7.5253 6.0957 5.6927 6.5617 3.3869
7 11.6245 6.0287 7.6433 6.6340 4.8485
8 9.7115 2.9435 4.8602 3.0977 2.8693
9 14.3514 11.1519 10.8626 12.3099 6.4893
10 9.9550 5.2405 5.8770 5.5487 3.5586
Table IV shows values of universal image quality index which is based on contrast, luminance and correlation. According to this parameter
quality. VGG-fused images show best quality fused images for 8 out of 10 cases.
Table -IVV: Quantitative Assessment-Universal Quality Index
Case VGG-
Fused SWT DT-CWT DCT-LP DWT
1 0.6900 0.5955 0.5523 0.5976 0.6388 2 0.7404 0.7152 0.6575 0.7152 0.6979 3 0.8045 0.7329 0.6959 0.7589 0.7585 4 0.7965 0.7823 0.7360 0.7822 0.7728 5 0.7865 0.7631 0.7173 0.7632 0.7569 6 0.8152 0.7988 0.7598 0.8010 0.7933 7 0.6610 0.5981 0.5385 0.6004 0.5964 8 0.6782 0.7505 0.7172 0.7685 0.7420 9 0.7600 0.7795 0.7468 0.7794 0.7725 10 0.6671 0.6533 0.6245 0.6538 0.6425
The MR and CT input images are completely different from each other because they show different details of human body. All four quality parameters: entropy, standard deviation, spatial frequency and universal image quality index help us in making the decision that fused image generated using VGG-Fusion method is of good quality. It integrates important features from both input images, shows good amount of information content and good contrast.
D. Qualitative analysis by orthopedic surgeon
Qualitative analysis is done by getting the source images and fused image verified and tested by renowned orthopedic surgeon. He has observed that all the images cover lumbar spine diseases such as degenerative disc disease, spinal stenosis, disc herniation, spondylolisthesis and bone Spurs (Osteophytes). Case wise details of the disease are as follows: 1) Case 1: Prolapse Disk, Disk thinning, Bulging Disk 2) Case2: Spondylolisthesis, Degenerative disk and osteophyte
3) Case3: Spinal stenosis, disk thinning, herniation, osteophyte formation
4) Case 4: Spondylolisthesis 5) Case 5: Disk Herniation
6) Case 6: Degenerative disk, Osteophyte 7) Case 7: Spinal stenosis, Disk Herniation 8) Case 8: Disk thinning, Disk Herniation 9) Case 9: Disk thinning, Disk Herniation 10) Case 10: Disk thinning, Disk Herniation
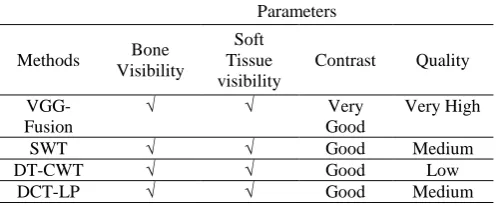
To assess quality of fused images,theorthopedic surgeon has used four parameters namely: bone visibility, soft tissue visibly, contrast and quality. Table no.5 shows the parameters used by the surgeon to assess quality of fused images. All the fused images show both bony and soft tissues which are otherwise visible only in one input image either CT or MR image. Fused images generated using VGG-Fusion are of very good quality and contrast as compared to other four methods. So, fused image which is generated using VGG-Fusion can be used for further treatment planning.
Table 5: Parameters for Qualitative Assessment
Parameters
Methods Bone Visibility
Soft Tissue visibility
Contrast Quality
VGG- Fusion
√ √ Very
Good
Very High
SWT √ √ Good Medium
DT-CWT √ √ Good Low
DCT-LP √ √ Good Medium
DWT √ √ Low Low
VI. CONCLUSION
In this paper, we present a very simple yet effective hybrid fusion method using wavelet and VGG-19 deep learning framework for MR and CT images of lumber spine. The source images –MR and registered CT are decomposed into approximation (LL) and detail (LH, LV, LD) coefficients separately using wavelets. Fusion based on VGG-19 is performed separately on the four pairs of coefficients (LL1, LL2), (LH1, LH2), (LV1, LV2) and (LD1, LD2). Finally, the fused image is reconstructed by applying inverse wavelet transform on the four coefficients generated by deep learning framework. We use both quantitative and qualitative methods to evaluate the proposed method. As per quantitative evaluation, fused images generated using DT-CWT and VGG-Fused are better than SWT, DWT and DCT-LP in terms of content and contrast. But the quality of VGG-Fusion method is remarkably better than other fused images. So, fused image which is generated using VGG-Fusion can be used for further treatment planning. The same approach can be tested on fusion of other human organs as well as other multiple modalities. VGG-Fusion can also be combined with other variants of wavelet transforms.
REFERENCES
1. Hartvigsen J. et al.,“ Low Back Pain Series: What Low Back Pain Is and Why We Need to Pay Attention.”, Lancet, June 2018; Volume 391, Issue 10137; p2356-2367.
2. Dhirendra Mishra and Bhakti Palkar, “Image Fusion Techniques: A Review”, International Journal of Computer Applications130(9):7-13, November 2015. Published by Foundation of Computer Science (FCS), NY, USA.
3. K. Mikoajczyk, J. Owczarczyk, W. Recko, “A test-bed for computer-assisted fusion of multi-modality medical images”, in: Computer Analysis of Images and Patterns, Springer, 1993, pp. 664–668.
4. Yong Yang, Dong Sun Park, and Shuying Huang, NiniRao, “Medical Image Fusion via an Effective Wavelet Based Approach”, published in EURASIP Journal on Advances in signal processing, Volume 2010, February 2010, Article No:44,Hindawi Publishing corp., New York, united states.
5. Tao J., Li S., Yang B. (2010) Multimodal Image Fusion Algorithm Using Dual-Tree Complex Wavelet Transform and Particle Swarm Optimization. In: Huang DS., McGinnity M., Heutte L., Zhang XP. (eds) Advanced Intelligent Computing Theories and Applications. ICIC 2010. Communications in Computer and Information Science, vol 93. Springer, Berlin, Heidelberg
6. R.Asokan1 , T.C.Kalaiselvi2 and M.Tamilarasi3 , “Medical Image Fusion Using Stationary Wavelet Transform With Different Wavelet Families”, Pak. J. Biotechnol. Vol. 13 (special issue on Innovations in information Embedded and Communication Systems) Pp. 10 - 14 (2016) 7. AkankshaSahu , Vikrant Bhateja , AbhinavKrishn , Himanshi ,“Medical Image Fusion with Laplacian Pyramids”, 2014 International Conference on Medical Imaging, m-Health and Emerging Communication Systems (MedCom) 2014.
8. Himanshi, Vikrant Bhateja, AbhinavKrishn and AkankshaSahu, “Medical Image Fusion in Curvelet Domain Employing PCA and Maximum Selection Rule”, Proceedings of the Second International Conference on Computer and Communication Technologies, Advances in Intelligent Systems and Computing 379, DOI 10.1007/978-81-322-2517-1_1, Springer, India 2016
[image:5.595.46.295.688.791.2]10. Liu Y, Chen X, Ward R K, et al. Image fusion with convolutional sparse representation. IEEE signal processing letters, 2016, 23(12): 1882-1886. 11. Liu Y, Chen X, Peng H, et al. Multi-focus image fusion with a deep convolutional neural network. Information Fusion, 2017, 36: 191-207. 12. Hui Li, Xiao-Jun Wu, Josef Kittler, “Infrared and Visible Image Fusion
using a Deep Learning Framework”, International Conference on Pattern Recognition 2018
13. ImageNet. http://www.image-net.org
14. Simonyan, Karen, and Andrew Zisserman. "Very deep convolutional networks for large-scale image recognition.",arXiv preprint arXiv:1409.1556 (2014).
15. Zhou Wang, Alan C. Bovik, “A Universal Image Quality Index”, IEEE Signal Processing Letters, vol. 9, no. 3, pp. 81-84, March 2002 16. Spineweb dataset http://spineweb.digitalimaginggroup.ca/
AUTHORSPROFILE
Mrs. Bhakti Palkar has received B.E (Computer science and engineering) in 2001, M.E (Computer) from Mumbai University in 2008. She has more than 16 years of experience in teaching. Currently working as associate professor in Department of Computer Engineering at K.J. Somaiya College of engineering, Mumbai. Her areas of interest are Image processing,, Database management systems, Compiler construction.
Dr.Dhirendra Mishrahas received his BE (Computer Engg) degree from University of Mumbai. He completed his M.E. (Computer Engg) from ThadomalshahaniEngg. College, Mumbai, University of Mumbai. He received PhD from NMIMS university. He currently works as Professor in Computer Engineering department of Mukesh Patel School of Technology Management and Engineering, SVKM’s NMIMS University, Mumbai, INDIA. His areas of interests are Image Processing, Operating systems, Information Storage and Management.