Physics and Astronomy Publications
Physics and Astronomy
1990
Cluster diffusivity: Structure, correlation, and
scaling
H. C. Kang
Iowa State University
P. A. Thiel
Iowa State University
James W. Evans
Iowa State University, [email protected]
Follow this and additional works at:
http://lib.dr.iastate.edu/physastro_pubs
Part of the
Biological and Chemical Physics Commons
The complete bibliographic information for this item can be found athttp://lib.dr.iastate.edu/physastro_pubs/422. For information on how to cite this item, please visithttp://lib.dr.iastate.edu/howtocite.html.
Cluster diffusivity: Structure, correlation, and scaling
Abstract
We have investigated the diffusion of clusters on a triangular lattice using Monte Carlo simulations. A cluster is
defined as a two‐dimensional collection of particles which are connected to each other, either directly or
indirectly through other particles in the cluster, by nearest‐neighbor bonds. Each particle is allowed to hop,
with probability αδb/2/(α−δb/2+αδb/2), to a vacant nearest‐neighbor site with the constraint that the hop
does not break the cluster. The change in the number of bonds is given by δb. The equilibrium clusters are
correlated animals with structure controlled by the parameter α. We show that the diffusion coefficient of a
cluster can be decomposed into two factors. One is a measure of the weighted length of the ‘‘active’’ perimeter
and the other is a measure of the correlation between pairs of steps taken by the cluster during its walk. The
perimeter measure is asymptotically proportional to cluster size
N, as anticipated for ramified animals, but it
crosses over to
N1/2 dependence for smaller compact clusters with α>1. Our focus is on the accurate
determination of the size and structure dependence of the correlation factor, which is more sensitive to
statistical fluctuations. As a result, we describe the scaling of the cluster diffusion coefficient with cluster size.
Disciplines
Biological and Chemical Physics | Physics
Comments
This article is published as Kang, H. C., P. A. Thiel, and J. W. Evans. "Cluster diffusivity: Structure, correlation,
and scaling."
The Journal of Chemical Physics
93, no. 12 (1990): 9018-9025, doi:
10.1063/1.459708
. Posted
with permission.
Cluster diffusivity: Structure, correlation, and scaling
H. C. Kang, , P. A. Thiel, and , and J. W. Evans
Citation: The Journal of Chemical Physics 93, 9018 (1990); doi: 10.1063/1.459708 View online: http://dx.doi.org/10.1063/1.459708
Cluster diffusivity: Structure, correlation, and scaling
H. C. Kang, P. A. Thiel,a) andJ.
W. EvansDepartments of Chemistry and Physics and Ames Laboratory, Iowa State University, Ames, Iowa 50011
(Received 12 June 1990; accepted 14 September 1990)
We have investigated the diffusion of clusters on a triangular lattice using Monte Carlo simulations. A cluster is defined as a two-dimensional collection of particles which are connected .to each other, either directly or indirectly through other particles in the cluster, by nearest-neighbor bonds. Each particle is allowed to hop, with probability
/jb/2/( ~{jbl2 {jb/2) • • • .
a a
+
a , to a vacant nearest-neighbor site with the constramt that the hop does not break the cluster. The change in the number of bonds is given by 8b. The equilibrium clusters are correlated animals with structure controlled by the parameter a. We show that the diffusion coefficient of a cluster can be decomposed into two factors. One is a measure of the weighted length of the "active" perimeter and the other is a measure of the correlation between pairs of.steps taken by the cluster during its walk. The perimeter measure is asymptotically proportional to cluster size N, as anticipated for ramified animals, but it crosses over to NI/2
dependence for smaller compact clusters with a
>
1. Our focus is on the accuratedetermination of the size and structure dependence of the correlation factor, which is more sensitive to statistical fluctuations. As a result, we describe the scaling of the cluster diffusion coefficient with cluster size.
I. INTRODUCTION
The diffusion of adsorbed atoms, either singly or in clus-ters, is an important component of many surface phenome-na. There have been numerous experimental observations using field-ionization microscopy of the diffusion of single atoms or small clusters on clean metal surfaces.I
-8 There
have also been many numerical and theoretical investiga-tions of both single adatom and cluster diffusion on surfaces. In the case of the single adatom, symmetric random walks on lattices provide useful models. Previous numerical and theo-retical investigations of cluster diffusion include molecular dynamics simulations,9-14 phenomenological kinetics based upon master equations,15-17 and general mathematical frameworks for the description of one-dimensional cluster diffusion along the troughs of corrugated crystal sur-faces. 18-20
In this paper we show that the diffusion of a cluster can be modeled by the correlated walk of the cluster center of mass on a lattice. In addition, we provide a framework wher-eby the dependence of the cluster diffusion coefficient D
upon the number of arrangement of atoms in the cluster can be understood. The dependence upon the number of parti-cles in the cluster has been studied previously using molecu-lar dynamics simulationsl3,14 and it was suggested that the
diffusion coefficient scales as N -Y, with y::::: 1. 76 fitting the
simulation results. We approach the problem by analyzing the relationship between the structure of the cluster and the diffusion coefficient. The latter can be decomposed into two structure-dependent factors: fa measuring the length of the "active" perimeter of the cluster and C(a,N) measuring the intrinsic correlation of the cluster's walk. The latter reflects
aJ National Science Foundation Presidential Young Investigator (l985~
1989) and Camille and Henry Dreyfus Foundation Teacher-Scholar ( 1986-1990),
the correlation between the directions of steps taken by the cluster center of mass. In this manner we can show how the diffusion coefficient depends upon the number of particles in the cluster, and how the diffusion of a cluster can be regard-ed as the correlatregard-ed walk of a single particle on a lattice. Specifically, we perform Monte Carlo simulations and ob-tain fa and C(a,N) for clusters on a triangular lattice.
II. MODEL PRESCRIPTION AND ANALYSIS
A cluster is defined as a collection of particles any pair of which are connected to each other either directly, through nearest-neighbor bonds, or indirectly, through other parti-cles in the cluster. A triangular lattice is used in our simula-tions. The cluster diffuses as a result of the particles in the cluster executing hops to vacant nearest-neighbor sites with the constraint that hops which result in cluster breakup are not allowed. Specifically hops occur at rate hw( a,8b), where
w(a,8b), the probability of success of a hop, is equal to
{jb/2/( {jb/2 - {jb/2) 8b' h .
a a
+
a , I S t e change m the number ofpairs of occupied nearest-neighbor sites if the hop occurs,
and h is the rate at which hops are attempted.
The Monte Carlo simulations are performed by ran-domly picking a particle. One of the six lattice directions is then chosen at random. If the nearest-neighbor site in that direction is occupied the procedure is repeated. Ifthe chosen site is vacant, then the particle is allowed to hop into it with a probability w(a,8b), provided the cluster remains connect-ed. The procedure is then repeatconnect-ed. Time is asymptotically proportional to the number of attempts per particle in the cluster. One can thus correctly obtain the asymptotic time dependence and diffusion coefficient for the above contin-uous-time model.
It is instructive to think of a as the Boltzmann factor for the strength of the lateral interaction between two nearest-neighbor adatoms (with a > 1 corresponding to attractive
Kang, Thiel, and Evans: Cluster diffusivity 9019
interactions and a
<
1 corresponding to repulsiveinterac-tions). With this interpretation of
a,
not allowing hopswhich result in the breakup of the cluster is a somewhat nonphysical constraint which, however, ensures that well-defined clusters are obtained in the simulations. The same constraint has been used in molecular dynamics
simula-tions.9 I t was found that if this constraint is not imposed (the
method of predissociation), and the diffusion of clusters is simulated only until the cluster breaks up, the diffusion coef-ficient obtained in the simulations is smaller than that ob-tained with the constraint imposed (the method of no
disso-ciation).9 When the method of predissociation is used in
molecular dynamics, cold clusters, which have a longer life-time, are sampled more than hot clusters which dissociate
quickly during the simulations.9
At low temperatures disso-ciation is not important and the diffusion coefficients ob-tained are the same for both cases. Similar considerations may be appropriate for our Monte Carlo simulations. How-ever, it is not clear how the diffusion coefficient
D = limr_ 00 7 - 1 (Rem -Rem)' where 7 denotes time and Rem
denotes the cluster center of mass, can be defined for clusters which have a finite lifetime. Thus, we have restricted our consideration to the case of no dissociation in order to sepa-rate the effects of cluster structure from the effects of cluster lifetime on the diffusion coefficient.
For a specific number of particles N in the cluster, there
can be many possible different shapes and orientation. For
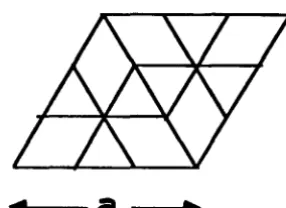
N = 3 the 11 possible types of clusters are shown in Fig. 1.
Transitions from one cluster type to another result from the nearest-neighbor hop of a single particle. All possible transi-tions for each of the trimers are indicated by the arrows in Fig. 1. By considering all possible hops, it can be seen that the process of cluster diffusion causes the center of mass of the cluster to hop from one site to another on a subset of a
triangular lattice with a lattice constant equal to 1/ N times
the lattice constant on which the cluster diffuses. This cen-ter-of-mass lattice is illustrated in Fig. 2 for the case of the trimer. Note that some sites on this lattice correspond to
more than one cluster type. When a is equal to unity, the
clusters are random animals, i.e., all types of clusters have equal weight in the equilibrium distribution of cluster types. This can be seen by considering the transitions between any
two cluster types A and B of size N. Starting from a cluster of
type A the probability of choosing the hop that changes it
into a cluster of type B is w(1,8b)/6N. The probability of
picking the particular hop that takes type A to type B out of a
total of 6N possible hops is 1/6N and the probability of
suc-cess is w(1,8b), where 8b is the change in the number of
nearest-neighbor bonds as a result of the transition.
Similar-ly, for a cluster of type B, the probability of the transition
that changes it into a cluster of type A is w( 1,8b)/6N. Since
w(1,8b) is equalto w(1, - 8b) the forward and reverse
tran-sitions occur at equal rates. Hence, at equilibrium all types of
clusters have the same weight. Therefore, when a is equal to
unity the clusters are random animals. Just as random ani-mals are associated with the zero occupancy limit of random lattice filling, the correlated animals that we obtain in our
simulations when we set a not equal to unity are likewise
associated with the zero occupancy limit of cooperative
lat-FIG. 1. The II types oftrimers on a triangular lattice. The arrows indicate the possible hops that can occur during diffusion.
tice filling.21
•22 They have weights proportional to ab, where
b is the total number of bonds in the anima1.21
Since diffusion occurs by perimeter particles hopping to vacant nearest-neighbor sites, the perimeter of the cluster must play an important role in determining the diffusion coefficient. A few different measures of the perimeter length of a cluster can be defined. Conventional measures include
tv, the number of vacant sites which are nearest neighbors of
.... I---a
-~.~FI G. 2. The unit cell of the center-of-mass lattice for the trimer on a triangu-lar lattice. Diffusion of the trimer can be considered to be a correlated walk of a point on this lattice. The distance between nearest-neighbor sites is equal to 1/ N times the lattice constant, denoted by a in the figure, for the triangular lattice on which the cluster diffuses.
[image:5.599.303.519.47.402.2] [image:5.599.305.448.590.694.2]9020 Kang, Thiel, and Evans: Cluster diffusivity
particles in the cluster, and t f the number of particles (filled
sites) in the cluster with vacant nearest-neighbor sites. We can also define a weighted active perimeter for each cluster type as
la = ~w(a,8b), (1)
where the sum is over all possible hops for that cluster type. Note that I) is simply half the number of possible hops that can occur. In the limit of large N, all different perimeter measures are expected to behave as
«I» -N, (2)
where ( ( ) ) denotes the average over the equilibrium ensem-ble of clusters.22 Clearly, the crossover to this ramified
re-gime depends strongly on the value of a (see below). In order to calculate such averages, one must correctly sample the equilibrium ensemble. This can be done by starting a walk with a randomly chosen cluster type, and sampling the clusters obtained at equal time intervals during the walk to build up an ensemble. Since the process is ergodic this en-semble is the same as the equilibrium enen-semble, i.e.,
(3) T -00
where ( ) T denotes the average at time 70ver many walks. In the simulations, we achieve this ergodic average by simply sampling after equal numbers of attempted moves. 23
We can define the diffusion coefficienl Dusing
(4) T -00
where Rem is the position of the center of mass of the cluster. For the analysis of D, it is particularly instructive to consider an analogous quantity in which the number of successful hops nh plays the role of time, limn,,_ 00 nh- 1 (Rem -Rem) n,,' It is then natural to define
(5)
since C(a,N) would be unity if the cluster undergoes a ran-dom walk, i.e., when there are no correlations between the displacements of pairs of hops executed by the cluster. This can be seen by expanding (Rem -Rem) n" in terms of the dis-placement r m that occurs at the mth hop,
nil - 1
(Rem-Rem
t"
=
nhPo + 2I
(n h - m)Pm' (6)m= 1
where Pm
=
(rn-r n+m) is the correlation between the dis-placements that occur at hops nand n+
m in an ensemble of walks, for any n. With no correlation between hops Pm is nonzero only for m = O. When this is the case, we obtain(7)
since the lattice constant of the center-of-mass lattice is 1/ N.
Since the rate for an individual allowed hop in the con-tinuous-time model is hw(a,8b), the definition Ofla implies that the rate of the total number of successful hops occurring at time 7 is given by h (I a ) T ' Therefore, one has
(n h )T=hgd7'(la )T" (8)
The process is ergodic s() that, for 7-+ 00, we can write
(n h) T -h7«la», (9)
where
« »
denotes the equilibrium ensemble average de-fined by Eq. (3). Since the variance of the distribution of values of n hi 7, at time 7, vanishes as 7 -+ 00 , we obtain in thelimit of large 7
(Rem-Rem)T = C(a,N) (nh)TIN2
-hC(a,N)7( (Ia) )IN 2.
( lOa)
( lOb)
Then, from the definition of the diffusion coefficient, we find that
D=hC(a,N)«la»IN2. (11)
Equation ( 11) shows that we can decompose the diffu-sion coefficient into a factor depending upon the weighted length of the active perimeter and a factor depending upon the correlation between hops. It should be noted that both these factors are dependent on the structure of the clusters. The active perimeter length is clearly structure dependent. In the limit of large N, «Ia» is proportional to N. The correlation factor C(a,N) will also depend on cluster struc-ture in a more subtle way. An exception occurs in the case of dimers for which C(a,2)
==
1, trivially. In determiningC(a,N), correlations between various step displacements
are weighted by the relative occurrence of these displace-ments, which in turn depends on cluster structure (i.e., on a) - as shown in the results below.
III. SIMULATION RESULTS
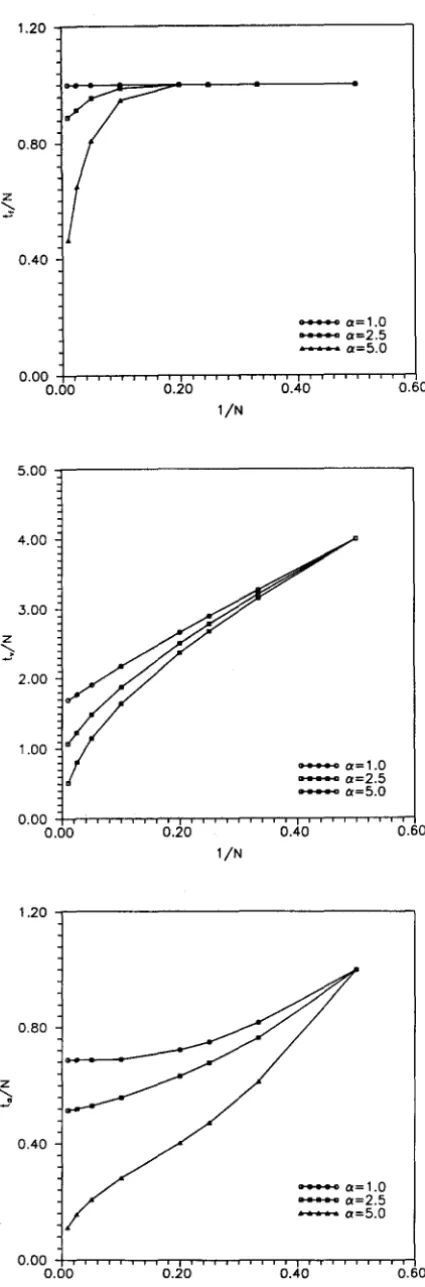
Simulations of cluster diffusion were performed to study the behavior of the active perimeter length and the correla-tion factor. The cluster size for which we performed simula-tions ranges from N = 3 to N = 100. The results for perim-eter lengths are shown in Figs. 3(a)-3(c). For each set of values of a and N we performed 106 simulation runs. The
perimeter length t f, obtained by counting the number of filled sites at the perimeter of the cluster, is plotted in Fig. 3(a), the perimeter length Iv, obtained by counting the num-ber of vacant sites at the perimeter of the cluster, is plotted in Fig. 3(b), and the active perimeter length la' obtained by taking the equilibrium ensemble average of Eq. (1), is plot-ted in Fig. 3 (c). In each plot the resulting values of liN for each value of a are shown as a function of 1/ N. Since these clusters are all expected to be in the random animal univer-sality class, in the limit of large N, liN should approach a constant value regardless of the value of a,zI,22,24-26 When a is equal to unity, this is clearly seen in all three measures of the perimeter length. Indeed for all three measures, the re-sults for cluster sizes greater than or equal to 10 are very well described by straight lines, i.e., 10 is sufficiently large for the asymptotic behavior to be exhibited. Our simulations show a largeN limit of approximately 1.62 for Iv IN. This is in agree-ment with the previously obtained value.24
When a is greater than unity compact clusters, which have a larger number of nearest-neighbor pairs, have a larger weight than less compact clusters. Although the ratio tiN should still approach a constant in the limit of large N, the
Kang, Thiel, and Evans: Cluster diffusivity 9021
z
:?
z
J
z
')
1.20 . . . . - - - ,
0.80
0.40
0.00
0.00 0.20
5.00
4.00
3.00
2.00
1.00
0.00
0.00 0.20
1.20
0.80
0.40
1/N
1/N
1/N
... a=1.0 ... a=2.5 - a = 5 . 0
0040
[image:7.599.43.256.39.683.2] [image:7.599.310.513.534.732.2]... a=1.0 ... a=2.5 ... a=5.0
0.40
... a=1.0 ... a=2.5 ... a=5.0
0.60
0.60
FIG. 3. (a) The ratio of the perimeter length I f to the number of particles in the cluster N as a function of liN. Each plot is for the value of a indicated in the key. (b) The ratio of the perimeter length I" to the number of particles in the cluster N as a function of liN. Each plot is for the value of a indicated in the key. (c) The ratio of the perimeterlength la to the number of particles in the cluster N as a function of liN. Each plot is for the value of a indicated in the key.
approach to large N behavior as a function of N is much slower. Hence, the nonlinear behavior shown by t / N when a
is greater than unity can be expected. In Fig. 4 we plot log(ta) as a function 10g(N), for each value of a. When a is equal to unity the scaling ta - N is again clear for small val-ues of N. However, as the value of
a
increases, the value of Nabove which the asymptotic regime for the scaling is reached increases. When a is equal to 5.0 even our largest cluster size of N = 100 does not reach the asymptotic limit of unity slope. The exponent that we obtained for our range of cluster sizes is approximately 0.5, as might be expected for compact clusters. This shows that for small clusters with sufficiently large attractive interactions between the particles in the clus-ter, as might be expected of metal clusters at low tempera-tures, the perimeter of the clusters varies as N.112 However,
there is a crossover to t-Nbehavior when the cluster size becomes sufficiently large. If the diffusion coefficient be-haves as D - N -Y, then, using Eq. (11), there is a
contribu-tion of negative one from the perimeter length to the value of
y in the limit of large N for all values of a. However, for clusters in which the particles interact attractively with each other, the results can be affected by crossover in the scaling of the perimeter length.
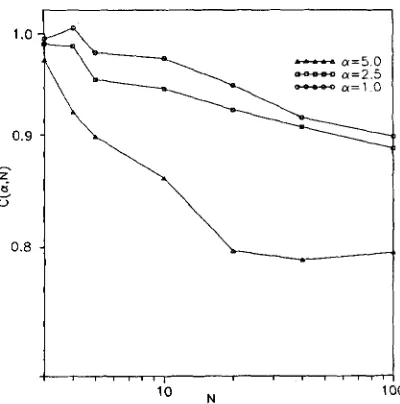
The correlation factor C(a/N), can be obtained from plots of the mean square displacement as a function of the number of successful hops. The simulation results are shown in Figs. 5(a)-5(c). In each figure we plot the results for N
equal to 3, 10, and 100. The corresponding value of a is shown in each figure. In each figure, we have mUltiplied the mean-square displacement by N2
, so that the slopes of the
lines give the corresponding values of C(a,N) [cf. Eq . ( lOa) ]. If there is no correlation between the hops executed by the particles of the cluster, then the slope of these plots should be equal to one. This, as shown below, is the case for
a = 1 and N = 3. The deviation from unity slope seen in the corresponding line in Fig. 5(a) is statistical in nature. In
1 0 0 . . . . - - - .
~ 10
... a=1.0 ... a=2.5 - a = 5 . 0
10
N
100
FIG. 4. The perimeter length I" as a function of N. Note that the axes are both logarithmic. The values of a for each plot are indicated in the key.
9022 Kang, Thiel, and Evans: Cluster diffusivity
2000~---'3
C 1500
"
E
"
u"
Ii
VI
'iJ
~ 1000
"
:J0-"
C"
"
:::; 500
500 1000 1500
Number of successful hops
10 100
2000
2000~---'3
C 1500
"
E.,
<J"
a.'"
'iJ~ 1000
o :J 0-w c o
.,
:::; 500500 1000 1500
Number 01 successful hops
10 100
2000
2000~---'
C 1500
"
E.,
u"
I i III 'iJ" 1000
L-"
:J
0-III
C
"
"
:::; 500500 1000 1500
Number 01 successful hops
3
10 100
2000
FIG. 5. (a) The mean-square displacement as a function of the number of successful hops for a equal to 1.0. The slope of each line is equal to C( 1.0,N)
and is plotted in Fig. 6. (b) The mean-square displacement as a function of the number of successful hops for a equal to 2.5. The slope of each line is equal to C(2.S,N) and is plotted in Fig. 6. (c) The mean-square displace-ment as a function of the number of successful hops for a equal to 5.0. The slope of each line is equal to C( 5.0,N) and is plotted in Fig. 6.
general, it is seen that there is correlation between the hops, and that the correlation [C(a,N) < 1) is such that the center of mass of the cluster of size N diffuses slower than the center of mass of N randomly walking particles. The best fit values of C(a,N) are plotted in Fig. 6. The confidence limits are about 0.05 for each data point in Fig. 6. It can be seen that
C(a,N) decreases with N for any value of a, and decreases with a for any value of N. In our simulations the largest cluster size is only 100. As a result of this limited range in cluster size and the noise in the data it is clearly not sufficient to establish whether a power-law relation exists between
C(a,N) and N. However, assuming that a power-law rela-tion
CC
a,N) - N - £ in which E is independent of a, doesapply, we obtain a value of E approximately equal to 0.03 from the simulations in which a is equal to 1.0 and 2.5. The results for a equal to 5.0, in which case a crossover in the cluster structure occurs as we have discussed above, suggest that a higher effective exponent may be observed for small N
and large a.
IV. DISCUSSION
Using the results for
<
<ta) > and CCa,N) obtained from the simulations, we can understand how the diffusion coeffi-cient might scale with the number of particles in the cluster . In the case of clusters in which the attractive interaction is strong, as is probably true for most experimentally observ-able clusters on surfaces, the crossover cluster size for the perimeter length is large. Therefore, the perimeter length effectively scales as N. 112 Assuming that the value of E, theexponent for the correlation factor, is approximately 0.03, we can apply Eq. (11) to get a scaling relation for the diffu-sion coefficient in which the exponent y is approximately 1.53. This is comparable to the value of approximately 1.76 that was obtained from molecular dynamics simulations of Rh clusters on Rh(l00).'3 However, in comparing these re-sults one should bear in mind the many differences that exist between the simulations of Rh cluster diffusion and this
1.0
0.9
0,8
[image:8.594.43.272.47.682.2] [image:8.594.309.509.523.725.2]10 N
... a=5.0
... 0<=2.5 ..., 0<=10
100
FIG, 6, The correlation factor C(a,N), i.e., the slopes of the lines in Figs, 5(a)-5(c), as a function of N. The value of a for each plot is indicated in the key,
Kang, Thiel, and Evans: Cluster diffusivity 9023
work. Firstly, a Lennard-Jones potential was used to calcu-late the interaction energy between the Rh atoms, whereas here we have merely assumed nearest-neighbor interactions. The lattice is triangular here, whereas the Rh(100) is a
square lattice. It should also be noted that, in molecular
dy-namics, there are dynamical correlations between hops. In our Monte Carlo simulations these are not present. Further-more, the particles in molecular dynamics move according to Newton's Laws, whereas the updating procedure for our simulations are done with Kawasaki dynamics.27 Notwith-standing these differences, it is possible to extract from the molecular dynamics simulations an average energy change when the number of neighbor bonds is changed by one.
Equating this to kTln(a), we obtain, for the Rh on
Rh ( 100) system at a temperature of 2000 K a value for a of
approximately 50. The higher exponent obtained in the mo-lecular dynamics simulations might, therefore, be expected.
In general, for large N we conclude that the exponent for the
diffusion coefficient y is equal to 1
+
E, where E is theexpo-nent for the correlation factor. For a large, there is a
cross-over from (3/2)
+
E, for small values of N, to 1+
E for largevalues of N. Also as a result of the crossover, the effective
value of E is probably larger for small clusters which are
compact.
One of the interesting features to emerge from the simu-lations here is the presence of corresimu-lations in cluster
diffu-sion even in the case for which a is unity, i.e, the random
animal case. In an earlier paper28 on diffusion of random animals, this correlation was not considered at all. In that paper any particle could exchange positions with any vacant site so that the length scale of the cluster itself played an important role. Here we have allowed only nearest-neighbor hops so that the perimeter length is important. Thus, our results are not easily compared with their results. Neverthe-less, there would be corrections to the scaling relations for the exponent of the diffusion coefficient reported there in the
case of nontrivial correlation factor scaling,
E>
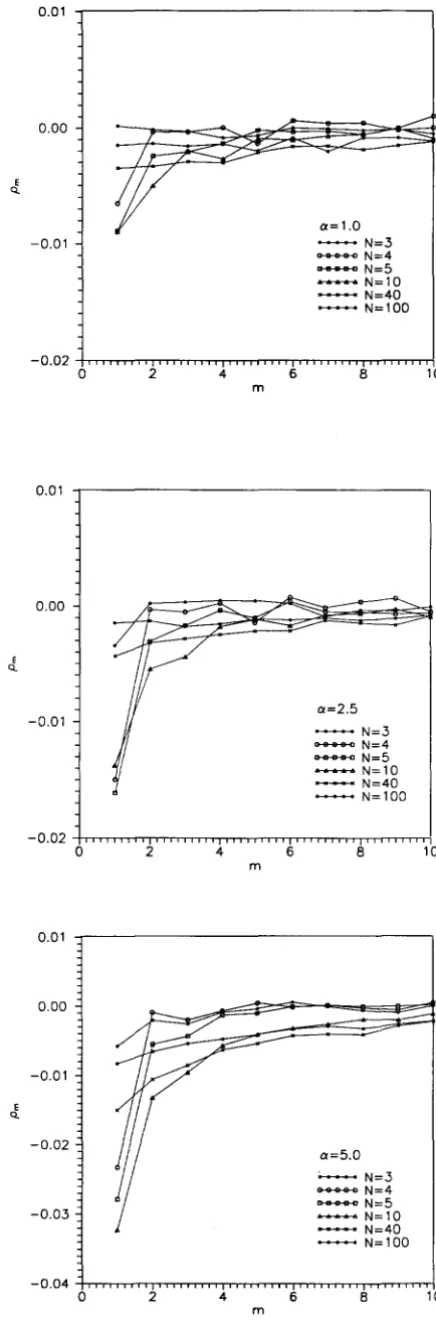
O.In Figs. 7(a)-7(c) we plot the quantities Pm as a
func-tion of m. It can be seen that these quantities are all negative.
Although we have presented only the results for a greater
than or equal to unity, we have found that Pm is negative
even for a less than unity. In this latter case the clusters,
which can be rather stringy, may be thought of as consisting of particles which experience repulsive interactions with each other. Although such clusters may not be physically relevant, a comparison with polymers seems instructive.
Since the values of Pm are negative regardless of the value of
a, it is probably the case that the correlation arises from the
connectivity of the cluster. From Figs. 7(a)-7(c), it can be
seen that, for each value of a, the strength of the correlation
increases with N for N up to about 10, and then it decreases, for m
<
3.1t should be noted, however, that since C(a,N), cf.Fig. 6, seems to decrease monotonically with N, the range of
Pm must increase sufficiently fast with N in order to
over-come the decrease of the strength with N. The decrease in the
strength of Pm with N for large N can be understood as
fol-lows. As the number of particles in the cluster increases, the number of possible hops must also increase. Therefore, the influence of a single hop on the directions of successive hops
E Q. E Q. E Q. 0.01 0.00 -0.01
o 2
ac=1.0
~N=3 ..., N=4 ..., N=5 ~N=10
~N=40
~ N=100
4 6 8 10
m
0.01 . . . , - - - ,
0.00
-0.01
m
ac=2.5
[image:9.597.302.520.47.708.2]~N=3 ... N=4 ..., N=5 ~N=10
~N=40 ~ N=100
0.01 . . . , - - - ,
0.00
-0.01
-0.02
-0.03
ac=5.0 ' - - N 3
... N 4 ..., N 5 ~N 10 ~N 40 ~N 100
- 0.04 -n,rrr;rrnrrr;rrr;rrr;rrr;rrnrrnrrnrrnrrnrrnrrnrrn-rnm
o 2 4 6 8 10
m
FIG. 7. (al The ensemble average correlation Pm between the displacement at the nth hop and the displacement at the (n
+
m)th hop during cluster diffusion is shown as a function of m. The value of a is 1.0. (bl As for (al with a = 2.5. (cl As for (bl with a = 5.0.9024 Kang, Thiel, and Evans: Cluster diffusivity
(possibly in far removed parts of the cluster) must decrease with N. However, the larger the number of particles the larg-er the numblarg-er of hops that is necessary in ordlarg-er to "forget" the original cluster structure. Thus, the range of the interac-tions increases as N increases. In order to study how the strength and the range of the correlation depend on N, better statistics than we have here are necessary.
As can be seen in the plot for N equal to 3 in Fig. 7(a), the simulations indicate that Pm is close to zero for all m in the case of the trimer when
a
is unity, i.e., the correlation factor C( 1,3) is close to unity. Indeed it can be shown that C( 1,3) is exactly equal to unity. In general, the mean-square displacement can be written as(Rcm·Rcm)n
=
nhPo+ 2(rn ·(rn - I + ... +r))" Ii ,.
+ ... + 2(r2·(rl
»,
(12)where each parenthesis on the right contains the sum of hop vectors, i.e., the displacement of the diffusing cluster center of mass, up to a particular hop. For each of these trajectories, the next hop can be anyone of all the possible hops from the cluster type at which each trajectory ended. If, however, the weighted sum of the possible hop vectors from the cluster type at the end of a trajectory is zero, then the contribution from that trajectory is zero. When a = 1, the weighted sum just reduces to a simple sum. Since the sum of the hop vectors for any trimer is zero, then all the correlation terms are zero when a is unity. Therefore, C( 1,3) is equal to unity.
v.
CONCLUSIONSWe have shown that the diffusion coefficient for clusters is a product of two factors. One contains the weighted active perimeter length of the cluster, and the other reflects the correlation between pairs of hops taken by the particles dur-ing the diffusion of the cluster. We have shown that the ac-tive perimeter length scales as ta - N in the limit oflarge N.
There is, however, a crossover from ta - N 112 at small values
of N, and the crossover occurs at increasingly large values of
N as the value of a increases. The diffusion of the cluster can be represented as its center-of-mass motion on an appropri-ate "rescaled" lattice. The simulations show that correlation between pairs of hops results in the center of mass diffusing with a smaller diffusion coefficient than would be the case if it were undergoing a random walk of its center of mass.
Although we have treated the case in which diffusion occurs by means of nearest-neighbor hops, it is clear that the formalism can be applied to diffusion in which hops oflonger distances can occur, in the spirit of Ref. 27. In this case, Eq.
( 11) should be replaced by
D
=
C(N) «H» «8R~m»'where «8R~m» is the average mean-square displacement per hop, ( (H ) ) is the average number of hops per unit time, and C(N) is the intrinsic correlation. As in Ref. 27 one ex-pects «8R~m» to scale like
«R; »IN
2, where
Rg -NP
isthe radius of gyration. Since hops must occur to perimeter sites,
«H»
certainly reflects the perimeter length, but un-doubtedly in a more complicated way than is true for the simple model we have studied here. It is also possible to extend the model by including both restructuring andaggre-gation. In that case the microstructure varies under two time scales: the time scale of rearrangement, which is considered here, and the time scale of cluster growth.
Our analysis provides the means to understand how a scaling relationship between the number of particles in the cluster and its diffusion coefficient can arise. The approach that we have taken enables us to break down the exponent in this scaling into a contribution from the active perimeter and a contribution from the correlation factor, and also to under-stand how the structure of the cluster affects the value of the exponent that might be observed. For clusters diffusing as a result of the particles executing nearest-neighbor hops, we conclude that in the limit of large cluster size the scaling exponent for the diffusion coefficient is 1 + E, where E is the scaling coefficient for the correlation factor. In principle, when a is large a crossover is expected from (3/2) + E, for small (compact) clusters, to 1 + E for large clusters. How-ever, considering the large value of a (approximately 50) noted above for Rh clusters on Rh( 1(0), it is likely that for such systems the cluster size necessary for the crossover to occur must be extremely large. The effective value of E may also be larger before crossover to the asymptotic limit oc-curs. Our results for clusters of size N = 3 to N = 100 on a triangular lattice, are consistent with molecular dynamics simulations for Rh clusters on Rh( 1(0).
ACKNOWLEDGMENTS
Primary support for this work is derived from a Camille and Henry Dreyfus Foundation Teacher-Scholarship. In ad-dition, computing facilities are provided by the Ames Labo-ratory. Ames Laboratory is operated for the U.S. Depart-ment of Energy by Iowa State University under Contract No. W-7405-Eng-82. I.W.E. is supported by the Division of Chemical Sciences, Office of Basic Energy Sciences.
IG. Ehrlich and F. D. Hudda, J. Chern. Phys. 44, 1039 (1966). 20. W. Bassett and M. J. Parsley, Nature (London) 221,1046 (1969). ·'G. Ehrlich, CRC Crit. Rev. Solid State Sci. 4, 205 (1974).
4W. R. Graham and G. Ehrlich, J. Phys. F 4, L212 (1974). 5T. Sakata and S. Nakamura, Surf. Sci. 51, 313 (1975).
"T. T. Tsong, P. Cowan, and G. Kellogg, Thin Solid Films 25,97 (1975). 70. W. Bassett, J. Phys. C 9, 2491 (1976).
"K. Stolt, W. R. Graham, and G. Ehrlich, J. Chern. Phys. 65, 3206 (1976). 9J. C. Tully, G. H. Gilmer, and M. Shugard, J. Chern. Phys. 71, 1630
(1979).
lOS. H. Garofalini, T. Halichioglu, and G. M. Pound, J. Vac. Sci. Tech. 19, 717 (1981).
"s.
H. Garofalini, T. Halichioglu, and G. M. Pound, Surf. Sci. 114, 161 ( 1982).12S. M. Levine and S. H. Garofalini, Surf. Sci. 163, 59 (1985). "A. F. Voter, Phys. Rev. B 34, 6819 (1986).
14J. D. 0011 and A. F. Voter, Annu. Rev. Phys. Chern. 38, 413 (1987). 15K. Kitihara, H. Metiu, J. Ross, and R. Silbey, J. Chern. Phys. 65, 2871
( 1976).
IbU. Landman and M. F. Schlesinger, Phys. Rev. B 16, 3389 (1977). 17S. Efrima and H. Metiu, J. Chern. Phys. 69, 2286 (1978). 1"0. A. Reed and G. Ehrlich, J. Chern. Phys. 64, 4616 (1976).
19J. D. Wrigley,D. A. Reed,andG. Ehrlich,J.Chem. Phys.67, 781 (1977). "'D. M. Titulaer and J. M. Deutch, J. Chern. Phys. 77, 472 (1982).
Kang, Thiel, and Evans: Cluster diffusivity
2'D. E. Sanders and J. W. Evans, Phys. Rev. A 38, 4186 (1988). 220ne expects that the fractal dimension for the correlated animals, in the
limit oflarge N, to be equal to that for random animals, i.e., approximately
3/2 (see Ref. 26).
2JIf the sampling were done at equal numbers of successful moves, the aver-ages obtained would not be equivalent to the ergodic averaver-ages because
different cluster types have different lifetimes. 24C. Domb and E. Stoll, J. Phys. A 10, 1141 (1977).
25J. A. M. S. Durate, Lett. Nuovo Cimento 22,707 (1978).
26D. Stauffer, Phys. Rep. 54, 1 (1979).
27H. C. Kang and W. H. Weinberg, J. Chern. Phys. 90, 2824 (1989).
2"H. Gould and K. Holl, J. Phys. A 14, L443-L451 (1981).
J. Chern. Phys., Vol. 93, No. 12, 15 December 1990