InTrans Project Reports Institute for Transportation
1-1996
The Potential for Performance-Based Standards as
the Basis for Truck Size and Weight Regulation in
the United States
Thomas H. Maze
Iowa State University
Follow this and additional works at:http://lib.dr.iastate.edu/intrans_reports Part of theCivil Engineering Commons
This Report is brought to you for free and open access by the Institute for Transportation at Iowa State University Digital Repository. It has been accepted for inclusion in InTrans Project Reports by an authorized administrator of Iowa State University Digital Repository. For more information, please [email protected].
Recommended Citation
Maze, Thomas H., "The Potential for Performance-Based Standards as the Basis for Truck Size and Weight Regulation in the United States" (1996).InTrans Project Reports. 204.
The Potential for Performance-Based Standards as the Basis for Truck Size
and Weight Regulation in the United States
Abstract
This research project examines truck size (dimensions) and weight regulation in other countries, from Europe to Asia to Africa, to identify size and weight regulations that are based on standards of truck performance. Such standards, known performance-based regulations, are intended to ensure that the allowable size and weight of trucks are governed by safety standards and/or by standards for infrastructure (pavement and bridges) wear. The purpose of our examination is to determine if similar standards of performance might be integrated into the truck size and weight regulations in the United States and identify the issues related to integrating this type of size and weight regulation.
Keywords
Quality of work, Size and weight regulations, Standards, Wear
Disciplines Civil Engineering
Comments Draft Final Report
Prepared for the ATA Foundation 2200 Mill Road
Alexandria, Virginia 22314
Prepared by the
The Potential for
Performance-Based Standards as the
Basis for Truck Size and Weight
Regulation in the United States
Center for Transportation Research and Education Iowa State University Research Park
2625 N. Loop Drive, Suite 2100 Ames, Iowa 50010-8615
Draft Final Report
17,
1996
'
i
I·
Iowa Department of Transportation Library
/( CHAPTER 1: INTRODUCTION
This research project examines truck size (dimensions) and weight regulation in other countries, from Europe to Asia to Africa, to identify size and weight regulations that are based on standards of truck performance. Such standards, known performance-based regulations, are intended to ensure that the allowable size and weight of trucks are governed by safety standards and/or by standards for infrastructure (pavement and bridges) wear. The purpose of our examination is to determine if similar standards of performance might be integrated into the truck size and weight regulations in the United States and identify the issues related to integrating this type of size and weight regulation. (;
In most cases, the imposition of performance truck size and weight standards would allow motor carriers to enjoy the benefits of more productive vehicles ifthe vehicles meet or exceed
performance criteria. For example, two trucks with the same axle loads and gross weight but with different suspension systems might impose different amounts of wear to pavements. Using performance-based regulations, the truck with the suspension that causes less pavement wear would be allowed to have higher axle or gross weight.
This study is intended to create a better understanding of how the science and engineering affect the implementation of performance-based size and weight standards, and to understand how performance-based standards are applied in countries throughout the world. This information provides the background to understand the economic implications of, and the science and policy issues involved in, the integration of performance standards into truck size and weight
regulations in the United States.
One of the principal conclusions of this report is that there are still many issues which remain to be resolved before reasonably accurate estimates can be derived regarding the benefits and costs of applying performance-based standards. For example, the state of the art of pavement design has not yet been developed to the point where pavement life predictions are sensitive to the performance of heavy vehicle components traveling on the pavement. Hence the science of pavement design does not allow the prediction of improvements in pavement longevity (benefits) due, for example, to better truck suspension systems. However, what is clear is that performance standards can be used to promote the development of vehicles which cause less road wear and are safer. In most cases where performance standards are applied, motor carriers are given the incentive of more productive vehicles (vehicles with higher axle or gross weight or the capability to carry larger volumes). As a result, the state of the relevant parties (motor carrier, highway agency, and other vehicles sharing the traffic stream with heavy vehicles) has been improved. Although the exact magnitude of benefits is difficult to establish, there is evidence that there is a positive net improvement from applying performance-based standards. Further, it may be that limiting the size and weight of vehicles based on their compliance with performance standards will provide a more robust and scientifically justified system of vehicle regulation than
regulation based on historically prescribed standards.
The interaction of heavy vehicles with the highway infrastructure and other vehicles are two central issues to performance-based standards and ones which have been examined in many other
projects. One recent project proposed that the "Regulation of the trucks permitted to use the highway and apportionment of costs to vehicles in accordance with road wear should be based on a thorough understanding of the way in which trucks interact with and damage pavements."1 This chapter begins with a summary of those primary characteristics of vehicles most affecting vehicle/roadway interaction. Subsequent sections define the concept of performance-based standards for heavy vehicles, detail the history of truck size and weight regulation in the U.S., examine the current mood towards size and weight reform, and review the project scope and document structure.
The Interaction of Heavy Vehicles with the Traffic Safety Environment
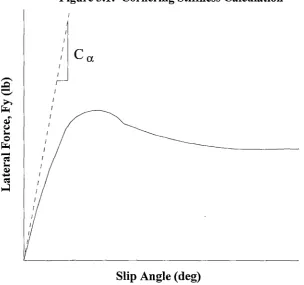
A study in Australia revealed that inequalities in vehicle handling characteristics had implications on traffic safety.2 The goal of the study was to define the heavy vehicle
performance criteria affecting traffic safety and assess the range of performance capabilities of the existing Australian heavy vehicle fleet. The study used computer simulations to determine the differences in roll stability, rearward amplification, low-speed offtracking, and high-speed offtracking of 19 common heavy-vehicle configurations. Briefly summarized, roll stability is a measurement of the lateral force that a vehicle can sustain before tipping over, rearward
amplification is a measure of how much side to side motion increases as you move back towards the rear of the vehicle, and offtracking is a measure of the difference in wheel path from the front the front to the rear of the vehicle. (A more detailed description of vehicle handling properties is provided on pp 34-46.) The study results are summarized below:
• Non-articulated vehicles and truck-trailer configurations have less roll stability and exhibit a greater tendency to tip over at a given lateral force than tractor-trailer configurations.3
• Rearward amplification varied considerably among vehicle configurations. Generally, multiple truck-trailer configurations (such as long wheelbase non-articulated vehicles coupled to single or twin trailers) and complex road train configurations (such as triple trailer vehicles) exhibited greater rearward amplification than single tractor-trailer configurations.4
• Overall length and/or wheelbase have a significant effect on low-speed offtracking for all vehicle configurations. 5
• Single unit vehicles have the least high-speed off-tracking while longer, heavier vehicle configurations have the greatest high-speed offtracking.6
T.D. Gillespie, et. al. Effects of Heavy-Vehicle Characteristics on Pavement Response and Performance. Transportation Research Board, National Research Council. NCHRP Report 353. 1993. p 4.
Peter F. Sweatman. Overview of the Dynamic Performance of the Australian Heavy Vehicle Fleet. Technical Working Paper No. 7. National Road Transport Commission. Melbourne, Australia. July, 1993.
PeterF. Sweatman. pl9-30.
Peter F. Sweatman. p 33.
Peter F. Sweatman. p 37.
Peter F. Sweatman. p 40.
The Interaction of Heavy Vehicles and the Roadway
A recent National Cooperative Highway Research Program study identified, through computer simulations, the truck properties that are most crucial to vehicle/highway interaction.7 In that
research, computer models were developed to represent 29 different vehicle configurations ranging from two-axle non-articulated vehicles to nine-axle turnpike doubles. Simulation programs were then used to quantify the fatigue and rutting caused by the computer-modeled vehicles to asphalt and concrete pavements. The simulation programs revealed not only that all vehicles are not equal in the wear caused to pavement, but also, the vehicle characteristics that are most influential in vehicle/highway interaction. The following paragraphs summarize the findings of that research:
Axle Loads
Axle loads are the greatest single vehicle factor of fatigue to both rigid and flexible pavements. The primary reason for this is that pavement fatigue has been assumed to increase exponentially with respect to axle load. Assuming that a fourth power relationship exists between axle load and pavement wear, a single axle that is loaded to 20,000 pounds causes 16 times as much pavement wear as a single axle that is loaded to 10,000 pounds.
Gross Weight
Heavier trucks are not necessarily more damaging to pavements. For example, the computer simulations revealed that a three-axle refuse hauling vehicle weighing 64,000 pounds causes over twice the pavement fatigue of a nine-axle twin-trailer Turner vehicle weighing 114,000 pounds.8 However, the researchers found that gross weight is the primary determinant of rutting in asphalt pavements. Simply stated, the total rut depth caused by a truck on flexible pavements is the sum of the ruts created by each individual axle.
Tandem-Axle Suspension Systems
The performance characteristics of tandem-axle suspensions were found to be a source of differences in the amount of pavement wear. This is caused by inequalities in load sharing among the individual axles and the dynamic loads produced by the suspensions. Specifically, those tandem axles with poor static load sharing caused between two and 54 percent more pavement wear than tandem axles that divided their loads equally.
Additionally some suspension types were found to produce greater dynamic loads than others. Specifically, walking beam suspensions were found to cause twice as much wear to pavements as other suspensions because of "tandem-hop" created by walking beam suspensions.
"Tandem-hop" is a condtion in which a force (such as a bump in the roadway surface) causing one axle of the tandem group to move upward also causes the other axle in the tandem to simultaneously move downward because the rigid beam connecting the two axles is pivoted in
T.D. Gillespie, et. al.
T.D. Gillespie, et. al. p 14.
the center. The computer models revealed that air ride suspensions caused the least amount of dynamic loads to pavements because each axle of a tandem acts independently.
Axle Spacing
The spacing of axles within a group was found to have little effect on the fatigue of flexible pavements and a noticeable effect on the fatigue of concrete pavements. This is because rigid pavements distribute their loads over distances similar to common axle spacings. The computer simulations revealed that on 10-inch thick concrete pavements a tandem-axle group loaded to 36,000 pounds with axles spaced 6.75 feet apart caused the same amount of pavement wear as a single axle loaded to 18,000 pounds. However, ifthe tandem axles were spaced only 4.25 feet apart they would cause roughly 1.40 times as much pavement wear as a single axle loaded to 18,000 pounds. This same relationship also existed for tridem axles. The researchers noted that tridem axles loaded to 54,000 pounds with axles spaced at four-foot intervals caused no more damage than a single 18,000 pound axle on thin concrete pavements.
Tire Configurations
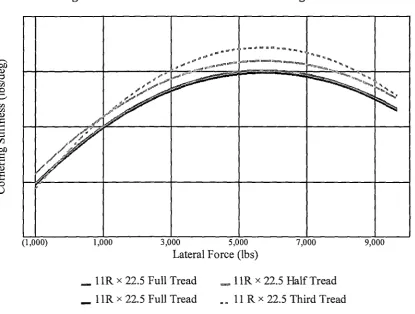
Three types of tire configurations (single tires, dual tires, and wide-based single tires) were studied. The findings revealed that axles equipped with single 11Rx22.5 tires produce 15 to 21 percent higher stress per pound of load than axles equipped with dual tires of the same size. Although the pavement wear was reduced when wide based single tires were used, they still elevated pavement stress by two to nine percent over that applied by dual-tire axles.
Tire Inflation Pressure
The computer simulations revealed that increases in tire inflation pressure above 75 PSI greatly increased the pavement wear on asphalt pavements. Raising the inflation pressure of a 15Rx22.5 tire from 75 PSI to 120 PSI was shown to cause 9 times greater pavement wear for asphalt pavements. For dual tire axles equipped with common tire sizes (1 lR x 22.5) raising the tire inflation pressure from 75 PSI to 120 PSI was shown to cause 2.8 times greater wear to asphalt pavements.
Taken collectively, these two major reports emphasize that not all vehicles are equal in the vehicle/pavement/traffic safety equation. A rational set of truck size and weight regulations could capitalize on this research and grant the more benevolent vehicles greater size and weight limits than other vehicles. This concept is the foundation of performance-based standards for truck size and weight regulations.
Truck Size and Weight Regulations
Truck size and weight regulation standards can be divided into three types: prescriptive standards, like those currently applied in the United States; parametric performance-based standards, which include parameters known to be related to performance; and pure
performance-based standards. Most size and weight regulation in the United States is not based on pure performance standards or on performance related parameters. They are based on historical compromises between trucking, shipping, and rail interests and implementation and enforcement considerations. These are prescriptive standards.
Parametric performance-based standards include performance criteria and regulate truck size and weight based on parameters known to be related to performance. For example, some suspensions have lower dynamic loads and thus cause less road wear than other suspensions.9 Parametric performance-based standards regulate the natural frequency and damping ratio of a suspension. These standards are enforced through tests to monitor suspension rebound rates and the ability of the suspensions to reduce or dampen rebound. Such tests are extremely difficult to apply and enforce at the roadside.
Pure performance-based standards govern size and weight based only on performance. In this case, the vehicle designer develops a vehicle which meets or exceeds the performance criteria. A pure performance standard specifies either the allowable wear the vehicle can impose on bridges and pavements or the allowable impact on the safety environment of the roadway. Only the vehicle's performance is regulated, not the mechanisms that make the vehicle capable of meeting the performance criteria. An example of a pure performance-based standard is in Annex I of the European Union's Directive 85-3 turning circle performance standard.10 To meet the
performance test, the vehicle in motion must be able to turn a 360-degree circle within a 12.5 meter radius without off-tracking into a 5.3 meter radius inner circle. This test has the effect of regulating a combination of dimensions which impact the vehicle's ability to maneuver.
In regard to suspensions, a pure performance-based specification would regulate the level of dynamic loads imposed on pavements or the relative pavement stress the vehicle imposes regardless of the design of the suspension and the static axle loads. As an incentive to operate with a suspension which imposes less road wear for a given axle load, motor carriers should be allowed to carry more payload weight. Annex I of the European Union Directive 85-3 allows tractor-trailer combinations equipped with dual tires on all but the steer axle and with
suspensions which are more benevolent ("road friendly") to carry four additional metric tonnes. Suspensions judged to be road friendly must meet parameters measuring their suspension damping and frequency of rebound following the application of a standard suspension loading. 11
History of U.S. Truck Size and Weight Regulation
To understand the issues relating to a potential change in size and weight policy, it is first necessary to understand how current U.S. truck size and weight policy has evolved.12 Current
Dynamic loads are the theoretical increase in pavement stress caused by a vehicle in motion, over the static loads caused by a vehicle at rest. One study concluded that the theoretical increase in damage done by dynamic wheel loads of three suspensions was torsion bar-19 percent, four-spring-22 percent, and walking beam-37 percent. David Cebon. Interaction Between Heavy Vehicles and Roads. Society of Automotive Engineers, Thirty Ninth Ray
Buckendale Lecture. Warrendale, PA. March, 1993. p. 53.
10 Laying Down the Maximum Authorised Weights and Dimensions for Road Vehicles Over 3.5 Tonnes
Circulating Within the Community. Commission of the European Communites. Brussels, Belgium. December 15,
1993. p. 26.
II Most commonly, a load is applied by rolling the vehicle off an 80-millimeter high ledge.
12 The description of the evolution of size and weight policy is extracted from T.H. Maze, C.K. Walter, and A.G.
size and weight limits for interstate commercial vehicle operations on the Interstate System and National Network in the United States have evolved from an amalgamation of state-generated size and weight standards. Between 1913 and 1933 every state generated its own size and weight standards. Sometimes the standards were consistent from one state to the next, but often each state developed its own size and weight standards without considering uniformity among states. The legacy of independently developed size and weight standards became the base upon which national standards were enacted. As a result, national standards were achieved through
compromise among a number of non-uniform historical standards.
In 1932, the American Association of State Highway Officials (AASHO), which later became the American Association of State Highway and Transportation Officials (AASHTO), recommended a 16,000 pound (7.25 metric tons) axle load limit. AASHO revised its policy in 1946 and
recommended a single-axle load limit of 18,000 pounds (8.15 metric tons) and a tandem-axle limit of 32,000 pounds (14.5 metric tons). To limit the stress on bridges, the AASHO policy recommended a maximum weight limit of 73,280 pounds (33.25 metric tons) for vehicles with extreme axles at least 57 feet (17.4 meters) apart. To help implement its policy AASHO officials recommended a method for computing maximum vehicle weight based on the number of axles and the distance between them. This method is known as the bridge formula. Using this method, vehicle operators determine maximum vehicle weight by measuring the distance between the vehicle's furthest spaced axles.
The Federal-Aid Highway Act of 1956 applied the AASHO standards to the interstate highway system. The act also allowed states to continue to use weight and size limits greater than those recommended in the AASHO policy, thus grandfathering higher weight and size limits in place. In 1974, Congress adopted increased axle limits of20,000 pounds (9.05 metric tons) per single axle and 34,000 pounds (15.4 metric tons) per tandem axle. It also adopted a revised bridge formula to allow gross vehicle weight to increase to 80,000 pounds (36.3 metric tons). The new axle and gross weight limits were caps for states that did not already have higher limits. Other states that already had higher limits were allowed to grandfather the higher pre-existing limits. States that did not want to increase their weight limits to the higher limits on the interstate highway system could stay at their prior gross weight and axle load levels. The 1974 legislation (as well as the 1956 legislation) included provisions for states that already issued permits for oversized and/or overweight trucks to continue to exercise that authority (e.g., longer
combination vehicles (LCVs)).13
Realizing that truck size and weight uniformity was an important issue, Congress mandated in the Surface Transportation Assistance Act of 1978 that the Federal Highway Administration perform a study of size and weight issues. The response to Congress generated by this study contained one of the earliest references to performance-based size and weight criteria in a U.S. Department of Transportation policy document. One of the policies proposed by the Federal
Smadi, Policy Issues of an Iowa Longer Combination Vehicle Network, (Ames, Iowa), Midwest Transportation
Center, November, 1994, pp. 3-5.
13
B.L. Geuy. Longer Combination Vehicles, Private Carrier, Vol. 26, December, 1989, p. 14.
Highway Administration was the adoption of performance-based size and weight regulations. 14 However, no action was taken on this recommendation.
The Surface Transportation Assistance Act (ST AA) of 1982 removed the option of states to have lower than the uniform standard for weight limits on the National Highway Network, thus promoting uniformity. With few exceptions, states could no longer impose limits on weights, widths, lengths, or combinations that were more restrictive than the federal limits. The STAA introduced an increased federal role in vehicle size and weight regulation by preempting states' right to limit overall length of singles or doubles and requiring "reasonable access between the National Highway Network and terminals and facilities for food, fuel, repairs, and rest."15
The STAA also grandfathered state limits that exceeded federal limits and continued to allow states to authorize the operation of larger trucks under special permits. Since the enactment of the ST AA in 1982, national truck size and weight regulations have remained constant. The Intermodal Surface Transportation Efficiency Act (ISTEA) of 1991 even froze current limits on the use of oversize and/or overweight trucks operating under divisible load permits to highways where states permitted their operation as of June 1, 1991.16
The last national policy on truck size and weight was promulgated through the 1982 STAA. Since the 1982 enactment of ST AA, 14 states have adopted some type of LCV system before the incremental expansion (state-by-state) of LCV highway systems was halted by ISTEA.
However, the ISTEA freeze was only intended to provide a pause while truck size and weight policy is examined, and ISTEA legislation even directs the conduct of studies of longer
combination vehicle safety, use, and economics to support the future development of new truck size and weight policy.17
The end of the ISTEA legislation and the need to create a new transportation authorization bill during 1997 has created an environment which is favorable for truck size and weight policy reforms.
Productivity and Safety Innovations Since 1982
14 An Investigation of Truck Size and Weight Limits: Final Report of the Secretary of the Department of
Transportation to the Congress pursuant to Section 161 of Public Law 95-599, the Surface Transportation Assistance Act of 1978, (Washington, D.C.), U.S. Department of Transportation, 1981, pp. S-4, S-5.
15 Guide for Monitoring and Enhancing Safety on the National Truck Network, Federal Administration, (Washington, D.C.), 1986, p. 2.
16 Summary- Motor Carrier Act of 1991, Title JV of the lntermodal Surface Transportation Efficiency Act of
1991. Federal Highway Administration, (Washington, D.C.), Publication No. FHWA-MC-92-005, p. 7.
17
Three General Accounting Office reports on longer combinations vehicles were prepared in response to the IS TEA legislation. They include: Truck Safety: The Safety of Longer Combination Vehicles is Unknown. United
States General Accounting Office, (Washington, D.C.), 1992, GAO/RCED-92-66; Longer Combination Truck Drivers Controls and Equipment Inspection Should Be Improved. United States General Accounting Office,
(Washington, D.C.), 1993, GAO/RCED-94-21; and Longer Combination Trucks: Potential Infrastructure Impacts, Productivity Benefits, and Safety Concerns. United States General Accounting Office, (Washington, D.C.), 1994,
GAO/RCED-94-102.
A recent survey examined the profitability strategies planned by the chief executive officers of 220 class one truckload motor carriers over the next three years.18 In this research, executive officers were asked to rate the relative importance level of 49 possible profitability strategies that their firm might undertake. Of the 49 strategies, respondents indicated "increase equipment productivity" as most important, and "control costs" as second in importance. These CEO strategies have remained consistent since the motor carrier industry was economically
deregulated in 1980 and have partially contributed to innovations in transportation productivity and safety.
Productivity improvements in the period from 1983 to 1993 have driven costs out of the logistics supply chain and resulted in a reduction in our nation's freight bill from 14.5 percent of gross domestic product (GDP) to 9.8 percent of GDP.19 During the same period the medium/heavy duty fatal accident rate fell by 3 7 percent while miles driven by medium and heavy trucks have increased by 41 percent.20 Pressure resulting from the increased global competitiveness of our economy and public concerns for improved safety will motivate motor carriers to seek similar improvements during the next decade. However, continued improvements will be more difficult to achieve without added resources for motor carriers to draw on. The integration of
performance-based standards into the United States truck size and weight regulation framework could provide the motor carrier industry the necessary incentive to develop more productive and safer equipment without additional impacts on our nation's highway infrastructure.
Current Mood Towards Size and Weight Regulatory Reform
The end of the I STEA legislation and the need to create a new transportation authorization bill during 1997 have created an environment which is favorable for truck size and weight policy reforms. Other factors which have made the issue of size and weight regulation reform more timely include the following:
• The North American Free Trade Agreement (NAFTA) requires that the trading partners implement a working program to make compatible standards related to vehicle weights and dimensions within three years after the agreement went into force.21 NAFTA entered into force on January 1, 1994; thus the program to develop compatible standards must be in place by January 1, 1997. Because the three countries have different size and weight standards at the national level, some harmonization of size and weight regulation will be necessary.
18 Frederick J. Stephenson, and Theodore P. Stank. "Truckload Motor Carrier Profitability Strategies."
Transportation Journal. Winter, 1994. pp 5-17.
19
Steve Davis. 1994 State of Logistics Annual Report. Cass Information Systems. Bridgeton, MO. May I 0, 1995.
20
Thomas J. Donohue. The Truth About Highway Safety. Address to the Commercial Vehicle Safety Alliance. Sun Valley, Idaho. October 23, 1995.
21 Land Transportation Standards Subcommittee: Annex 913. 5.a-1, North American Free Trade Agreement,
pp. 9-17.
• Prior size and weight regulation promulgated by states was based on political considerations and is a result of compromise among a number of constituent parties. Existing national legislation seeks to promote uniformity, but national legislation only loosely ties together state based regulation. These compromises were not necessarily based on safety concerns of the roadway environment, engineering concerns of the roadway infrastructure, and economic concerns of an efficient motor freight industry. In fact, some relaxation of size and weight requirements at the state level has resulted in innovative designs that fit the requirements but has had the perverse affect of increasing wear to pavements and bridges. As a result, reform would provide the opportunity to make size and weight regulation more rational and support an efficient balance among all these considerations: safety, roadway infrastructure impacts, and motor carrier
economics.
• Over the course of the history of the trucking industry, from the 1920s until the
enactment of the STAA of 1982, truck weights have incrementally grown as technology has improved and as states and the federal government have relaxed size and weight restrictions. However, from the early 1980s to the present, the average gross weight of loaded trucks on highways in the United States has remained almost unchanged.22
During the same period, truck transportation technology has changed dramatically, and, due to advances in technology and safety policy, truck transportation has improved its safety record.23
Although increased size and weight limits through further regulatory reform are not inevitable, many segments of the industry want further reforms, and history illustrates that further relaxation of size and weight regulation is likely. To allow that increase to occur while simultaneously providing for public safety and protection of the investment in highway infrastructure is an opportunity which should not be missed.
These coinciding factors provide an environment ripe for size and weight reform. It is, therefore, incumbent on transportation policy makers to provide size and weight reforms which support North American trade, are compatible with an intermodal transportation system, and are based on engineering and science supporting superior safety and reduced road/bridge wear performance. The above factors, and possibly others, have coincided in time and have led the U.S. Department of Transportation to reexamine truck size and weight policy. The Department of
Transportation's Federal Highway Administration (FHWA) is currently conducting a two-phase study of size and weight policy. 24 One possible result of the FHW A's analysis is to recommend the movement of U.S. truck size and weight regulation away from current prescriptive standards to standards based on the vehicle configuration's performance. A separate chapter of this report
22
Maze, Walter, and Smadi, p. 18.
23
From 1982 to 1993 fatal accidents involving combination trucks in the United States declined by 15 percent. Over the same period, ton miles carried by trucks increased by 69 percent. Fatality Facts 1994 - Large Trucks,
Insurance Institute for Highway Safety, (Arlington, Virginia), and R.A. Wilson, Transportation in America, Eno
Transportation Foundation, Inc, (Lansdowne, Virginia), 1994, p. 44.
24 Comprehensive Truck Size and Weight Study, Federal Register, Vol. 6, No. 22, (February 2, 1995), pp. 6587
-6590.
highlights the possible infrastructure and safety benefits of implementing performance standards into U.S. size and weight regulations.
The current standards for size and weight regulation are based on political compromise and historical reasons rather than on striking an efficient balance among vehicle safety, wear imposed on highways/bridges, and freight transportation productivity. The current prescriptive size and weight standards provide no incentives for developing or purchasing vehicles with dimensions and components that allow the vehicle to operate more safely or cause less pavement/bridge wear. Performance-based standards have been proposed as a method for improving the productivity of freight vehicles while promoting motor carrier industry innovation.25 Further, performance-based standards create a completely new structure for size and weight regulation, thus allowing states and the federal government to evolve to a new and more rational size and weight regulation system.
Project Scope
The research began with a review of pavement and bridge design standards for many
industrialized countries to provide an understanding of how axle and gross vehicle weight limits are derived. Similar to infrastructure design standards, the properties of vehicle handling were also examined to reveal how size and weight regulations affect the safe operation of a vehicle on the roadway.
This research examined the truck size and weight regulations in 32 jurisdictions including the United States and the size and weight regulations of several states within the United States. The purpose of this examination was to determine the type and extent of performance criteria applied to vehicles operating at various gross weights. The study-countries' regulations were organized into a uniform arrangement to support classification of performance criteria. The classification was used to group the identified performance criteria into two broad categories: those designed to control pavement wear or protect highway infrastructures, and those designed to protect traffic safety and the highway safety environment.
Because the truck size and weight enforcement community is also included in the set of
transportation stakeholders, any size and weight regulation reforms should address the concerns of this group. For example, the truck size and weight enforcement officials might wonder ifthe roadside verification of a vehicle's stability characteristics is acceptable or even practical, given the influence of cargo loading and placement. To address the concerns of these officials, the project reviewed the study-countries' enforcement practices to determine the issues related to monitoring the performance criteria of trucks operating under performance-based regulations. For example, the project examines how the stability requirements of two-trailer "A" trains permitted to operate at gross weights up to 97, 000 pounds ( 44 metric tonnes) are checked in New Zealand.
25
P.F. Sweatman, Overview of the Dynamic Performance of the Australian Heavy Fleet, (Melbourne, Australia): National Road Transport Commission, Technical Working Paper No. 7, July, 1993, p. 1.
The research next provided a summary of the performance-based standards that might be
logically included in any U.S. truck size and weight regulation reforms. This summary discussed the enforcement issues, benefits, and potential role of approximately 22 noted performance standards that directly or indirectly based size and weight on the interaction between the vehicle and the infrastructure and/or the traffic safety environment.
The research concluded with a discussion of the methods of assessing the benefits of a shift from prescriptive to performance-based size and weight regulations.
Document Structure
This report consists of seven subsequent chapters. Chapters two and three present an overview of infrastructure design principles and elements of vehicle handling and performance. The purpose of these discussions is to provide an understanding of the issues related to
performance-based truck size and weight regulations.
Chapter four presents a summary of the size and weight regulations and the performance criteria for selected countries. The chapter concludes with a classification of the performance criteria used to control the interaction between vehicles and the highway infrastructure (pavement and bridges) and traffic safety environments.
Chapter five summarizes the size and weight enforcement methods used by selected countries in our study to ensure that vehicles are operating within the defined performance envelopes. The material presented in this chapter is primarily based on interviews and correspondence with individuals from regulatory agencies, industry suppliers, and trade organizations.
Chapter six summarizes the potential role, benefits, and enforcement issues associated with governing size and weight based on 22 performance standards that were noted among the 32 study jurisdictions.
Chapter seven summarizes the potential benefits of a shift from prescriptive to performance based size and weight regulations. The chapter also examines several methods of assessing the benefits of such a shift.
Chapter eight summarizes the findings of the pavement and vehicle design literature review, existing applications of performance-based standards among the 32 study jurisdictions, and current size and weight enforcement practices among selected countries known to be using performance-based standards for regulating truck size and weight. The chapter also summarizes the likelihood of implementing various performance-based standards into U.S. size and weight regulations and discusses the issues associated with such and incorporation.
CHAPTER 2: INFRASTRUCTURE DESIGN OVERVIEW
The issue of determining the benefits and costs of performance-based truck size and weight standards presents significant challenges to designers, builders, and maintainers of pavements and bridges. At the crux of this issue is the variability of pavement performance.26
Some of the forces creating variability in pavement performance are well understood and can be controlled. Other issues defining the variability in pavement performance still remain to be researched. The purpose of this chapter is to provide an understanding of the infrastructure issues related to performance-based standards through a review of principles of pavement and bridge design.
Pavement Design Overview
Most proposals to create truck size and weight performance-based standards to reduce road wear deal with reducing the level of dynamic loads applied to the pavement as the truck travels along the highway. Other attributes which may be regulated to reduce road wear include tire pressure and tire width to weight ratio. However, the variability in pavement performance makes it difficult to understand exactly how changes in size and weight standards will impact pavement performance.
In non-technical terms, this section will provide the background information needed to
understand why performance-based specifications for truck dimensions is such a difficult issue with which to contend. The section will also explain why it is difficult to offer solid forecasts of the implications of performance-based standards on pavement life.
Pavement Design Evolution
Road building has been a function of most civilizations since the discovery of the wheel. The Persians and later the Romans were early long-distance road builders. The Romans first applied scientific methods to the building of roads. Generally, Roman road construction started by digging two trenches roughly five meters apart to act as drains.27 The soil between the two trenches was removed down to a firm foundation. The soil was then replaced by layers of locally available granular materials. Where materials were available, the surface was paved with flat quarry stones. These roads were intended mostly to withstand the loads of hoofed animals. Because travel speeds were low, the smoothness of the road was not a concern in the design of the road. The Roman roads were generally three to five feet thick and the roadway structure was built to support the loads placed on the surface rather than relying on the subsurface materials to support the roadway.
The Roman designs were the standard for paved roadway structures until the late eighteenth century. A French road builder and engineer, Pierre Marie Jerome Tresaguet, introduced the
26 Pavement managers generally define pavement condition through a series of measurable properties (e.g., roughness, crack, patching, etc.). The change in condition over time is known as the pavement's performance.
27 David Croney and Paul Croney, The Design and Performance of Road Pavements: Second Edition, McGraw-Hill Book Company, London, England, 1991, p.5.
I --1
concept that a relatively light surface, compared to massive road structures of the Romans, could be built on a well drained subsurface.28 The importance of this new concept is that it now allows the natural subsurface materials to play a role in supporting the pavement and the subsurface materials become part of the entire paving structure. The Roman road building concept was to replace the surface and to allow the materials laid in the paving process to be the paving structure.
Thomas Telford introduced other important concepts into road building when, in 1816, he directed the construction of the Carlisle-Glasgow Road. In this roadway, emphasis was placed on level grades and a smooth road surface. John MacAdam, however, provided the innovation leading to modem road design procedures. His design was based on the principal that a
well-drained and compacted base should support the load applied to the pavement. The paving stone surface should act only as wearing surface. His original approach was to let the normal traffic compact the material. The use of compacted and drained layers below the pavement wear surface to support the wearing surface is the principle underlying all modem roads. In a modem highway, the surface material of a paved road is the strongest material, to resist the compressive and tensile stresses induced in the pavement due to heavy wheel loading. With increasing depth within the pavement, the stress becomes less as the stress is distributed through the pavement structure. Particularly in asphalt concrete pavements, this allows gradation of layers from stronger and more expensive materials to weaker and less expensive materials.
Roads which were built based on MacAdam's principles of pavement design, where layers of compacted and drained materials were used to support a wearing surface, are macadam roads. In the mid-1800s, mechanical compaction techniques (e.g., steamrollers), as opposed to compaction by traffic, resulted in increasing the speed of road building. In the 1870s, the use of oils and other agents came into play for reducing dust, and in the mid- l 870s the first asphalt surfaced roads in the United States were built.29
In the early 1900s several bituminous surfaced (surfaced with varying bituminous materials) macadam roads were built, and in 1909 the first Portland concrete paved road was built.
Early pavement designers developed designs based on experience. The primary difficulty with the use of experience was that soil conditions could vary dramatically between locations
resulting in variations in pavement life even under similar traffic loading. Subsequent pavement design methods were based on empirical observations and measured or predicted strength of the soils. Common methods required the designer to categorize the soil based on standard
classifications. The classification was then used to estimate the needed pavement subbase and total pavement thickness.
The California Bearing Ratio (CBR) became the most popular method of testing the strength of soil and then using the soil strength to determine the needed subbase and pavement structure.
28 American Association of State Highway Officials, "Public Roads of the Past: 3500 B.C. - 1800 A.D.," AASHO, Washington, D.C., 1952.
29 Yang H. Huang, Pavement Analysis and Design, Prentice Hall Englewood Clifts, New Jersey, 1993, p. l.
The CBR measures the soil penetrating resistance relative to a standard crushed rock.30
Original methods for using the CBR were first developed by the California Highway Department in 1929 and were employed extensively by the Corps of Engineers during World War II and became quite popular after the war.
In addition to early methods based on soil strength and experience, Huang has categorized other pavement design methods, into four additional categories:31
• Shear failure methods, which are based on developing a pavement thick enough to resist shear failures under wheel loading.
• Limiting deflection methods, which are based on determining the pavement thickness where the vertical deflection will not exceed an allowable limit.
• Regression methods, which use road test data or data collected from test sites and relate pavement performance to loading.
• Mechanistic-empirical methods, which use mechanics of materials methods to relate inputs, such as a wheel loading, to output or pavement response, such as stress or strain. The most prevalent technique for designing pavements throughout the world is based on regression analysis. The AASHTO pavement design methods are based on regressions relating pavement performance to traffic loading. The primary source of data for the AASHTO design equations was a large-scale road test conducted in the late 1950s and early 1960s. The most significant disadvantage of these methods is that the design equations are based only on
conditions that existed during field data collection. Conditions other than those under which the equations were estimated require modifications based on experience or theory. In addition, the validity of the application of the regression equations is limited by the stability of statistical relationships. Although there is good reason to believe that there should be a relationship between the variables in the regression equations, there is no underlying theoretical explanation for the regression equations or their functional form. More specifically, the variables are ·statistically related but the functional form of the relationship is not explained by theory. The
ability of equations to predict pavement life under differing conditions is dependent on the stability of the empirically observed relationships. Recent results of the performance of in-service pavement test sections have provided considerable evidence which tends to question the validity of the assumed stability of the AASHTO design equations when used in different environmental and loading conditions than those under which the relationships were originally estimated.
Mechanistic design methods are intended to bridge the shortcomings of regression techniques. Mechanistic design methods are based on mechanics of materials and employ the behavior of materials and not simply on statistical relationships between empirically observed variables. Current mechanistic models are calibrated using laboratory tests and field performance information. Dependence on empirical data is necessary because theory alone has not proven sufficient to design pavements realistically.
30 Huang, p.2.
31 Huang, pp. 3-4.
All current methods are based on static or moving loads without considering the inertial impacts due to dynamic loads or the variations of impacts due to any vehicle properties (e.g., tire
pressure).32 For example, the vehicles used in the road tests which generated the data supporting the AASHTO design methodology exerted dynamic loads on the test pavements. During the test, however, vehicle and road surface properties (e.g., suspension type or pavement roughness) were not varied to determine the impact of dynamic loads on pavement life. Because dynamic loads are not a variable in pavement design methodologies, current methodologies are incapable of determining the impact on pavement life or pavement condition due to changes in dynamic loads due to vehicle design, although simulation techniques have been employed to estimate the likely impacts ofreduced dynamic loads due to improved suspensions.33
•34
Regression Design Techniques
Many empirical design methodologies are used throughout the world, all involving the
development of test sections of varying designs and exposing them to either controlled loads or normal traffic. For example, since the 1940s in Britain hundreds of experiments have been conducted where test sections have been built on heavily trafficked highways.35
Each test section is then routinely monitored. Traffic loading in several locations is monitored through the use of weigh-in-motion devices (known as weigh bridges in Britain) installed in the traffic lanes. The data collected at these locations are then used to statistically identify relationship between traffic loading, age, and pavement wear.
In the United States, commonly used pavement design methodologies are supported by data collected through road tests. The principal road test in the United States was the AASHO (now the AASHTO) road test conducted in Ottawa, Illinois between 1957 and 1961. The object of the AASHO road test was to test a variety of road construction designs exposed to repetitive truck traffic.
As part of the AASHO road test, a measure, termed serviceabilty, was developed for determining relative road wear and deterioration. Pavement engineers first established a benchmark for the existing condition of a road from which other pavement measures could be compared. Then relative to this measure, a determination could be made of when the pavement had reached an unacceptable condition (the pavement had reached failure) and how quickly the pavement deteriorated due to repetitive loading. Serviceability was based on the users' opinions of pavement condition.36
The assumption was that highways are for the comfort and convenience of
32
Huang, p.5.
33 T.D. Gillespie, S.M. Karamihas, M.W. Sayers, M.A. Nasim, W. Hansen, N. Ehsan, and D. Cebon, "Effects of Heavy-Vehicle Characteristics on Pavement Response and Performance," National Cooperative Highway Research Program, Report 353, 1993.
34
James W. Stoner and M. Asghar Bhatti, "Estimating Pavement Damage from Longer and Heavier Combination Vehicles," Midwest Transportation Center, Iowa State University, 1994.
35 David Croney and Paul Croney, p. 11.
36
W.N. Carey and P.E. Irick, Pavement Serviceability Performance Concept, Highway Research Board, Bulletin
250, 1960.
the traveling public; therefore, it is the public's opinion of the conditions of the pavement that is important.
To learn the opinions of motorists, AASHO testers had panels of individuals drive over
pavement sections and individually rate the condition of the pavement on a score ranging from zero to five, where zero was very poor and five was very good. The individual scores were termed Individual Present Serviceability Ratings, and the mean of the individual scores was termed Present Serviceability Ratings (PSR). Given that it would be practically impossible to obtain subjective ratings for an entire pavement network, PSR was then correlated to mechanical measurements. Predominantly, it was found that PSR was most highly correlated with pavement roughness, a measure of distortions of the pavement surface. To estimate PSR, a regression equation was developed which is predominantly dependent on the mechanically measured profile of the pavement. The equation also includes the variables representing the portion of the
pavement which is patched and cracked and, for asphalt pavements, the depth of wheel path ruts. The data collected on the pavement conditions are put into a regression equation and the results are an estimate of the PSR. The PSR estimates were named Present Serviceability Index (PSI). Hence PSI is based on mechanically measured conditions of the pavement and is an estimate of PSR, which is based on subjective opinions.
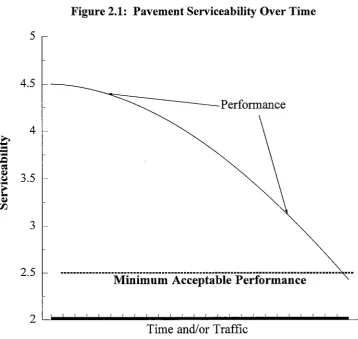
An important concept used in concert with serviceability is performance. PSI measures the condition of a pavement at any point in time. The condition of a pavement over time is considered the pavement's performance. For example, Figure 2.1 illustrates a typical plot of a pavement's decline in serviceability over time. In this case, when the pavement's condition declines to a PSI of2.5 it has reached its minimum acceptable condition. The curve defining the PSI over time represents the pavement's performance. The AASHO road test sought to define the relationship between repetitive axle loading and the pavement's performance to be able to predict when pavements of varying designs would reach a terminal PSI (minimum acceptable PSI).
Although the PSI concept and the equation were developed in the late 1950s, until recently most state transportation department used PSI as a measure of pavement condition and performance. Many agencies have converted to other subjective measures similar to Present Serviceability Index. The underlying concepts of condition, performance, and minimum acceptable levels of condition remain in use today, and they are fundamental concepts for monitoring the
performance of pavements in the field and directing resources through pavement management systems.
Figure 2.1: Pavement Serviceability Over Time
5
4.5
Performance 4
.e-...
-...
,.Q
~
~
3.5
~
...
E:
~00
3
2.5
Minimum Acceptable Performance
2 L..lo ... L _ _
Time and/or Traffic
The test track of the AASHO road test consisted ofloops of highway constructed on the site of Interstate Highway 80. Each loop consisted oftest sections of asphalt and concrete pavement. Trucks of varying weights were driven around the loops 24 hours per day. The test sections varied in thickness and the base material under the asphalt sections varied in construction. From the road test, pavement condition data and truck axle weight data were collected. Ultimately, the data collected showed that the relative wear imposed on a pavement by an axle load is
approximately proportional to the fourth power of the axle load, irrespective of the type or thickness of the pavement. For example, ifthe wear of two axle loads were compared, and one axle carries twice the static weight of the other, the wear imposed by the heavier axle would be roughly 16 times (24
= 16) the wear imposed by the lighter axle. In this case, pavement wear is measured as a reduction in PSI.
To develop a standard for pavement wear, during the AASHO road tests the concept of Equivalent Single Axle Loads (ESAL) was refined. An ESAL was the method developed to express units of road wear. One ESAL is an eighteen thousand pound static load on a single axle. Therefore, one 18,000-pound axle load imposes one unit of road wear. Because road wear generally increases with respect to the fourth power of the increase in static axle loads, doubling the axle load to 36,000-pounds would impose roughly 16 units of road wear. In other words, a 36,000-pound single-axle load would impose in the neighborhood of 16 ESALs.
The ESALs concept was not an original concept developed as part of the AASHO road tests, but the AASHO road tests did develop a formal structure for the use ofESALs in pavement design. Initial attempts to develop a measure of road wear equivalency involved the design of pavements for runways during World War II.37 Design criteria at the time focused on the design of runway pavements for single wheel loading. Dual wheels became an issue for runway designers when B-29 bombers were introduced into combat missions. Since the pavement wear imposed by a dual wheel is not the same as the pavement wear imposed by a single wheel, pavement designers developed measures to equate the pavement wear of a B-29 dual wheel to a single. Later, this same concept was used to develop equivalence between single-axle loads and tandem-axle loads. The AASHO pavement design methods require that design engineers work through a series of steps. First they determine the number ofESALs the pavement is intended to withstand over its design life. Estimates of the ESALs a pavement is expected to receive are based on the
forecasted future traffic over the design life of the facility and the projected weight distribution of the forecasted traffic. Because the relative wear due to static loads tends to vary with the base materials (in the case of asphalt cement concrete [ ACC] pavements) and pavement thickness (in the case of Portland cement concrete [PCC] pavements), different tables are used to convert traffic volumes to ESALs depending on the values of these properties. Once the number of ESALs have been projected over the design life, calculations are made to determine the strength of supporting soil and the materials to be used in the pavement. The designer enters the
calculations into a series of nomographs to determine the paving material's required thickness. Separate ESAL tables are used for ACC and PCC pavements. ACC and PCC pavements fundamentally differ in how they carry loads imposed to pavement surfaces. Engineers refer to ACC as flexible pavement and PCC as rigid pavement. These names provide a useful framework for characterizing these two types of pavements. In a rigid pavement, the PCC surface provides the predominant structural layer. In flexible pavements, the ACC surface provides a wearing course, and the surface layer in conjunction with layers underneath provides the structure needed to withstand the imposed loads.
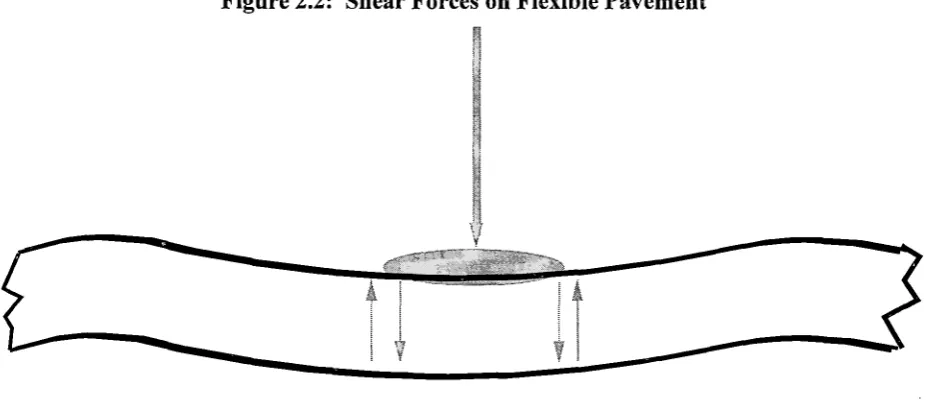
Flexible pavement will generally distribute the loads through shear deformation. In other words, immediately under a load, downward stress is placed on the pavement. To keep from deforming, cohesion with pavement around the loaded location creates a force upward. These forces within the pavement layer are shear stress and are illustrated in Figure 2.2, which demonstrates a load placed on flexible pavement. Arrows within the pavement indicate the shear forces within the pavement. Unlike a flexible pavement, rigid pavements distribute loads much as beams do and· resist loads without bending.
37 Huang, p. 283.
Figure 2.2: Shear Forces on Flexible Pavement
A
~
The difference in how the two types of pavements (ACC and PCC) resist loads is important in understanding the difference in the pavement designs. The surface layer (course) of a :flexible pavement must be strong enough to withstand the shear stress placed on the pavement by wheel loading. It must also have the resilience to resist permanent deformations due to wheel loading. In conjunction with the surface course, the layers beneath the asphalt layer work together to resist wheel loads. On the other hand, the concrete surface layer of a rigid pavement distributes the load across the layers below the pavement by transferring loads like a beam. Figure 2.3 illustrates a load placed on rigid pavement.
Figure 2.3: Forces Exerted on Rigid Pavements
AASHTO pavement designs also defined the pavement stresses created by tandem and tridem axles. Figure 2.4 illustrates stresses created by tandem axle loads according to traditional
[image:23.612.78.538.276.516.2]AASHTO pavement design standards. The figure illustrates the two axles of a tandem imposing a load on the pavement and causing stress in the pavement structure. As the stress is transmitted deeper into the pavement its is distributed through the pavement in a broader and broader cone. According to AASHTO calculations, the stress cones of each wheel could intersect and overlap under the center of the tandem, thus applying a greater stress on the bottom of the pavement than would two equally loaded wheels spread further apart. Hence, closely-spaced tandem axles on thick pavements may cause more wear than two single axles, each with half the load of the tandem. Thus, prescribing tandem axle spacings at a distance that ensures that stress cones do not overlap could reduce pavement wear. However, tandem axle spacing is not a parameter used in the AASHTO equation for determining the equivalent axle loading factors
Figure 2.4 Areas of Overlapping Stress
0
0
I
Area of Overlapping Stress
Recently, researchers have applied finite element analysis to more precisely determine the effect of tandem axle spacing on pavement stress. These researchers found that the influence of axle spacing on pavement wear is dependent on the extent to which the net response under one axle is affected by the forces created by the adjacent axle.38 When an axle passes over a point, two forces, tension and compression exist in the pavement structure near the axle. Tension is a pulling force immediately adjacent to the axle created by the downward forces exerted by the load. Compression is a pushing force originating immediately under the axle which widens in a broad cone-like fashion as illustrated in Figure 2.4. Compression forces can counteract tension forces in rigid pavements because these forces are distributed over distances that are in the same order as common axle spacings. According to research results, the pavement wear resulting from one pass of a tandem axle can be less than the pass of two single axles carrying the same load,
38 Thomas Gillespie, et.al. Effects of Heavy-Vehicle Characteristics on Pavement Response and Performance. Transportation Research Board, National Research Council. NCHRP Report 353. 1993. pp 16-17.
depending on the thickness of the pavement and the spacing of the axles within the tandem axle group. For example, the researchers found that commonly spaced tandem axles (e.g., 4.25 ft)
loaded at 36,000 pounds cause 1.40 ESAls of pavement wear, which is a 40 percent reduction over the wear caused by two 18,000 pound single axle passes (e.g., 2.0 ESALs).
The 1986 and 1993 AASHTO Guide for Design of Pavement Structures and SHRP
Since the AASHO road tests, the design guide has gone through several revisions. However, the most recent versions of the design guides, the 1986 guide and modifications made to the 1986 guide in the 1993 guide, are all primarily based on the same fundamental relationships developed through the AASHO road tests.39•40 The AASHO road tests were limited to a very few types of
paving materials, one subgrade, homogenous traffic (and loading), and one environment. Further, the objective of the AASHO road test was to determine the performance of pavement under repetitive axle loading. Although failure due to repetitive loading is important to the structural design of the initial pavement, there are many other factors which determine the service life of a pavement (e.g., failure due to environmental or material problems). As a result of the many additional variables related to the life of pavements not taken into account during the original road tests, revisions of the design procedures have attempted to take these additional variables into account. For example, the 1986 manual first included factors to qualify the reliability of a design. Other new factors deal with adjustments for freeze-thaw cycles, drainage, sub base erosion, and shoulder design. However, the design parameters are still fundamentally based on the same data and principles derived from the original AASHO road tests, and thus the design techniques reported in the 1986 manual and refined in the 1993 manual have the shortcoming of limited data and limited variation in the environment within which the data were collected.
The Long Term Pavement Performance (LTPP) program of the Strategic Highway Research Program (SHRP), begun in 1989, was intended to address many of the shortfalls of the AASHO road test. Among other things, L TPP would test the performance of pavements under varied conditions and provide information to improve the design equations for new and reconstructed pavements. SHRP evolved from a U.S. Department of Transportation/Federal Highway Administration sponsored project on the role ofresearch in revitalizing the United States highway transportation system.41 The project, Strategic Transportation Research Study, was conducted by the Transportation Research Board during 1983 and early 1984. Focusing on the issue that the United States was under-investing in highway research, the project report identified six areas where more research need to be conducted. They included asphalt, maintenance
cost-effectiveness, protection of concrete bridge components, cement concrete in highway structures, control of snow and ice on highways, and long-term pavement performance.
39
AASHTO Guide for Design of Pavement Structures. American Association of State Highway and
Transportation Officials. AASHTO, Washington, D.C., 1986.
40
· AASHTO Guide for Design of Pavement Structures. American Association of State Highway and Transportation Officials. AASHTO, Washington, D.C., 1993.
41 William 0. Hadley, SHRP-LTPP Overview: Five-Year Report. Strategic Highway Research Program, National Research Council, Washington, D.C., 1994, pp. 2-3.
The six issues were eventually combined to four strategic problem areas, and the SHRP was established as an independent unit of the National Research Council. The four strategic problem areas were:
• Asphalt
• Highway Operations • Concrete and Structures
• Long-Term Pavement Performance (LTPP)
SHRP began in 1987 with a five-year budget of $150 million, which was authorized by Congress through the Surface Transportation and Uniform Relocation Assistance Act of 1987. Later, the Intermodal Surface Transportation Efficiency Act (ISTEA) of 1991 authorized another $108 million for SHRP product implementation and for continuation of the 20-year LTPP program.42
The main feature of the L TPP program was to monitor test road sections located throughout the country and exposed to actual field conditions. This is was the first massive field test since the AASHO road test. This was an effort to quantify the impacts of climate, maintenance practices, long-term loading effects, materials variations, and construction practices. SHRP devoted $510 million for the first five years of the LTPP program to support the massive effort of establishing field test sections (a good share of the funding came from state highway agencies which installed the test sections and not from SHRP's budget).43
The LTPP is scheduled to continue for an additional 15 years (20 in total). The objectives given the L TPP by the advisory committee were to:
• Evaluate existing methods
• Develop improved strategies and design procedures for the rehabilitation of existing pavements.
• Develop improved design equations for new and reconstructed pavements. • Determine the effects on pavement distress and performance of 1) loading, 2)
environment, 3) material properties and variability, 4) construction quality, and 5) maintenance levels.
• Determine specific design procedures to improve pavement performance.
• Establish a National Pavement Performnace Database (NPPDB) to support these objectives and future needs.
After five years of data had been collected from the test sections through December, 1992, an SHRP research project was conducted to evaluate the AASHTO design equations.44 The
42
SHRP Product Catalog. Strategic Highway Research Program. National Research Council, Washington, D.C.,
1992 (Foreword).
43 Hadley, p. 5.
44
Jerome F. Daleiden, J. Brent Rauhut, Brian Killingsworth, Emmanuel Owusu Antwi, Michael I. Darter, and Riaz Ahmad, Evaluation of the AASHTO Design Equations and Recommended Improvements. Strategic Highway
evaluation was conducted by analyzing the relationship between pavement performance in the field tests to the pavement performance predicted by the AASHTO design equations. Included in the evaluation were 244 sections of asphalt pavement and 120 sections of concrete pavement. The concrete sections consisted of unreinforced jointed concrete pavement, reinforced jointed concrete pavement, and continuously reinforced concrete pavement.
Based on reductions in serviceability in the test sections over the five-year period and based on the test section pavement cross section, the researchers used the AASHTO design equations to predict the number of ESALs the pavement received. In other words, the AASHTO equations were used to predict the number ofESALs required to cause the observed loss in serviceability.
If the AASHTO equations were accurate, then the predicted ESALs and the observed ESALs would be identical or nearly the same.
When the comparison was made for the predicted ESALs for asphalt pavement (using the AASHTO design equations) versus the observed traffic, the traffic predicted by the AASHTO equations consistently provided predictions which were much higher than estimates made from historical traffic records: This means that the pavements were wearing out faster than planned through the design equations. Only nine of the 244 traffic volumes predicted with the AASHTO equations were lower than the estimates of traffic made from historical information. 45
Almost half of the predicted traffic levels were more than one hundred times the estimated traffic volumes. Although the extreme lack of correlation between the ESALs predicted with the AASHTO equations and the in-service data may be largely due to the shortcomings of the AASHTO equations, it is also partly due to the data limitation. For example, it was difficult to estimate the level of traffic exposure to pavement test sections which were in service prior to the test or the condition of these sections at the time of construction. In addition, the original AASHO road tests, the basis of the AASHTO equations, were continued until the pavements completely failed. None of the test sections experienced this level of exposure.
When trying to explain the differences in predicted versus estimated traffic, the researchers developed a regression equation where the dependent variable was the ratio of the predicted ESALs, using the AASHTO design equation, to the estimated ESALs based on historical
information. The regression resulted in a relatively good fit between the regression equation and the dependent variable, and 77 percent of the dependent variable variance was accounted for in the regression equation (R-squared = 0.77). The independent variables included in the model were the average annual rain fall, the average annual number of days below freezing, subgrade modulus (a measure of soil strength), serviceability loss, structural number (a measure of the strength of combined pavement layers), and the thickness of the existing seal coats. The
researchers felt that the results indicate the importance of environmental variables which are not adequately taken into account in the AASHTO design equations.
Similar comparisons were made for the concrete test sections where the predicted number of ESALs, based on the AASHTO design equations, were compared to the historical estimate of the
Research Program, National Research Council, Washington, D.C., 1994.
45
Jerome F. Daleiden, et al., p. 35.