SQMD: Architecture for Scalable, Distributed
Database System built on Virtual Private Servers
Kangseok Kim1, Rajarshi Guha3, Marlon E. Pierce1, Geoffrey C. Fox1, 2, 3, 4,
David J. Wild3, Kevin E. Gilbert3
1Community Grids Laboratory, Indiana University, Bloomington, IN 47404, USA
2Department of Computer Science, Indiana University, Bloomington, IN 47404, USA
3School of Informatics, Indiana University, Bloomington, IN 47404, USA
4Physics Department, College of Arts and Sciences, Indiana University, IN 47404, USA
{kakim, rguha, marpierc, gcf, djwild, gilbert}@indiana.edu
Abstract
— Many scientific fields routinely generate huge datasets. In many cases, these datasets are not static but rapidly grow in size. Handling these types of datasets, as well as allowing sophisticated queries necessitates efficient distributed database systems. In this paper we present the architecture, implementation and performance analysis of a scalable, distributed database system built on software based virtualization environments. The system architecture makes use of a software partitioning of the database based on data clustering, SQMD (Single Query Multiple Database) mechanism, a web service interface, and virtualization software technologies. The system allows uniform access to concurrently distributed databases, using the SQMD mechanism based on the publish/subscribe paradigm. We highlight the scalability of our architecture by applying it to a database of 17 million chemical structures. In addition to simple identifier based retrieval, we will present performance results for shape similarity queries, which is extremely, time intensive with traditional architectures.1. INTRODUCTION
In the last few years, we have witnessed a huge increase in the size of datasets in a variety of fields (scientific observations for e-Science, local (video, environmental) sensors, data fetched from Internet defining users interests, and so on [23, 28]). This trend is expected to continue and future datasets will only become larger. Given this deluge of data, there is an urgent need for technologies that will allow efficient and effective processing of huge datasets. With the maturation of a variety of computing paradigms such as grid computing, mobile computing, and pervasive computing, and with the resurgence of a variety of virtualization technologies such as OpenVZ [21], we can now start addressing the problem of allowing geographically dispersed users to access resources in efficient manner and to simultaneously use applications running on heterogeneous virtual platforms on a machine in anytime and anywhere.
The problems of effectively partitioning a huge dataset and of efficiently alleviating too much computing for the processing of the partitioned data have been critical factor for scalability and performance. In today’s data deluge the problems are
becoming common and will become more common in near future. The principle “Make common case fast” [19] (or
“Amdahl’s law” which is the quantification of the principle) can be applied to make the common case faster since the impact on making the common case faster may be higher, while the principle generally applies for the design of computer architecture.
Our scalable, distributed database system architecture is composed of three tiers – a web service client (front-end), a web service and message service system (middleware), and finally agents and a collection of databases (back-end). To achieve scalability and maintain high performance, we have developed a distributed database system on virtual private servers. The databases are distributed over multiple virtual private servers by fragmenting the data using two different methods: data clustering and horizontal partitioning to increase the molecule shape similarity and to decrease the query processing time. The distributed nature of the databases is transparent to end-users and thus the end-users are unaware of data fragmentation and distribution. The middleware hides the details about the data distribution. To support efficient queries, we used a Single Query Multiple Database (SQMD) mechanism which transmits a single query that simultaneously operates on multiple databases, using a publish/subscribe paradigm. A single query request from end-user is disseminated to all the databases via middleware and agents, and the same query is executed simultaneously by all the databases. The web service component of the middleware carries out a serial aggregation of the responses from the individual databases. Fundamentally, our goal is to allow high performance interaction between users and huge datasets by building a scalable, distributed database system using virtualization technology. In this paper we focus on the issue of data scalability with our software architecture and virtualization technology while leaving the rest for future work – query optimization, localization, SQSD (Single Query Specific Databases), and so on.
a case study for our architecture. Section 6 presents experimental results to demonstrate the viability of our distributed database system. Finally we conclude with a brief discussion of future work and summarize our findings.
2. PROBLEM STATEMENT
With the advances in a variety of software/hardware technologies and wire/wireless networking, coupled with large end-user populations, traditionally tightly-coupled client-server systems have evolved to loosely-coupled three-tier systems as a solution for scalability and performance. The workload of the server in two-tier system has been offloaded into the middleware in three-tier system in considering bottlenecks incurred from: increased number of service requests/responses, increased size of service payload, and so on. Also with the explosion of information and data, and the rapid evolution of Internet, centralized data have been distributed into locally or geographically dispersed sites in considering such bottleneck as increased workload of database servers. But in today’s data deluge, too much computing for the processing of too much data leads to the necessity of effective data fragmentation and efficient service processing task. For instance, as the size of data increases, the response time of database server will increase by its increasing workload. One solution to the problem is to effectively partition large databases into smaller databases. The individual databases can then be distributed over a network of virtual private servers which is a method of partitioning a physical server on a machine into multiple servers [30]. The partitioning of the database over virtual private servers can be a critical factor for scalability and performance. The purpose of the virtual private servers’ use is to facilitate concurrent access to individual applications (databases) residing on multiple virtual platforms on a single or multiple physical machines with effective resources’ use and management, as compared to an application (database) on a physical machine. We have already encountered the scalability problems with a single huge dataset – a collection of 3D chemical structures [7] during our research work. We believe that the architecture described in Section 4 will allow for effective data fragmentation and efficient service processing resulting in a scalable solution.
3. RELATED WORK
The middleware in a three-tier distributed database system also has a number of bottlenecks with respect to scalability. We do not address the scalability issues for middleware in this paper since our system can be scaled well in size by a cluster (or network) of cooperating brokers [1, 15]. In this paper we focus on the issue related on data scalability. For data scalability, other researchers showed a database can be scaled across locally or geographically dispersed sites by using such fragmentation methods as vertical partitioning, horizontal partitioning, heuristic GFF (Greedy with First-Fit) [11], hash partitioning [6], range/list/hash partitioning [16], and so on. On the other hand, we address the problem of partitioning a database over virtual private servers, based on data clustering such that intra-cluster similarity (using the Euclidean metric) is greater than inter-cluster similarity. The use of data inter-clustering in general has been explored in the field of data mining. We performed the clustering using algorithms developed by the SALSA project [23] at the CGL [9]. The details of the clustering method are described in [33]. Also in our work we utilized virtual private servers into which a physical server on a machine is partitioned such that each has the capabilities of running on its own dedicated machine, with OpenVZ software based virtualization technology [21]. The utilization of the virtualization technology to aid data scalability was not addressed yet. A necessity for building new large-scale distributed database system through hardware or architectural design has resurged from scalability and performance concerns against coming data deluge – Google’s BigTable [12], Facebook’s Cassandra [5] and so on. Our architecture is similar in concept to that of SIMD (Single Instruction stream, Multiple Data stream) [29], in that a single unit dispatches instructions to each processing unit. The SMMV (Single Model Multiple Views) collaboration model (to build applications as web services in M-MVC (Message-based Model-View-Controller) architecture) which generalizes the concept of SIMD is used for collaborative applications such as shared display [13]. The difference between SQMD and SMMV is direct communication between front-end (or view) and back-end (or model). In the SQMD architecture, the front-end always communicates with back-end through middleware (or controller), where the view in the SMMV architecture can communicate directly with the model. Therefore the back-ends (or distributed databases) are transparent to the front-ends (or end-users) in SQMD. The SQMD uses the data parallelism in a manner similar to that of SIMD, via a publish/subscribe mechanism. In this paper we discuss data scalability in the distributed database system with the software architecture and virtualization technology, using a collection of more 17 million 3D chemical structures.
4. ARCHITECTURE FOR SCALABLE DISTRIBUTED DATABASE SYSTEM BUILT ON VIRTUAL PRIVATE SERVERS
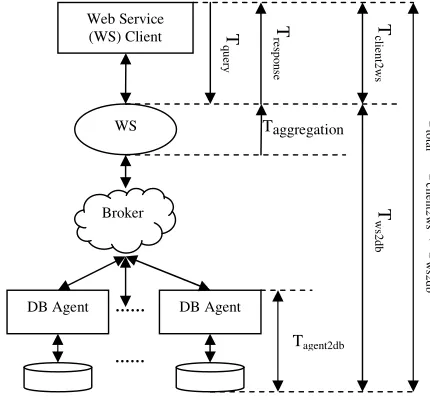
Figure 1 shows a broad 3-tier architecture view for our scalable distributed database system. The scalable, distributed database system architecture is composed of three tiers – the web service client (front-end), a web service and message service system (middleware), agents and a collection of databases (back-end). The virtualization environments based on OpenVZ [21] and software (with web service, SQMD using publish/subscribe mechanism, and data clustering program) architecture concentrate on increasing scalability with increased size of distributed data, providing high performance service with the enhancement of query/response interaction time, and improving data locality.
message and service system interacts with a web service which is another service component of the middleware, and database agents. The web service acts as query service manager and result aggregating service manager for heterogeneous web service clients. The database agent acts as a proxy for database server. We describe them in each aspect in the following subsections.
Figure 1: Scalable, distributed database system architecture is composed of three tiers: web service client (front-end), web service and broker (middleware), and agents and a collection of databases (back-end).
4.1. Web Service
A web service is a software platform to build applications running on a variety of platforms as services [31]. The communication interface for web service is described by XML that follows SOAP (Simple Object Access Protocol) standard [24]. Other heterogeneous systems can interact with the web service through a set of descriptive operations using SOAP. For web services we used the open-source Apache Axis [2] library which is an implementation of the SOAP specification. Also we used WSDL (Web Service Description Language) [32] to describe our web service operations. A web service client reads WSDL to determine what functions are available for database service: one service is query request service and the other is reliable service which detects whether database servers fail.
4.2. Web Service Client (front-end)
Web service clients can simultaneously access (or query) the data in several databases in a distributed environment. Query requests from clients are transmitted to the web service, disseminated through the message and service system to database servers via database agents. The well known benefits of the three-tier architecture results in the web service clients do not need to know about the individual distributed database servers, but rather, send query requests to a single web service that handles query transfer and response.
4.3. Message and service middleware system
For communication service between the web service and middleware, and the middleware and database agents, we have used NaradaBrokering [20, 25] for message and service middleware system as overlay built over heterogeneous networks to support group communications among heterogeneous communities and collaborative applications. The NaradaBrokering from Community Grids Lab (CGL) [9] is adapted as a general event brokering middleware, which supports publish/subscribe messaging model with a dynamic collection of brokers and provides services for TCP, UDP, Multicast, SSL, and raw RTP clients. The NaradaBrokering also provides the capability of the communication through firewalls and proxies. It is an open source and can operate either in a client-server mode like JMS [17] or in a completely distributed peer-to-peer mode [27]. In this paper we use the terms “message and service middleware (or system)” and “broker” interchangeably.
……
…… …… Topics:
1. Query / Response 2. Heart-beat
Web Server
Query / Response Query / Response
Query / Response
Query / Response Query / Response
Web Service Client (Front-end User Interface)
Web Service
Message Service
Message / Service System (Broker)
Database Agent (JDBC to PostgreSQL)
DB Host Server
Database Agent (JDBC to PostgreSQL)
4.4. Database Agent
In Figure 1, the database agent (DBA) is used as a proxy for database server (PostgreSQL). The DBA accepts query requests from front-end users via middleware, translates the requests to be understood by database server and retrieves the results from the database server. The retrieved results are presented (published) to the requesting front-end user via message / service system (broker) and web service. Web service clients interact with the DBA via middleware, and then the agent communicates with PostgreSQL database server. The agent has responsibility for getting responses from the database server and performs any necessary concatenations of responses occurred from database for the aggregating operation of the web service. As an intermediary between middleware and back-end (database server), the agent retains communication interfaces (publish/subscribe) and thus can offload some computational needs.
4.5. Database Server
A number of data partitions split by data clustering or horizontal partitioning method are distributed into PostgreSQL database servers. Another benefit of database servers based on the three-tier architecture is that they do not concern about a large number of heterogeneous web service clients but need to only process queries and return results of the queries. We used the open source database management system PostgreSQL [22]. With such an approach using open management system, we can build a sustainable high functionality system taking advantage of the latest system technologies with appropriate interface between layers (agents and database host servers) in a modular fashion.
5. PUBCHEM
PubChem is a public repository of chemical information including connection tables, properties and biological assay results. The repository can be accessed in a variety of ways including property-based searches and substructure searches. However, one aspect of chemical structure that is not currently addressed by PubChem is the issue of 3D structures. Given a set of 3D structures one would then like to be able to search these structures for molecules whose 3D shape is similar to that of a query. To address the lack of 3D information in PubChem and to provide 3D shape searching capabilities we created the Pub3D database.
5.1. Pub3D Database
Creating a 3D structure version of the PubChem repository requires a number of components. First, one must have an algorithm to generate 3D structures from the 2D connection table. We developed an in-house tool to perform this conversion and have made the program freely available [26]. Second, one must have an efficient way to store the 3D coordinates and associated information. For this purpose, we employ a PostgreSQL database. Third, one must be able to perform 3D searches that retrieve molecules whose shape is similar to that of a query molecule. This is dependent on the nature of shape representation as well as the type of index employed to allow efficient queries. We employ a 12-D shape representation coupled with an R-tree [14] spatial index to allow efficient queries. The current version of Pub3D stores a single 3D structure for a given compound.
5.2. Storing 3D Structure
Each 3D structure is stored in the SD file format [10], which lists the 3D coordinates as well as bonding information. We then store the 3D structure files in a PostgreSQL database as a text field. We store the 3D structure file simply for retrieval purposes and do not perform any calculations on the contents of the file within the database. In addition to storing the 3D coordinates, we store the PubChem compound ID (cid), which is a unique numeric identifier provided by PubChem, which we use as a primary key. The remaining field (momsim) is a 12-D CUBE field. The CUBE data type provided by PostgreSQL is used to represent n-D hypercubes. We use this data type to store a reduced description of the shape of the molecule. More specifically, we employ the distance moment method [4] which characterizes the molecular shape by evaluating the first three statistical moments of the distribution of distances between atomic coordinates and four specified points, resulting in 12 descriptors characterizing a molecules shape. Thus, each molecule can be considered as a point in a 12-D shape space.
5.3. Searching the 3D Database
6. PERFORMANCE ANALYSIS
In Section 4 we showed the architecture of our distributed database system. In this section we show experimental results to demonstrate the viability of our virtualization/software architectural approach with a variety of performance measurements. First, we show the latency incurred from query/response interaction between a web service client and a centralized Pub3D database via a middleware and an agent. Then we show the viability of our architectural approach to support efficient query processing in time among distributed databases into which the Pub3D database is split, with horizontal partitioning method and data clustering method respectively. The horizontal partitioning method in our experiments was chosen due to such convenience factors as easy-to-split and easy-to-use. In our experiments we used the example query shown in Figure 2 as a function of the distance R from 0.3 to 0.7. The choice of the distance R between 0.3 and 0.7 was due to excessively small size of the result sets (0 hits for R=0.1 and 2 hits for R=0.2) for small values of R and the very large result sets, which exceeded the memory capacity (for the aggregation web service running on Windows XP platform with 2 GB RAM) caused by the large numbers of responses in the values bigger than 0.7. Table 1 shows the total number of hits for varying R, using the query of Figure 2. In Section 6.1 we show overhead timing considerations incurred from processing a query in our distributed database system. In Section 6.2 we show the performance results for query processing task in a centralized (not fragmented) database. In Section 6.3 we show the performance of a query/response interaction mechanism between a client and distributed databases. The query/response interaction mechanism is based on SQMD using publish/subscribe mechanism. A web service client’s single query request is disseminated to all the databases via a broker and agents. The same query is executed simultaneously by all the distributed databases. An operation for serially aggregating responses from all the databases is performed in web service component of middleware. The aggregated result is transmitted to the request client.
Figure 2: An example query used in our experiment, varying R from 0.3 to 0.7, where the R means some distance cutoff to retrieve those points from the database whose distance to the query point.
R 0.3 0.4 0.5 0.6 0.7
N 495 6,870 37,049 113,123 247,171
Size in bytes 80,837 1,121,181 6,043,337 18,447,438 40,302,297 Table 1: The total number of response data (N) occurred with varying the distance R in the query of Figure 2.
6.1. Overhead timing considerations
Figure 3 shows a breakdown of the latency for processing SQMD operation between a client and databases in our distributed database system which is a network of eight PostgreSQL database servers that reside on eight physical machines or eight virtual private servers on a machine. The cost in time to access data from the distributed databases has four primary overheads. The total latency is the sum of transit cost and web service cost.
• Transit cost (Tclient2ws) – The time to transmit a query (Tquery) to and receive a response (Tresponse) from the web service
running on web server.
• Web service cost (Tws2db) – The time between transmitting a query from a web service component to all the databases
through a broker and agents and retrieving the query responses from all the databases including the corresponding execution times of the middleware and agents.
• Aggregation (Taggregation) cost – The time spent in the web service for serially aggregating responses from databases.
• Database agent service cost (Tagent2db) – The time between submitting a query from an agent to and retrieving the responses
of the query from a database server including the
6.2. Performance for query processing task in a centralized (not fragmented) database
In this section we show the performance results of latency incurred from processing a query between a web service client and a centralized (not fragmented) database. Note that the results are not to show better performance enhancement but to quantify the performance for a variety of latencies induced with the centralized database. The quantified results will be used as a reference of the experimental results of the performance measurements used in the following section. In our experiments, we measured the round trip time in latency involved in performing queries (accessing data) between a web service client and database host servers via middleware (web service and broker) and database agents. The experiment results were measured from executing a web service client running on Windows XP platform with 3.40 GHz Intel Pentium and 1 GB RAM connected to Ethernet network, and executing a web service and a broker running on Windows XP platform with 3.40 GHz Intel Pentium and 2 GB RAM connected to Ethernet network. In case of using eight machines, agents and database servers ran on each of eight 2.33 GHz Linux with 8 core / 8 GB RAM connected to Ethernet network. In case of using eight virtual private servers, agents and database servers ran on each of eight virtual private servers on a 2.33 GHz Linux with 8 core / 8 GB RAM connected
to Ethernet network as well. The client, middleware, agents, and database servers are located in Community Grids Lab at Indiana University. Figure 4 show the mean completion time to transmit a query and to receive a response between a web service client and a database host server including the corresponding execution time of a middleware (web service and broker) and an agent, varying the distance R described in section 5.3. As the distance R increases, the size of result set also increases, as shown in Table 1. Therefore as the distance R increases, the time needed to perform a query in the database increases as well, which is shown in the figure and thus the query processing cost clearly becomes the biggest portion of the total cost. We
can reduce the total cost by making the primary performance degrading factor (query processing cost (Tagent2db)) faster. To
[image:6.612.71.286.158.359.2]make the primary degrading factor (or frequent case in today’s data deluge) faster, the result which motivated our research work will be used as a baseline for the speedup measurement of the experiments performed in the following section.
Figure 3: Total latency (Ttotal) = Transit cost (Tclient2ws) +
Web service cost (Tws2db)
Mean query response time in a centralized (not fragmented) database
0 5000 10000 15000 20000 25000 30000
0.3 0.4 0.5 0.6 0.7
Distance R M e a n t im e in m ill is e c o n d s
Netw ork cost Aggregation cost Query processing cost
Figure 4: Mean query response time between a web service client and a centralized database host server including the corresponding execution time of a middleware and an agent, varying the distance R.
6.3. Performance for query processing task in distributed databases (Data clustering vs. Horizontal partitioning) over
database servers (on 8 physical machines vs. on 8 virtual private servers on a machine)
The Pub3D database is split into eight separate partitions by horizontal partitioning method and data clustering method respectively. Each of partitions is distributed across eight physical machines. The partitions are also distributed across eight virtual private servers on a machine. Table 2 shows the partitioned data size in number by data clustering method. Note that the data partitioned by horizontal partitioning method have almost the same size (about 2,154,000) in number.
Examining overhead costs and total cost, we measured the mean overhead cost for 100 query requests in our distributed database system. For measuring the overhead costs, we tested four different cases with two different partitioning methods: data clustering vs. horizontal partitioning and with two different environments: eight physical machines vs. eight virtual private servers on a machine, varying the distance R in the example query which is shown in Figure 2. The results are shown in Figure 7, 8, 9, and 10 with the mean completion time of a query request in the considerations of overhead timings between a client and databases. By comparing the total costs for the four different cases with the total cost incurred from a centralized database system, we computed the speedup (similar to Amdahl’s Law) gained by the distribution of data in our distributed
database system: Speedup = Ttotal (1db) / Ttotal (8db) = (Tclient2ws (1db) + Tws2db (1db)) / (Tclient2ws (8db) + Tws2db (8db)) -- (1)
= 1 / ((1 – (Tagent2db (1db) / Ttotal (1db))) + ((Tagent2db (1db) / Ttotal (1db)) / (Tagent2db (1db) / Tagent2db (8db)))) -- (2)
where (1db) means a centralized database and (8db) means a distributed database.
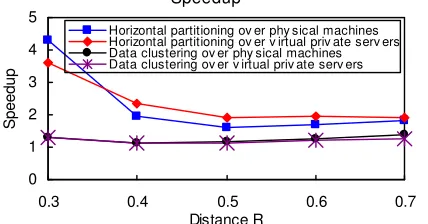
(1) means the value of speedup is the mean query response time in a centralized database system over the mean query response time in a distributed database system. (2) means the speedup gained by incorporating the un-enhanced and enhanced portions respectively. Figure 5 shows the overall speedup obtained by applying (1) to the test cases respectively. For brevity we explain the overall speedup with the distance 0.5 as an example. In case of using horizontal partitioning over virtual private servers, the overall speedup by (1) is 1.91. The speedup by (2) is 1.96. This means some additional overheads were incurred during the query/response. We measured the duration between first and last response messages from agents, and that between first and last response messages arriving into web service component in middleware for global aggregation of responses. As expected, there was a difference between the durations. The difference is due to network overhead between web service
T q u er y T re sp o n se T cl ie n t2 w s T w s2 d b Taggregation Tagent2db …… …… Web Service (WS) Client WS Broker
DB Agent DB Agent
T
to
ta
l =
T c lie n t2 w
s +
T
w
s2
d
[image:6.612.326.536.163.310.2]component and agents, and the global aggregation operation overhead in web service that degrades the performance of the system since the web service has to wait, blocking the return of the response to a query request client until all database servers send the response messages. From the results with the example query in our distributed database system, using horizontal partitioning is faster than using data clustering since fragments partitioned by the data clustering method can be different in the number of dataset as shown in Table 2. Then obviously as the responses occurred in performing a query in a large size of cluster increase, the time needed to perform the query in the cluster increases as well, which is shown in Table 3 and the graph in Figure 6. In other words the total active (hash) index set for the query increases as the distance R increase. To avoid as much disk access as possible and thus to improve the query processing performance, the total index set is needed to fit in main memory. In our experiment with virtual private servers, in case of using data clustering method, we allocated the memory into each virtual server in proportion to the size of each cluster, while in case of using horizontal partitioning method we allocated the memory into each server in same size. With such a memory resource configuration in OpenVZ virtualization environment, our experiments indicate more memory has to be allocated into each virtual private server to easily fit more index set in main memory when the distance R increases as shown in Figure 5. The results of experiments with our distributed system indicate the performance in using virtual private servers on a machine is comparable to that in using eight physical machines. The purpose of data clustering’s use is to increase shape similarity and thus to speed the query processing up by fitting active indexes into memory. In our system the purpose of the virtual private servers’ use is to efficiently facilitate concurrent access to individual databases residing on multiple virtual platforms on a single or multiple physical machines with effective resources’ use and management, as compared to a database on a physical machine. In future work we should consider how the performance overheads are impacted by different configurations for other resources as well as memory for more efficient query processing in the virtualization environment. While the query processing cost increases as the distance R increases, the cost becomes a smaller portion of overall cost than the transit cost in the distribution of data as shown in Figure 8 and 10. This result shows our distributed database system is scalable with the partitioning of database over virtual private servers as well as physical machines, and thus the system improves overall performance as well as query processing performance.
Segment number
1 2 3 4 5 6 7 8
[image:7.612.55.556.305.459.2]Size in number 6,204,776 616,133 507,209 2,018,281 2,302,272 4,634,860 785,232 163,017
Table 2: The data size (in number) in the fragmentations into which the Pub3D database is split by clustering method.
S R
1 2 3 4 5 6 7 8
0.3 1 0 0 0 494 0 0 0
0.4 87 0 30 0 6,753 0 0 0
0.5 1,868 0 570 0 34,611 0 0 0
0.6 12,926 0 2,720 0 97,477 0 0 0
D
0.7 44,388 0 6,571 0 196,212 0 0 0
0.3 75 82 77 62 45 27 49 78
0.4 863 1,133 978 893 667 498 780 1,058
0.5 4,667 5,686 5,279 4,746 3,615 3,031 4,361 5,664
0.6 14,089 16,749 15,782 14,650 11,369 9,756 13,559 17,169
H
[image:7.612.322.530.504.642.2]0.7 30,920 35,558 33,862 32,277 25,207 22,268 29,620 37,459
Table 3: The number of responses in segments occurred with varying the distance R, where S, D, and H mean segment number, data clustering, and horizontal partitioning respectively.
Speedup
0 1 2 3 4 5
0.3 0.4 0.5 0.6 0.7
Distance R
S
p
e
e
d
u
p
Horizontal partitioning ov er phy sical machines Horizontal partitioning ov er v irtual priv ate serv ers Data clustering ov er phy sical machines Data clustering ov er v irtual priv ate serv ers
Figure 5: The value of speedup is the mean query response time in a centralized database system over the mean query response time in a distributed database system.
Mean query processing time in each cluster (Tagent2db) (R = 0.5)
0 500 1000 1500 2000 2500
1 2 3 4 5 6 7 8
Cluster number
M
e
a
n
t
im
e
in
m
ill
is
e
c
o
n
d
s Data clustering ov er phy sical machines
Data Clustering ov er v ps
Horizontal partitioning ov er phy sical machines Horizontal Partitioning ov er v ps
Figure 6: Mean query processing time in each cluster
[image:7.612.71.285.506.618.2]Mean query response time by data clustering over physical machines
0 5000 10000 15000 20000 25000
0.3 0.4 0.5 0.6 0.7
Distance R M e a n t im e i n m il li s e c o n d
s Netw ork cost
Aggregation cost Query processing cost
Figure 7: Mean query response time between a web service client and databases distributed by data clustering.
Mean query response time by horizontal partitioning over physical
machines
0 5000 10000 15000
0.3 0.4 0.5 0.6 0.7
Distance R M e a n t im e i n m il li s e c o n d
s Netw ork cost
Aggregation cost Query processing cost
Figure 8: Mean query response time between a web service client and databases distributed by horizontal partitioning.
Mean query response time by data clustering over virtual private servers
0 5000 10000 15000 20000 25000
0.3 0.4 0.5 0.6 0.7
Distance R M e a n t im e i n m il li s e c o n d
s Netw ork cost
Aggregation cost Query processing cost
Figure 9: Mean query response time between a web service client and databases distributed by data clustering.
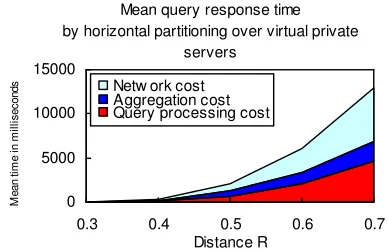
Mean query response time by horizontal partitioning over virtual private
servers
0 5000 10000 15000
0.3 0.4 0.5 0.6 0.7
Distance R M e a n t im e i n m il li s e c o n d
s Netw ork cost
Aggregation cost Query processing cost
Figure 10: Mean query response time between a web service client and databases distributed by horizontal partitioning.
7. SUMMARY AND FUTURE WORK
[image:8.612.329.520.72.188.2] [image:8.612.68.265.73.184.2] [image:8.612.80.271.231.365.2] [image:8.612.326.520.235.361.2]we will extend the Pub3D database to the multi-conformer version. Inclusion of multiple conformers will increase the row count by at least an order of magnitude. We expect that our architectural design will scale well to such row counts.
REFERENCES
[1] Ahmet Uyar, Wenjun Wu, Hasan Bulut, Geoffrey Fox. Service-Oriented Architecture for Building a Scalable
Videoconferencing System March 25 2006 to appear in book "Service-Oriented Architecture - Concepts & Cases" published by Institute of Chartered Financial Analysts of India (ICFAI) University.
[2] Apache Axis, http://ws.apache.org/axis
[3] Apache Axis2, http://ws.apache.org/axis2/
[4] Ballester, P.J., Graham-Richards, W., J. Comp. Chem., 2007, 28, 1711-1723.
[5] Cassandra project, http://code.google.com/p/the-cassandra-project/
[6] Chaitanya K. Baru, Gilles Fecteau, Ambuj Goyal, Hui-I Hsiao, Anant Jhingran, Sriram Padmanabhan, George P. Copeland,
Walter G. Wilson. DB2 Parallel Edition. IBM System Journal, Volume 34, pp 292-322, 1995.
[7] Chembiogrid (Chemical Informatics and Cyberinfrastructure Collaboratory),
http://www.chembiogrid.org/wiki/index.php/Main_Page
[8] Ciaccia, P., Patella, M., Zezula, P., Proc. 23rd Intl. Conf. VLDB, 1997.
[9] Community Grids Lab (CGL), http://communitygrids.iu.edu
[10] Dalby, A., Nourse, J., Hounshell, W., Gushurst, A., Grier, D., Leland, B., Laufer, J., J. Chem. Inf. Comput. Sci., 1992, 32,
244-255.
[11] Domenico Sacca and Gio Wiederhold. Database Partitioning in a Cluster of Processors. ACM Transaction on Database
System, Vol. 10, No. 1, March 1985, Pages 29-56.
[12] Fay Chang, et al. Bigtable: A Distributed Storage System for Structured Data. OSDI'06: Seventh Symposium on Operating
System Design and Implementation, Seattle, WA, November, 2006.
[13] Geoffrey Fox. Collaboration and Community Grids Special Session VI: Collaboration and Community Grids
Proceedings of IEEE 2006 International Symposium on Collaborative Technologies and Systems CTS 2006 conference Las Vegas May 14-17 2006; IEEE Computer Society, Ed: Smari, Waleed & McQuay, William, pp 419-428. ISBN 0-9785699-0-3 DOI.
[14] Guttman, A., ACM SIGMOD, 1984, 47-57.
[15] Harshawardhan Gadgil, Geoffrey Fox, Shrideep Pallickara and Marlon Pierce. Managing Grid Messaging Middleware
Proceedings of IEEE Conference on the Challenges of Large Applications in Distributed Environments (CLADE) Paris France June 19 2006, pp. 83 – 91.
[16] Hermann Baer. Partitioning in Oracle Database 11g. An Oracle White Paper June 2007.
[17] Java Message Service (JMS), http://java.sun.com/products/jms
[18] Jeffrey Dean and Sanjay Ghemawat. MapReduce: Simplified Data Processing on Large Clusters. OSDI'04: Sixth
Symposium on Operating System Design and Implementation, San Francisco, CA, December, 2004.
[19] John L. Hennessy and David A. Patterson. Computer Architecture: A Quantitative Approach 2nd Edition. Morgan
Kaufmann
[20] NaradaBrokering, http://www.naradabrokering.org
[21] OpenVZ,http://wiki.openvz.org/Main_Page
[22] PostgreSQL, http://www.postgresql.org/
[23] SALSA (Service Aggregated Linked Sequential Activities), http://www.infomall.org/salsa
[24] Simple Object Access Protocol (SOAP), http://www.w3.org/TR/soap12-part1/
[25] Shrideep Pallickara, et al. On the Discovery of Topics in Distributed Publish/Subscribe systems Proceedings of the
IEEE/ACM GRID 2005 Workshop, pp 25-32. November 13-14 2005 Seattle, WA.
[26] Smi23d – 3D Coordinate Generation. http://www.chembiogrid.org/cheminfo/smi23d/
[27] Sun Microsystems JXTA Peer to Peer Technology, http://www.jxta.org
[28] Tony Hey and Anne Trefethen, The data deluge: an e-Science perspective in “Grid Computing: Making the Global
Infrastructure a Reality” edited by Fran Berman, Geoffrey Fox and Tony Hey, John Wiley & Sons, Chicester, England, ISBN 0-470-85319-0, February 2003.
[29] Vipin Kumar, Ananth Grama, Anshul Gupta, and George Karypis. Instruction to Parallel Computing: Design and
Analysis of Algorithms.
[30] Virtual Private Server,http://en.wikipedia.org/wiki/Virtual_private_server
[31] Web Service Architecture, http://www.w3.org/TR/ws-arch/
[32] WSDL (Web Service Description Language), http://www.w3.org/TR/wsdl
[33] Xiaohong Qiu, Geoffrey Fox, H. Yuan, Seung-Hee Bae, George Chrysanthakopoulos, Henrik Frystyk Nielsen. High