International Journal of Innovative Technology and Exploring Engineering (IJITEE) ISSN: 2278-3075, Volume-8 Issue-7, May, 2019
Abstract: In this paper, we investigate the feasibility of crease features from interdigital and hypothenar regions of palmprint image to identify race of individual. The classification is done by means of deep learning architecture known as convolutional neural network (CNN). In this research, two square region of interests (ROIs) have been used, corresponding to interdigital and hypothenar regions, as the input data for the CNN classifier. Three sizes of input data have been used. Experiments to select suitable CNN parameters have also been carried out. These parameters are the number of training epoch, activation function, and data augmentation. Results obtained through a four-fold cross validation have shown that variation of input data size would deviate computational complexity and classification performance of the CNN classifier. Besides that, fine tuning on CNN parameters and data augmentation could induce positive effect on classification.
Index Terms: Artificial intelligent, biometrics, convolutional neural network, identification, machine learning, palmprint, race identification.
I. INTRODUCTION
Fast identification of the suspect or victim from the crime scene is important for forensics. An individual can be recognized based on biological traits, such as from palmprint, by using biometric algorithms. Biometrics-based system enables individual identification within reasonably short period of time, if provided with input of the person’s biological, morphological or behavioral traits [1,2]. In recent time, implementation of machine learning technique in biometric application field has attracted increasingly attentions. By performing feature extraction on characteristic traits, key biometric feature can be utilized to train a classification model capable to identify and represent complex input data patterns [3]. However, as the palmprint image obtained from the crime scene may be damaged and not a complete palmprint, identification of the person might be inaccurate using this data. This incomplete data may still be used for higher level identification, such as identification of the race of that person.
Among hand biometrics, palmprint is incorporated with
Revised Manuscript Received on May 06, 2019
Roszaharah Yaacob, Helmi Hadi, and Nik Fakhuruddin Nik Hassan, School of Health Sciences, Health Campus, Universiti Sains Malaysia, 16150 Kubang Kerian, Kelantan, Malaysia.
Chok Dong Ooi, Seng Chun Hoo, and Haidi Ibrahim, School of Electrical and Electronic Engineering, Engineering Campus, 14300 Nibong Tebal, Pulau Pinang, Malaysia.
[image:1.595.324.532.359.478.2]more features with its larger surface [4]. Most features extracted from palmprint remains permanent throughout an individual lifespan, and every individual has unique pattern of their own as every palmprint differs from one another [5]. Features that can be extracted from palmprint modality are comprised of crease features, point features and texture features [6]. Palm region could be partitioned into several major regions by creases. Fig. 1 illustrates how creases divides palmprints into three distinct regions, which are hypothenar region, thenar region and interdigital region.
Fig. 1 Regions of palmprint, consisting of interdigital, hypothenar, and thenar region.
Among these palmprint features, this research will be focused on crease feature, which is represented by discontinuities in the epidermal ridge patterns [7]. Crease features can be observed even from a low-resolution image and therefore it has attracted attention from researchers in biometric recognition field. This special salient feature found in palmprint started to develop since gestation age [8]. Machine learning is used extensively in the field of biometric application. Feature extraction is done on characteristic traits to obtain biometric features, which are then used for training process of the system with machine learning [3]. The trained model utilizing machine learning technology will provide prudent outcome through perception of complex patterns. However, the accuracy of this learning process is crucial and need to be analyzed using multiple sets of test data [9]. As biometric recognition system based on hand palm pattern is not widespread compared to other biometric methods, such as iris,
Classification of Crease Features from
Interdigital and Hypothenar Regions of
Palmprint Image for Race Identification using
Convolutional Neural Network
fingerprint or face recognition, there are much potential yet to be explored in terms of reliability. Like fingerprint, palm print has high discriminative property too. Acquisition of palm print is less burdensome compared with other biometric traits such as iris and retina [3].
Most of the existing works are targeted on examination on principle lines that exist in palmprint, instead of using the significant whole portion of palmprint. This is because principle lines are genetically deterministic while crease features are not [10]. Since these non-genetically dependent crease features are still incorporated with useful information, this project will utilize mainly on crease features, located on the hypothenar and interdigital region of human palmprint. This project aims to research on application of machine learning, on hand palm based biometric method.
II. METHODOLOGY
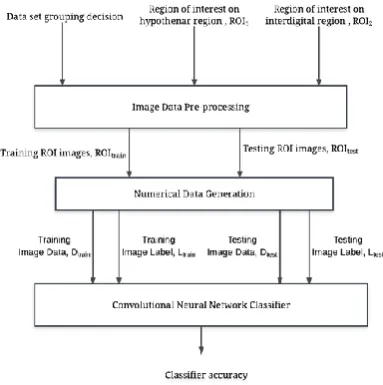
[image:2.595.318.543.104.249.2]A neural network architecture named Convolutional Neural Network (CNN) architecture is being implemented to fulfil the purpose of conducting palmprint based race classification through machine learning approach. The proposed machine learning algorithm consists of three major processes which starts with image data pre-processing and numerical data generation on input image data, before proceeding to last step of CNN classification. Block diagram of palmprint-based race classification using CNN architecture is given in Fig. 2.
Fig. 2 Block diagram of palmprint-based race classification using CNN architecture.
A. Image Data Pre-Processing
Two regions of interest (ROI) with dimension of 240 pixels × 240 pixels are extracted from interdigital and hypothenar regions of original palm print images [11,12]. All ROI images extracted are sampled from participants from either one out of three major human races in Malaysia, which are Malays, Chinese and Indian. With extracted ROI images as input data, image data preprocessing is performed to produce data sets which will be fed into neural network for classification purposes.
Other than training data that provides examples paired with expected output during training phase, part of all ROI image data are assigned as testing data set to serve the purpose of
[image:2.595.73.265.392.585.2]evaluating trained model in terms of accuracy from time to time. Data set grouping decision on training data: testing data ratio is set to be around 70%:30%. All pre-processing tasks performed on input data is shown in Fig. 3.
Fig. 3 Block diagram of input data pre-processing.
All ROI images undergoes conversion from RGB color image to greyscale image. Conversion of input ROI images from color image into greyscale image would reduce pixel data dimension of input ROI images by one-third. The images are further resized from initial dimension of 240 pixels × 240 pixels to 112 pixels × 112 pixels. This is then followed by data splitting operation is done to split all data into training data set and testing data set. Both training data and testing data are split and placed in different directories, with three folders each categorizing ROI images of Malays race, Chinese race and Indian race.Resizing task is performed through image division, either by block or by masking approach. Kindly note that there are total of three different input sizes under investigation are 112 pixels × 112 pixels, 56 pixels × 56 pixels and 28 pixels × 28 pixels. All these different input sizes would be utilized using different CNN architectures.
B. Numerical Data Generation
International Journal of Innovative Technology and Exploring Engineering (IJITEE) ISSN: 2278-3075, Volume-8 Issue-7, May, 2019
[image:3.595.88.508.72.213.2]C. Convolutional Neural Network Classifier
Fig. 4 Preliminary experiments
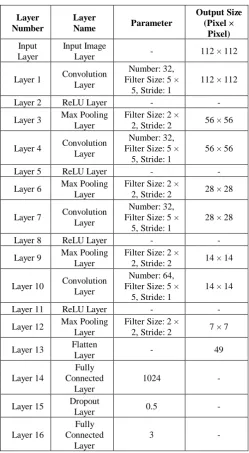
Table 1. CNN architecture parameters for 112 pixels × 112 pixels input image.
Layer Number
Layer
Name Parameter
Output Size (Pixel ×
Pixel)
Input Layer
Input Image
Layer - 112 × 112
Layer 1 Convolution Layer
Number: 32, Filter Size: 5 ×
5, Stride: 1
112 × 112
Layer 2 ReLU Layer - -
Layer 3 Max Pooling Layer
Filter Size: 2 ×
2, Stride: 2 56 × 56
Layer 4 Convolution Layer
Number: 32, Filter Size: 5 ×
5, Stride: 1
56 × 56
Layer 5 ReLU Layer - -
Layer 6 Max Pooling Layer
Filter Size: 2 ×
2, Stride: 2 28 × 28
Layer 7 Convolution Layer
Number: 32, Filter Size: 5 ×
5, Stride: 1
28 × 28
Layer 8 ReLU Layer - -
Layer 9 Max Pooling Layer
Filter Size: 2 ×
2, Stride: 2 14 × 14
Layer 10 Convolution Layer
Number: 64, Filter Size: 5 ×
5, Stride: 1
14 × 14
Layer 11 ReLU Layer - -
Layer 12 Max Pooling Layer
Filter Size: 2 ×
2, Stride: 2 7 × 7
Layer 13 Flatten
Layer - 49
Layer 14
Fully Connected
Layer
1024 -
Layer 15 Dropout
Layer 0.5 -
Layer 16
Fully Connected
Layer
3 -
Preliminary experiments are firstly performed to investigate effect of CNN parameters on classification accuracy. The parameter under investigation is number of training epoch, activation function used after each convolution layer
followed next by usage of data augmentation. Based on results of preliminary experiments that outcomes the best accuracy, CNN different input sized are built and further enhanced. As this project is to find out on how CNN architecture’s performance differs with multiple input size, there are three different input image sizes being used in this project (i.e., 112 pixels × 112 pixels, 56 pixels × 56 pixels and 28 pixels × 28 pixels). Hence, there are three similar CNN frameworks has been proposed, each utilizing three main types of CNN layers which are Convolutional Layer, Pooling Layer and Fully-Connected Layer. CNN framework gained interest for its high competency of extracting complex reliance on high-dimensional input data through hierarchy layer-by-layer feature learning, fueled by advancement of GPU processing capability and decline in computing hardware cost [13,14]. The established CNN framework would apply convolution operation on input data with several of convolution filters at first, and followed next by activation layer where non-linearity is then introduced into the network, which is found useful in convolutional network performance improvement [15]. Activation functions that are commonly used are Sigmoid function and Rectified Linear Unit (ReLU) function. When it comes to pooling layer, feature maps produced by convolution layer are down-sampled along spatial dimension using smaller window with specified stride, by only retaining one value per window [16]. These three major layers are then repeated before moving on to flatten layer, fully-connected layer and dropout layer. Table 1 presents the CNN architecture utilized for input image size of 112 pixels × 112 pixels. Compared to CNN architecture for 28 pixels × 28 pixels, this one has 16 more layers as to standardize the output dimension right after the last convolution layer for both architectures.
III. RESULTS
This section will present on preliminary experiments focused on three CNN parameters, which are number of training epoch, activation function and lastly usage of data augmentation. Based on these preliminary experiments’ results, CNN architectures using different input sized are built and further enhanced by using the parameters combination that outcomes
[image:3.595.41.291.275.729.2]All results are measured through four-fold cross validation approach, where whole data is distributed into 4 distinct data subsets. One of them would serve as testing purpose while the remaining three data subsets would be utilized as training dataset.
A. Preliminary Experiments
Preliminary experiments are set up to study on to investigate on how variation of CNN parameters would affect a CNN classifier in terms of accuracy performance and elapsed processing duration. Fig. 4 shows the overall view of preliminary experiments carried on the three parameters and their variations. For number of training epoch parameter, it is set to vary between 10 epochs to 40 epochs with step size of 10 epochs. On the other hand, one out of three types of activation function would be selected when it comes to preliminary experiments on activation function parameter. Last but not the least, preliminary experiment on data augmentation is performed in such a way that the input ROI images are rotated at random degree followed by random translation [17].
B. Number of Training Epochs
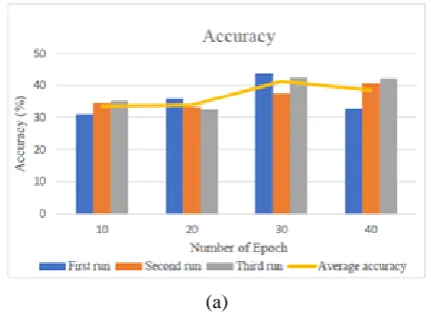
Fig. 5 shows preliminary results for number of training epochs parameter. From the results, increasing number of epochs by 10 to 20 epochs does not improve much in accuracy performance as average accuracy only has increased slightly while highest accuracy increased by a mere 0.7%. The highest peak of average accuracy is achieved when number of epochs is set to be 30 epochs, with highest achieved accuracy of 43.7%. However, when the number of epochs reaches 40 epochs, the average accuracy has deteriorated slightly instead of going higher. In terms of elapsed processing duration, it is observed that a proportional relationship between average computational duration and number of epochs, which implies that longer duration is needed when more epochs are used.
(a)
[image:4.595.325.532.53.206.2](b)
Fig. 5 Preliminary results for number of training epochs parameter. (a) Accuracy performance against number of
epochs; (b) Elapsed duration against number of epochs.
C. Activation Function
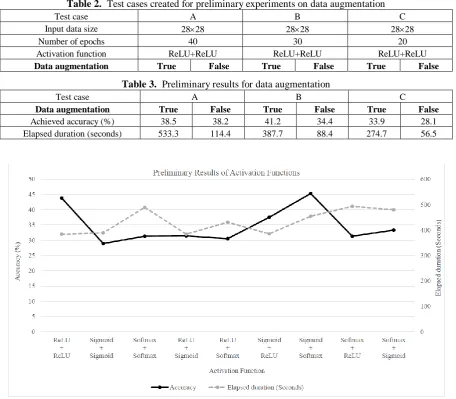
Line graphs shown in Fig. 6 shows preliminary results for activation function parameter, in the form of accuracy percentage and elapsed duration. The accuracy is presented in percentage while elapsed duration is presented by the dotted line with unit measured in seconds. Combination of sigmoid function followed by sigmoid function has demonstrated lowest achieved accuracy of 28.9%.For combinations initiated with ReLU layer first, the accuracy accomplished by ReLU-ReLU combination is 43.8%. Besides that, ReLU-sigmoid combination shows low accuracy of 31.4% while ReLU-softmax shows even lower accuracy of only 30.5%. The ReLU layer has a characteristic where a negative derivative is always clipped to zero. Consequently, ReLU layer is not suitable to be incorporated with other types of activation layer (i.e., sigmoid and softmax layer). It would prevent any further weight changes from occurring during CNN framework training process. Last but not the least, combinations that begin with Softmax layer at first tend to deliver poor accuracy performance. All three combinations of softmax-softmax, softmax-ReLU and softmax-sigmoid layers shows low accuracies below average accuracy of 34.8%, ranged from 31.3% to 33.3%.Total of three test cases (as shown in Table 2) are created for preliminary experiment focused on data augmentation, with preliminary results shown in Table 3. At the first glance at Table 3, it is noticeable that there is an incremental improvement trend between achievable accuracy when data augmentation is utilized or otherwise, ranged from 0.3% to 6.8%. This behavior is expected as previous research has demonstrated important role of data augmentation in preventing neural network overfitting [18]. However, when it comes to performance in terms of elapsed duration needed by each test cases, every test case would require about 4.6 times longer duration to complete increased computational tasks of evidently larger augmented input dataset.Experiment involving three different input data size have been carried out to study how variation of input data sizes could impact
performance of CNN
[image:4.595.65.281.522.683.2]International Journal of Innovative Technology and Exploring Engineering (IJITEE) ISSN: 2278-3075, Volume-8 Issue-7, May, 2019
These input data will be resized into three different data sizes that are investigated in this study, which are 28 pixels × 28 pixels, 56 pixels × 56 pixels and 112 pixels × 112 pixels. However, CNN frameworks proposed for different input data size would include different number of convolution layer. Thus, number of activation functions needed would differ from one another among the three proposed CNN frameworks.
Table 4 presents training options used for different input data sizes. Based on results of prior preliminary experiments, three parameters (i.e., number of epochs, activation function
[image:5.595.71.528.212.611.2]and data augmentation) are decided. For activation function, combination of sigmoid layer followed by softmax layer is being used as it would contributes to highest accuracy as in preliminary experiments. Number of epochs is set to 30 and data augmentation is performed for all three different input data sizes. All input data are augmented by 5 folds whereby input ROIs are rotated by random angle followed by random translation.
Table 2. Test cases created for preliminary experiments on data augmentation
Test case A B C
Input data size 2828 2828 2828
Number of epochs 40 30 20
Activation function ReLU+ReLU ReLU+ReLU ReLU+ReLU
Data augmentation True False True False True False
Table 3. Preliminary results for data augmentation
Test case A B C
Data augmentation True False True False True False
Achieved accuracy (%) 38.5 38.2 41.2 34.4 33.9 28.1 Elapsed duration (seconds) 533.3 114.4 387.7 88.4 274.7 56.5
Fig. 6 Preliminary results for activation function parameter.
Table 4. Training parameters for three different input data sizes.
Input data size (pixels
pixels)
28 28 56 56 112 112
Number of epochs
30 30 30
Activation function
Sigmoid Sigmoid Sigmoid Softmax Sigmoid Sigmoid Softmax Sigmoid Softmax
Data augmentation
TRUE TRUE TRUE
Repetitive learning of irrelevant features because of data redundancy has negatively skewed average accuracy by 12.1%, when compared to input data of 56 pixels × 56 pixels.
Fig. 7 Four-folds performances validation in terms of achieved accuracy for different data sizes
CNN framework that uses input data size of 56 pixels × 56 pixels has achieved highest average accuracy, which is at 43.3%. This achieved accuracy results has increased drastically by 31.2% as compared to when input data of 28 pixels × 28 pixels is used. Besides that, it is observed that all four readings of 4-fold cross validation converge at this point where the accuracy ranges from 41.1% to 46.6%. Last but not the least, the lowest average accuracy is 112 pixels × 112 pixels. As input data size is relatively insufficient, the accuracy reading for input data size of 112 pixels × 112 pixels is uncertain with unforeseeable behavior. The accuracy reading for each single run differs greatly from one another and subjected to standard deviation of 15.9%, as they widely spread from lowest reading of 16.7% to highest reading of 50%.
[image:6.595.59.284.610.731.2]Fig. 8 shows 4-folds performances validation in terms of achieved accuracy and elapsed duration for different data size. It is noticeable that longest duration is taken to train CNN framework using input data size of 28 pixels × 28 pixels (422.2 seconds in average), which is more compared to when input data of 56 pixels × 56 pixels are used. To explain this unusual trend, this is because resizing input data into size of 28 pixels × 28 pixels, as compared to resizing into size of 56 pixels × 56 pixels, would requires more complex computation involving higher number of image filters used.
Fig. 8 Four-folds performances validation in terms of elapsed duration for different data sizes
Besides that, when input data size is set to be smaller, input data which is initially larger needs to be fragmented into
smaller pieces though image division. As smaller input size is used, complexity of this process of fragmenting image into smaller size increases. Second highest duration need is 332.9 seconds by input data size of 112 pixels × 112 pixels, followed next by 296.7 seconds by input data size of 56 pixels × 56 pixels.
IV. CONCLUSION
A study has been made on application of CNN architecture in palmprint identification based on race. Three different CNN frameworks are proposed to cater experiments done using three different input data sizes. From preliminary experiments focused on effect of total epoch number, activation function and usage of data augmentation, it is concluded that the most suitable epoch number parameter for optimum CNN framework’s classification accuracy would be 30 epochs. Besides that, preliminary results obtained has also showed highest accuracy when combination of sigmoid layer followed by softmax layer are used as activation layers. Last but not the least, it is also observed that data augmentation does play an important role in inducing positive effect on CNN classification accuracy despite inevitable longer processing time. Labelled data set of reasonably large amount would be essential to establish robust CNN framework, such as deep CNN architecture named Inception-v4 proposed in [19]. As variation of input data size parameter would deviates computational complexity and classification performance of the CNN classifier, it plays a decisive role in determining duration needed for each CNN framework as well. Through four-fold verification approach, the most suitable data input size for the developed CNN framework would be 56 pixels × 56 pixels. Compared to computation task, image division task performed to resize input data into desired size would increases elapsed duration even more exponentially. In conclusion, using medium sized input data produce better classifier performance in terms of accuracy and elapsed duration.
ACKNOWLEDGMENT
This work was supported in part by the Universiti Sains Malaysia under Research University Grant (Individual) 1001/PELECT/8014052.
REFERENCES
1. Giot R, El-Abed M, Rosenberger C (2013) Fast computation of the performance evaluation of biometric systems: Application to multibiometrics. Future Generation Computer Systems 29(3):788-799. https://doi.org/10.1016/j.future.2012.02.003
2. Chen J, Moon YS, Wong MF, Su G (2010) Palmprint authentication using a symbolic representation of images. Image Vis. Comput. 28(3):343-351.
https://doi.org/10.1016/j.imavis.2009.06.004
3. Arslan B, Yorulmaz E, Akca B, Sagiroglu S (2016) Security perspective of biometric recognition and machine learning techniques. In: 15th IEEE Int. Conf. on Machine Learning and Application (ICMLA), Anaheim, California, USA, pp. 492-497.
4. Zhu LQ, Zhang SY (2010) Multimodal biometric identification system based on finger geometry,
International Journal of Innovative Technology and Exploring Engineering (IJITEE) ISSN: 2278-3075, Volume-8 Issue-7, May, 2019
https://doi.org/10.1016/j.patrec.2010.05.010
5. Kosif R, Diramali M, Sertel S (2015) Distances of palmar flexion creases (haustra digiti) and digital formulae in right and left handed people. Int J
Morphol, 33(1), 173–177.
http://dx.doi.org/10.4067/S0717-95022015000100028.
6. Latha YLM, Prasad MVNK (2013) Extraction of dynamic region of interest (ROI) for palmprint. Proc. of Int. Conf. on Advances in Computer Science (AETACS), National Capital Region, India, pp. 263–269. 7. Jain AK, Feng J (2009) Latent palmprint matching. IEEE Transactions on
Pattern Analysis and Machine Intelligence, 31(6), 1032–1047. https://doi.org/10.1109/TPAMI.2008.242.
8. Adetona MO, Oladapo OO, Akinyemi JO (2012) Palmar flexion creases variants among Nigerians. African Journal of Biomedical Research, 15(2), 93–96.
9. Damousis IG, Argyropoulos S (2012) Four machine learning algorithms for biometrics fusion: A comparative study. Applied Computational Intelligence and Soft Computing, 2012:Article ID 242401, 7 pages. http://dx.doi.org/10.1155/2012/242401
10.Kong A, Zhang D, Kamel M. (2009) A survey of palmprint recognition. Pattern Recognition, 42(7), 1408–1418. https://doi.org/10.1016/j.patcog.2009.01.018
11.Yaacob R, Mohd Hadi Pritam H, Nik Hassan NF, Ooi CD, Ibrahim H, Othman PJ (2017) Computer assisted segmentation of palmprint images for biometric research, In: 7th IEEE International Conference on Control System, Computing and Engineering (ICCSCE), Penang, Malaysia, pp. 272-277.
12.Yaacob R, Ooi CD, Ibrahim H, Nik Hassan NF, Othman PJ, Hadi H (2019) Automatic extraction of two regions of creases from palmprint images for biometric identification. Journal of Sensors, 2019: Article ID 5128062, 12 pages.
https://doi.org/10.1155/2019/5128062
13. Rao Y, Ni J (2016) A deep learning approach to detection of splicing and copy-move forgeries in images. In: 2016 IEEE International Workshop on Information Forensics and Security (WIFS), Abu Dhabi, United Arab Emirates, pp. 1–6.
14. Deng L (2014) A tutorial survey of architectures, algorithms, and applications for deep learning. APSIPA Transactions on Signal and Information Processing, 3(2):1–29. https://doi.org/10.1017/atsip.2013.9 15. Jarrett K, Kavukcuoglu K, Ranzato M, LeCun Y (2009) What is the best multi-stage architecture for object recognition? In: IEEE 12th International Conference on Computer Vision (ICCV), Kyoto, Japan, pp. 2146–2153.
16. Bayar B, Stamm MC (2016) A deep learning approach to universal image manipulation detection using a new convolutional layer. In: Proceedings of the 4th ACM Workshop on Information Hiding and Multimedia Security 2016, Galicia, Spain, pp. 5–10.
17. Salamon J, Bello JP (2016) Deep Convolutional Neural Networks and data augmentation for environmental sound classification. IEEE Signal
Processing Letters, 24(3), 279–283.
https://doi.org/10.1109/LSP.2017.2657381
18. Ciresan DC, Meier U, Gambardella LM, Schmidhuber J (2010) Deep, big, simple neural nets for handwritten digit recognition. Neural Computation 22(12):3207-3220.