Evaluating the Scientific Impact of XSEDE
Fugang Wang
Indiana University Bloomington, Indiana, U.S.A.Gregor von Laszewski
∗Indiana University Bloomington, Indiana, U.S.A.
[email protected]
Timothy Whitson
Indiana University Bloomington, Indiana, U.S.A.Geoffrey C. Fox
Indiana University Bloomington, Indiana, U.S.A.Thomas R. Furlani
Center for ComputationalResearch
University at Buffalo, SUNY 701 Ellicott Street Buffalo, New York, 14203
Robert L. DeLeon
Steven M. Gallo
University at Buffalo, SUNYBuffalo, New York, 14203
ABSTRACT
We use the bibliometrics approach to evaluate the scientific impact of XSEDE. By utilizing publication data from vari-ous sources, e.g., ISI Web of Science and Microsoft Academic Graph, we calculate the impact metrics of XSEDE publica-tions and show how they compare with non-XSEDE
pub-lication from the same field of study, or non-XSEDEpeers
from the same journal issue. We explain in detail how we re-trieved, cleaned, and curated millions of related publication entries. We then introduce the metrics we used for evalu-ation and comparison, and the methods used to calculate them. Detailed analysis results of Field Weighted Citation Impact (FWCI) and the peers comparison will be presented and discussed. We also explain how the same approaches could be used to evaluate publications from a similar organi-zation or institute, to demonstrate the general applicability of the present evaluation approach providing impact even beyond XSEDE.
Categories and Subject Descriptors
H.4 [Information Systems Applications]: Miscellaneous;
D.2.8 [Software Engineering]: Metrics—complexity
mea-sures, performance measures
General Terms
Theory, MeasurementKeywords
Scientific impact, bibliometrics, h-index, Technology Audit Service, XDMoD, XSEDE
1.
INTRODUCTION
∗Corresponding Author.
Permission to make digital or hard copies of all or part of this work for personal or classroom use is granted without fee provided that copies are not made or distributed for profit or commercial advantage and that copies bear this notice and the full citation on the first page. To copy otherwise, to republish, to post on servers or to redistribute to lists, requires prior specific permission and/or a fee.
PEARC18 ...2018,USA
Copyright 2018 ACM TBD...$15.00. http://dx.doi.org/TBD ...$15.00.
To identify the impact ofscientific advancements enabled
by enhanced cyberinfrastructure, it is important to conduct a comprehensive analysis of achievements that can be at-tributed to the use of the advanced infrastructure, such as that provided by the Extreme Science and Discovery Envi-ronment (XSEDE) [5, 18].
We use the bibliometrics approach to evaluate the scien-tific impact of XSEDE. By acquiring related publication and citation data from multiple sources we calculate various met-rics that show the impact of the publications and how they compare to their non-XSEDE peers that were published in the same journals, or in the same field of study. By process-ing millions of publication data entries we normalized the ci-tation count by field of study. This essentially eliminates the problem that different fields of study have different publica-tion characteristics. We introduced a novel [19] method to compare the target publications group with their peers pub-lished in the same publication venue to further show how the target publications group performs compared to their peers within the same publication venue.
2.
RELATED WORKS
Bibliometrics based analysis has been the most commonly used method to evaluate the research impact of an individ-ual, a research group, or even an organization. Publication count and citation count based metrics provide an effective way to show the quantity and quality, and the impact of scientific research activities. For instance, it was used to evaluate the quality of research in the United Kingdom [17, 16]. Most popular college/university rankings use citation based bibliometrics as an important factor to evaluate the quality of their research, e.g., the overall publication count and citation count in a certain year or a year range; the num-ber of papers published in certain top journals; the numnum-ber of highly cited papers; rating the citation count of a paper or its percentile ranking, etc.
Compute Canada, a virtual organization similar to XSEDE, also uses a bibliometrics based analysis to evaluate the im-pact of their research [1].
Some previous limited work studied the impact of Tera-Grid [6], the early version of XSEDE, by analyzing the pub-lications for one specific research allocation quarter, which involved a very limited number of researchers and
publica-tions. Our work is unique in that it provides acomprehensive
ap-proach such as Field Weighted Citation Impact and journal publication-based peers comparison.
In addition to the more intuitive direct metrics of publica-tion and citapublica-tion count, some other derivative metrics such as h-index [13] and g-index [11] combines both publication and citation count to generate one metric. I10-index [2] in contrast measures only the count of those publications that received at least ten references by other publications. In our evaluation we calculated such metrics for various XSEDE research entities to show the impact and comparison of the entities on the same level, e.g., individual, project, research field of study, organization, etc. The results are presented on the XDMoD scientific impact portal [4].
Usage based metrics [7, 8] have also been proposed in-cluding metrics such as views and downloads, instead of the more formal citations of publications. However the appli-cability of this approach may be limited because the usage data may not be available from a publisher, or different pub-lishers may have different criteria to measure the usage data. Thus, it would create an inconsistent comparison for papers published by different publishers. For this reason we did not present such metrics in this paper.
3.
METHODOLOGY
We first introduce the methodology we use in the biblio-metrics analysis to evaluate the scientific impact of XSEDE publications. This includes the specification of the dataset and data sources used in the analysis, the approaches to define and calculate the various metrics, and the informa-tion about the sophisticated software and service framework developed to facilitate this to XSEDE unique and compre-hensive evaluation study.
3.1
Dataset and data sources
Several data sets and sources are involved in this study which includes XSEDE publications, Microsoft Academic Graph (MAG), and Web of Science Data. For all data we used the same time period between 2005 and 2016, which is the same as for the XSEDE publications. We describe the basic features of the datasets next.
XSEDE publications. This dataset includes publications from XSEDE as well as from TeraGrid. This data is col-lected from two sources. One is from the user-submitted data from the XSEDE user portal; another is from the past TeraGrid/XSEDE project reports submitted to NSF. For the latter, we extracted the publications appendix from the reports and then parsed and curated with significant ef-fort the publication records text, before putting them into a structured database. There were over 20 thousand raw entries.
Microsoft Academic Graph (MAG). This dataset was retrieved with the API provided by Microsoft. The data was then curated and cleaned and put into a MongoDB database. This dataset has about 58 million entries.
ISI Web of Science (WoS). For the publication venues with at least 10 XSEDE papers appearing in them, we re-trieved all the publications published in them to facilitate the peers comparison study. This dataset has about 2 mil-lion entries.
3.2
Field Weighted Citation Impact Analysis
The field Weighted Citation Impact (FWCI) metric is pro-posed as one of the snowball metrics [10]. It calculates the
average citation count of a target group of publications based on their field of science, and then compare that with the av-erage citation count of the whole field of science in the same time period. The result is a ratio
F W CI=avg(CCgroup)/avg(CCf ield)
A FWCI value greater than 1 indicates that the pertinent
publication group had more citations than the expected value of the field of science, while a value less than 1 indicates that the average citation count that the group received was less than the expected value for the applicable field of science. In this study we introduced the following process to calculate
theFWCI values for the XSEDE publications.
1. Query every raw XSEDE publication by title against the MAG data set, and verify the matching ones by checking other properties such as published year. After this process we identify the verified matching records in the MAG for all valid XSEDE publications. During this process we use elasticsearch [12] to improve both the accuracy and the performance of the query. This is important because of the size of the dataset.
2. For each of the 58 million MAG data records, we use the assigned field of study values, along with other
re-lated data form MAG, totraceupward to the top levels
of the hierarchical fields. This process narrowed down the 30k different assigned fields of study to 19 overall
top levelfields of studyas defined in the MAG dataset.
One thing to note is that each publication is assigned to multiple science fields in the original publication records, and the final top level science field category of a publication may not be unique either. However as a lot of research publications are themselves multi-disciplinary we think that such results are valid and acceptable.
In the following analysis we counted a publication in all the top level science fields that we found following this tracing process.
3. Once we have each and every publications in the MAG dataset, we can calculate the average citation count by each top level field, for all the MAG publications and XSEDE publications respectively. Following that we can calculate the ratio to get the FWCI values.
3.3
Metric for Journal Publication-based Peer
Comparison
An importnat achievement is our novel and sophisticated
Journal Publication-based Peer Comparison (JPPC)metric as discussed in [19]. We used the following process to obtain the data needed for the analysis.
2. From this verified publications list, we find the sub-set of all publication venues with at least 10 XSEDE publications. For each of the publications published in these venues we retrieve from WoS the extended meta-data to get the exact volume and issue number of the publication venue. The reasons why we chose a thresh-old value of 10 to identify a publication venue subset are:
(a) This ensures the statistical significance of the anal-ysis results.
(b) This eases the data retrieval work substantially.
While we have~1400 distinct publication venues
identified from all the verified XSEDE publica-tions, the subset when we use 10 as the minimum number of publications appearing in the venue
was reduced to~120 publication venues.
(c) Using this criterion, the number of XSEDE pub-lications in the peers comparison was about five thousand, or about 56% of all the verified ones. This represents a good portion of all the data.
3. For all ~120 publication venues, we retrieved all the
publications data published in them during the same time period as the TeraGrid/XSEDE publications (2005-2016).
Based on this data, we can establish suitable comparison peer groups, which are based each on a single journal issue (or journal volume when no issue data available for some publications) that an XSEDE publication appeared in. For each comparison peer group, we rank the citation count of each publication (including the XSEDE ones and the peers). The calculated percentile ranking values serve as the basis of the peer comparison study. The comparison is between publications that we identified as XSEDE papers and those that were not.
To apply the percentile ranking to the field of science of XSEDE publications among the journal issues where each publication was published, we aggregate them based on the project field of science data obtained from the XSEDE cen-tral database (XDcDB). These XSEDE fields of science are self-reported by the researchers. We then calculate the av-erage and median percentile rank for each field of science (FOS).
3.4
Software Architecture Supporting the Study
We have developed a sophisticated software framework sup-porting the study, which includes data acquisition, cleanup, processing and presentation. The framework is based on a distributed set of software services. This service-oriented framework is integrated as part of a layered architecture consisting of components for:
• A data layer that retrieves publication and citation
data from external sources. This includes data from the ISI Web of Knowledge; Microsoft Academic Graph; Google Scholar, and very importantly the NSF award database.
• Business logic layer that deals with:
– parsing and processing while correlating data from
various databases and services, such as the XSEDE central database (XDcDB).
– a metrics generation and analysis system for
dif-ferent aggregation levels – users, projects, organi-zation, field of science.
• a presentation layer using a lightweight portal in
addi-tion to exposing some data via a RESTful API [20].
Due to the use of the Software as a Service (SaaS) approach,
our framework isexpandableas we are able to integrate new
services and data resources as required. Hence our frame-work can be adapted to other resource providers as demon-strated in [19]. Obviously, adaptation could mean that we have to change the bibliometric data, which could mean that we need to integrate new data sources and curation services spending significant effort to integrate such data.
3.4.1
Service Integration into XSEDE and XDMoD
Our current framework for XSEDE includes services that are motivated by our initial findings from the XSEDE
bibliomet-ric data. A RESTful service is integrated into the XSEDE
User Portal as part of the publication discovery service. The various impact metrics of different levels of XSEDE entities - person, project, organization, field of study - as
well as part of the analyses are available on the XDMoD
scientific impact portal [4].
4.
RESULTS AND DISCUSSIONS
In this paper, we discuss results specifically targeting the analysis of data related to XSEDE.
4.1
Field Weighted Citation Impact Metrics
First we show the calculated FWCI values in Figure 1. The plot lists the FWCI for the top-level fields of science as de-fined from the MAG data. Each data point also has the number of XSEDE publications as well as the number of all publications in that field. The red vertical line indicates the point at which FWCI=1. Figure 1 shows all fields but one (political science, with only 3 publications) that had FWCI values greater than 1, with the majority fields having much higher values.
In Figure 2 we display the same data but sort it based on the number of XSEDE publications in the field. This emphasizes the FWCI for the fields that the majority of the XSEDE publications fell within.
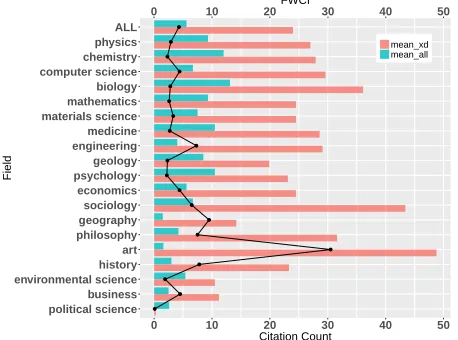
Figure 3 compares the expected citation count based on all publications in a given field of science with the actual aver-age citation count for XSEDE publications in each field of science, while including the FWCI values at the same time. The plot was sorted based on the number of XSEDE publi-cations in the field. This again indicates that XSEDE pub-lications received much higher citation counts and implies a higher scientific impact than their non-XSEDE peers. In Figure 4 we show the extra citations XSEDE publications receive for each field, compared to the expected overall field of science value. Figure 4 also indicates how much impact that access to XSEDE resources has on each individual field of science.
political science environmental science psychology geology chemistry mathematics medicine biology physics materials science ALL economics computer science business sociology engineering philosophy history geography art
FWCI
0 5 10 15 20 25 30
30.5 ( 62 / 2,360,681 )
0.1 ( 3 / 1,845,790 ) 1.9 ( 25 / 654,264 ) 2.2 ( 454 / 4,747,669 ) 2.3 ( 1,205 / 2,352,750 ) 2.3 ( 6,691 / 7,505,924 ) 2.6 ( 2,439 / 5,981,276 ) 2.7 ( 1,468 / 12,061,137 ) 2.8 ( 3,461 / 9,042,998 ) 2.9 ( 8,126 / 7,025,455 ) 3.3 ( 2,385 / 4,001,730 )
4.3 ( 15,042 / 56,628,566 ) 4.4 ( 390 / 6,825,909 ) 4.4 ( 4,498 / 12,422,929 ) 4.5 ( 19 / 1,754,885 )
6.5 ( 293 / 5,977,362 ) 7.3 ( 1,451 / 11,691,074 )
7.5 ( 82 / 2,365,079 ) 7.8 ( 52 / 2,039,197 )
9.5 ( 170 / 3,592,772 )
[image:4.612.61.288.53.228.2]FWCI (n_TGXD / n_all)
Figure 1: Field Weighted Citation Impact (FWCI) by Field sorted by FWCI.
political science business environmental science history art philosophy geography sociology economics psychology geology engineering medicine materials science mathematics biology computer science chemistry physics ALL
n_TGXD
0 2k 4k 6k 8k 10k 12k 14k
4.3 ( 15,042 / 56,628,566 )
0.1 ( 3 / 1,845,790 ) 4.5 ( 19 / 1,754,885 ) 1.9 ( 25 / 654,264 ) 7.8 ( 52 / 2,039,197 ) 30.5 ( 62 / 2,360,681 ) 7.5 ( 82 / 2,365,079 ) 9.5 ( 170 / 3,592,772 ) 6.5 ( 293 / 5,977,362 ) 4.4 ( 390 / 6,825,909 ) 2.2 ( 454 / 4,747,669 )
2.3 ( 1,205 / 2,352,750 ) 7.3 ( 1,451 / 11,691,074 ) 2.7 ( 1,468 / 12,061,137 )
3.3 ( 2,385 / 4,001,730 ) 2.6 ( 2,439 / 5,981,276 )
2.8 ( 3,461 / 9,042,998 ) 4.4 ( 4,498 / 12,422,929 )
2.3 ( 6,691 / 7,505,924 ) 2.9 ( 8,126 / 7,025,455 )
[image:4.612.319.552.55.228.2]FWCI (n_TGXD / n_all)
Figure 2: FWCI by Field sorted by Publication Count of the Field.
0 10 20 30 40 50
political science business environmental science history art philosophy geography sociology economics psychology geology engineering medicine materials science mathematics biology computer science chemistry physics ALL
0 10 20 30 40 50
FWCI
Citation Count
Field
mean_xd mean_all
Figure 3: FWCI with Expected Citation Count and Actual Citation Count from XD Publications.
each category. The results show that for most fields a higher than expected percentage of XSEDE publications fall into
’
political science business environmental science history art philosophy geography sociology economics psychology geology engineering medicine materials science mathematics biology computer science chemistry physics ALL
0 100,000 200,000 300,000
Overall Citation Count
Field
Extra Citations Expected Citations
Figure 4: Extra Citation Count Achieved by XD Publications.
the highly cited papers categories. E.g., when we consider all the publications and fields together, 4.8% XSEDE pub-lications were in the top 1% highly cited group while 22.5% were in the top 5% highly cited group.
4.2
XSEDE Peer Data Analysis
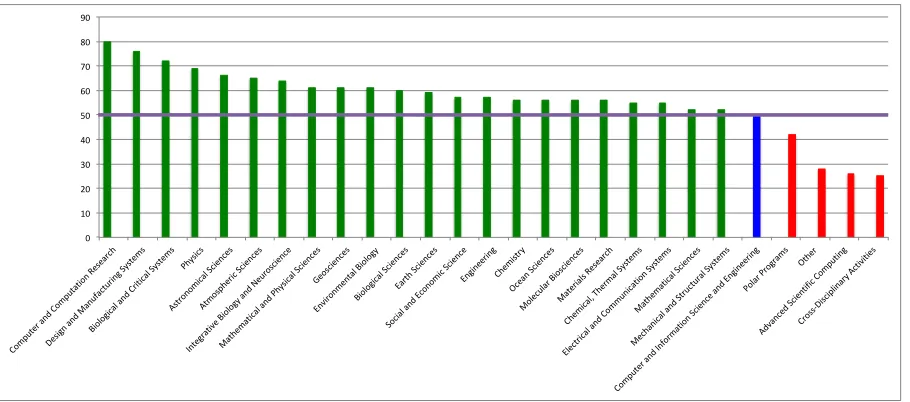
Now we present a number of graphs and tables that show the results from the peer comparison study. Figure 5 shows the average percentile rank of XSEDE publications grouped by each publication venue. Figure 6 shows the same publication data but presents the median percentile rank values. When we aggregate the results by fields of study instead of by individual journal, we get the results shown in Figure 7. These plots show that for majority of the publications venues, or fields of science, XSEDE publications have a higher per-centile ranking based on citation count.
[image:4.612.62.281.279.440.2]When we consider the overall comparison results, Figure 8 shows the distribution of the XSEDE publication’s percentile rank in each 10% increment group. Values above 50% in-dicate that the XSEDE publications are cited at a higher rate than their non-XSEDE peers. Again the result show the distribution skewed to the higher end, which means that XSEDE publications are cited more frequently than their non-XSEDE peers.
Figure 9 shows the empirical cumulative distribution of the percentile ranks compared to that of the peers group. The XSEDE publication curve is entirely to the right of the over-all publication curve which is another indication that the XSEDE publications have a higher impact. Figure 10 shows the kernel density of the distributions of XSEDE publica-tions’ percentile ranking and that of peers’. As expected, the non-XSEDE peer publications are evenly distributed by per-centile ranks with the spike at 50% mostly coming from more recently published journal issues where most publications were not yet cited. The XSEDE publications are weighted to the higher percentile ranks side again. This again shows that XSEDE publications tend to be more highly cited com-pared to their peers published in the same journal issue. Table 2 lists the average and median rankings and cita-tions received by XSEDE and non-XSEDE peer publication groups.
[image:4.612.60.289.479.649.2]distribu-Table 1: Highly Cited Papers Statistics (in top 1% and 5%)
Field # in top 1% % in top 1% # in top 5% % in top 5% # per 100,000 # XSEDE pubs
ALL 727 4.8 3380 22.5 26.6 15042
physics 292 3.6 1204 14.8 115.7 8126
chemistry 177 2.6 782 11.7 89.1 6691
computer science 223 5.0 1037 23.1 36.2 4498
biology 102 2.9 453 13.1 38.3 3461
mathematics 68 2.8 351 14.4 40.8 2439
materials science 108 4.5 446 18.7 59.6 2385
medicine 42 2.9 213 14.5 12.2 1468
engineering 111 7.6 414 28.5 12.4 1451
geology 33 2.7 183 15.2 51.2 1205
psychology 11 2.4 53 11.7 9.6 454
economics 26 6.7 101 25.9 5.7 390
sociology 18 6.1 63 21.5 4.9 293
geography 19 11.2 87 51.2 4.7 170
philosophy 11 13.4 31 37.8 3.5 82
art 15 24.2 39 62.9 2.6 62
history 6 11.5 19 36.5 2.6 52
environmental science 1 4.0 3 12.0 3.8 25
business 1 5.3 6 31.6 1.1 19
political science 0 0.0 0 0.0 0.2 3
0 10 20 30 40 50 60 70 80 90 100 SCIEN TIFIC REPO RTS JOURN AL O
F NUC LEAR
MATE RIALS
NATU RE CHE
MISTRY
NEW JOURN
AL OF P HYSIC
S
NATU RE MA
TERIA LS
WEA THER A
ND FO RECA STIN G NANO SCAL E JOURN AL O
F LIG HTW
AVE T ECHN
OLOG Y
BULLE TIN O
F THE SEISMO
LOGIC AL SO
CIETY OF A
MERIC A
MOLE CULA
R ECO LOGY
JOURN AL O
F PHY SICS B
-ATO MIC MO
LECU LAR A
ND O PTICA
L PHY SICS
JOURN AL O
F COMP UTAT
IONA L PHY
SICS
ASTRO PHYSIC
AL JO URN
AL SU PPLE MENT SERIE S STRU CTURE ASTRO PHYSIC
AL JO URN
AL
PHYSIC S OF P
LASMA S
ASTRO PHYSIC
AL JO URN
AL LE TTERS
NATU RE PHY
SICS
COMP UTER
PHYSIC S COMMU
NICAT IONS
PHYSIC AL RE
VIEW A
GENO ME BIO
LOGY BIOPHY SICAL JOURN AL JOURN AL O
F BIO MOLE
CULA R NMR SCIEN
CE
JOURN AL O
F THE ELEC TROCHE MICAL SOCIE TY PRO TEINS-S
TRUCT URE FU
NCTIO N AN
D BIO INFO
RMA TICS
JOURN AL O
F FLU ID ME
CHANIC S BIOIN FORMA TICS PHYSIC AL RE
VIEW LETT ERS BIOPO LYME RS JOURN AL O
F POW ER SO
URCES
JOURN AL O
F MO LECU
LAR B IOLO
GY
COMP UTER
METHO DS IN
APPL IED ME
CHANIC S AND
ENGIN EERIN
G
JOURN AL O
F CAT ALYS
IS
PHYSIC AL CHE
MISTRY CHEMIC
AL PHY SICS
JOURN AL O
F PHY SICAL CHE MISTRY A PLOS ONE NANO LETT ERS BIOCHE MISTRY COMB USTIO
N AN D FLA
ME
NUCL EIC AC
IDS RE SEARC
H
BIOCHIMIC A ET B
IOPHY SICA A
CT A-BIOME
MBRA NES
JOURN AL O
F PHY SICAL
CHE MISTRY
C
PHYSIC S OF F
LUID S
JOURN AL O
F ME DICIN
AL CHE MISTRY SOFT MATT ER MOLE CULA
R SIMU LATIO
N
JOURN AL O
F THE ATMO
SPHE RIC SC
IENCE S CHEMIS TRY-A EURO PEAN JOURN AL ABST RACT
S OF P APERS
OF T HE AME
RICAN CHE MICAL SOCIE TY JOURN AL O
F CHE MICAL
INFO RMA
TION AND MO
DELIN G ADVA NCED FUNC TIONA L MA TERIA LS JOURN AL O
F PHY SICAL
CHEMIS TRY LE
TTERS ACS C
ATAL YSIS INORG ANIC CHEMIS TRY CHEMIC AL SC
IENCE
ANGE WAN
DTE C HEMIE
-INTE RNAT
IONA L EDIT
ION
ACCO UNTS
OF C HEMIC
AL RE SEARC H ADVA NCED MATE RIALS ORG ANIC LETT ERS INTE RNAT IONA L JOU
RNAL OF HE
AT AN D MA
SS TRA NSFE
[image:5.612.80.531.66.510.2]R
Figure 5: Average percentile ranking of XD publications by journal (by ISI)
0 10 20 30 40 50 60 70 80 90 100 ATMO SPHE
RIC EN VIRO NME NT BMC BIOIN FORMA TICS JOM MOLE
CULA R ECO
LOGY
NATU RE CO
MMU NICAT
IONS
CLAS SICAL
AND Q UANT
UM GRA VITY
MONT HLY N
OTICE S OF T
HE RO YAL A
STRO NOMIC
AL SO CIETY NATU
RE MA TERIA
LS
JOURN AL OF P
HYSIC S-CON
DENS ED MA
TTER
JOURN AL O
F PHY SICS B
-ATO MIC MO
LECU LAR A
ND O PTICA
L PHY SICS PHYSIC
AL RE VIEW
D
JOURN AL O
F COMP UTAT
IONA L PHY
SICS
JOURN AL O
F APP LIED P
HYSIC S
ASTRO PHYSIC
AL JO URNAL
LETT ERS
JOURN AL O
F LIG HTW
AVE T ECHN
OLOG Y
ASTRO PHYSIC
AL JO URNAL
STRU CTURE PHYSIC
AL RE VIEW
A OPTIC
S EXP RESS
JOURN AL O
F MO LECU
LAR B IOLO
GY
JOURN AL O
F GEO PHYSIC
AL RE SEARC
H-SP ACE P
HYSIC S
PHYSIC AL RE
VIEW LETT
ERS PHYSIC
S OF P LASMA
S
JOURN AL O
F PHY SICAL
CHEMIS TRY B NATU
RE PHY SICS
SCIEN CE
MOLE CULA
R PHY LOGE
NETIC S AND
EVOL UTIO
N PHYSIC
AL RE VIEW B NANO TECHN OLOG Y ACTA MATE RIALIA BIOCHE MISTRY JOURN AL O
F PHY SICAL OCE ANOG RAPHY COMP UTER METHO DS IN
APPL IED ME
CHANIC S AND
ENGIN EERIN
G
CHEMIS TRY O
F MA TERIA
LS OCEA
N MO DELLIN
G
JOURN AL O
F CAT ALYS
IS
JOURN AL O
F BIO MOLE
CULA R NMR
JOURN AL O
F GEO PHYSIC
AL RE SEARC
H-OC EANS JOURN
AL O F CLIMA
TE
JOURN AL O
F PHY SICAL
CHEMIS TRY C
JOURN AL OF P
HYSIC AL CHE
MISTRY A
PROCE EDIN
GS O F THE
NAT IONA
L ACA DEMY
OF S CIENC
ES O F THE
UNIT ED
MOLE CULA
R SIMU LATIO
N
NUCL EIC AC
IDS RE SEARC
H PHYSIC
S OF F LUID S CHEMIS TRY-A EURO PEAN JOURN AL JOURN AL O
F MA TERIA
LS SC IENCE
ABST RACT
S OF P APERS
OF T HE AME
RICAN CHEMIC
AL SO CIETY
JOURN AL O
F MA TERIA
LS CHE MISTRY
A CARB
ON
JOURN AL O
F CHE MICAL
INFO RMA
TION AND MO
DELIN G
JOURN AL O
F PHY SICAL CHE MISTRY LETT ERS MACRO MOLE CULE S JOURN AL O
F THE AME
RICAN CHEMIC
AL SO CIETY
JOURN AL O
F BON E AND
MIN ERAL RE
SEARC H
JOURN AL O
F THE ATMO
SPHE RIC SC
IENCE S RSC A
DVAN CES
JOURN AL O
F ORG ANIC
CHEMIS TRY CHEMIC
AL SC IENCE ADVA NCED MATE RIALS INTE RNAT IONA L JOU
RNAL OF HE
AT AN D MA
SS TRA NSFE
[image:5.612.77.532.454.676.2]R
0 10 20 30 40 50 60 70 80 90
Comp uter an
d Com putati
on Re searc
h
Desig n and Man
ufactur ing Sy
stems
Biolog ical an
d Criti cal Sy
stems Physics
Astro nomi
cal Sc ience
s
Atmos pheri
c Scie nces
Integrati ve Bi
ology and N
euro scien
ce
Math emati
cal an d Phy
sical Scien
ces
Geosci ences
Envir onme
ntal Bi ology
Biolog ical Sc
ience s
Earth Scien
ces
Social and E
cono mic S
cienc e
Engine ering
Chem istry
Ocean Scien
ces
Molec ular Bi
oscie nces
Mate rials Re
searc h
Chem ical, T
herm al Syste
ms
Electr ical an
d Com munic
ation Syste
ms
Math emati
cal Sc ience
s
Mech anical
and S tructu
ral Sy stems
Comp uter an
d Infor mati
on Sc ience
and E ngine
ering
Polar Prog
rams Other
Advan ced S
cienti fic Co
mputi ng
Cross-D iscipl
inary A ctiviti
[image:6.612.80.535.52.253.2]es
Figure 7: Average percentile ranking of XD publications by Field of Study (by ISI)
Percentile Rank
Density
0 20 40 60 80 100
0
5
10
[image:6.612.343.527.302.434.2]15
Figure 8: Histogram of Percentile Ranking
0 20 40 60 80 100
0.0
0.2
0.4
0.6
0.8
1.0
Percentile ranking
Cum
ulativ
e distr
ituion
[image:6.612.80.260.302.435.2]TG/XD publication peers
Figure 9: Empirical Cumulative Distribution of Percentile Ranks
Table 2: Basic statistics of XSEDE publications group and peers group
Number of Rank Citations
Publications Average Median Average Median
XD 5078 59 63 28 12
Peers 356464 49 49 15 5
0.000
0.005
0.010
0.015
0.020
0.025
Percentile rank
Density
10 20 30 40 50 60 70 80 90
[image:6.612.75.270.471.610.2]TG/XD publication peers
Figure 10: Kernel Density of the distributions of XSEDE publications’ percentile ranking and that of peers’
tions are identical without assuming that they follow a
nor-mal distribution. We used the Mann-Whitney-Wilcoxon
test [15], Mood’s median test [9], and Kruskal-Wallis test [14]. The results are as the following.
Wilcox test for citation count
• W = 1160300000, p-value<2.2e-16. Alternative
hy-pothesis: true location shift is not equal to 0
Wilcox test for percentile ranking
• W = 1090700000, p-value<2.2e-16. Alternative
hy-pothesis: true location shift is not equal to 0
Mood’s median test for citation count
• p-value = 3.299883e-172
Mood’s median test for percentile ranking
• p-value = 8.83052e-71
Kruskal-Wallis Test for citation count
• Kruskal-Wallis chi-squared = 1207.6, df = 1, p-value
Kruskal-Wallis Test for percentile ranking
• Kruskal-Wallis chi-squared = 632.35, df = 1, p-value
<2.2e-16
All of these results strongly indicate that the differences that we see between the XSEDE and the non-XSEDE publication metrics are statistically significant.
We also performed a T-test to test the citation count dif-ferences and percentile rank difdif-ferences. Even though the distribution of the citation count of the XSEDE publication group and the peers group are not necessarily normally dis-tributed, due to the central limit theorem, when the sample size is large enough, it is rational to use the T-test to not only test if there is a statistical difference between the two groups, as having been shown by the several previous tests, but also to quantify the difference between the means. The t-test results for both citation count and percentile ranking are given below.
• T=9.8328, df=5105.5, p-value< 2.2e-16, 95%
confi-dence interval: [10.90,16.32]
T-test for ranking (Welch Two sample t-test)
• T=25.412, df=5105.5, p-value<2.2e-16, 95% confidence
interval: [9.07,10.59]
The results show that the XSEDE group has a statistically higher citation ranking and a statistically higher mean cita-tion rate than the non-XSEDE peer group.
4.2.1
Journal peer comparison based on MAG data
Although we first integrated the MAG data in order to eval-uate the field weighed impact of the XSEDE publications, we can follow the same approach as was done using the WoS data to conduct a similar peer comparison study. Figure 11 and Figure 12 show the average and median percentile rank-ing for XSEDE publications by each journal usrank-ing MAG data. The overall results are pretty similar to what we got from the study with the WoS data.
5.
CONCLUSION
We evaluated the scientific impact of XSEDE by examin-ing the publications that were enabled by havexamin-ing access to the XSEDE resources. By curating the XSEDE publication data including cleansing, verifying and correlating the var-ious data sources, we obtained a substantial very valuable dataset with which to compare and evaluate the scientific impact of XSEDE itself. While using two distinct
analy-ses -Field Weighted Citation Impact analysis, and another
novelJournal Publications-based Peer Comparisonstudy, we
found that XSEDE publications tend to be cited more than non-XSEDE publications. Various statistical tests show the
results are statistically significant. The results from this
study could potentially be used to inform to the XSEDE leadership team and the funding agency about the manage-ment of the facility, for example, to provide useful informa-tion to the resource allocainforma-tion committee during proposal selection and approval. While the present study dealt ex-clusively with XSEDE data, the approaches and methods developed can be applied to evaluate publication data from a variety of different facilities or groups. In fact we have done similar analyses for NCAR, BlueWaters, and Bridges using the developed methodology and software framework.
6.
ACKNOWLEDGMENTS
This work is part of the XSEDE Metrics Service (XMS) project sponsored by NSF under grant number OCI-1025159. Lessons learned from FutureGrid have significantly influ-enced this work. Gathering publications was first pioneered by FutureGrid, influencing the development in the XSEDE portal. We would like to thank Matt Hanlon and Maytal Dahan for their efforts to integrate part of the services into the XSEDE portal.
7.
REFERENCES
[1] Compute Canada Report: Increasing Canadian Research Impact. Web Page. URL:
https://www.computecanada.ca/compute-canada-report-increasing-canadian-research-impact/.
[2] i-10 index|google scholar citations open to all. URL:
http://googlescholar.blogspot.com/2011/11/ google-scholar-citations-open-to-all.html. [3] ISI Web of Science. Web Page. URL:
http://wokinfo.com/.
[4] XDMoD Scientific Impact Portal for XSEDE. Web
Page. URL:https:
//sciimp.ccr.xdmod.org/xdportalpub/overview/.
[5] XSEDE. Web Page. URL:https://www.xsede.org/.
[6] J. Bollen, G. Fox, and P. R. Singhal. How and where the TeraGrid supercomputing infrastructure benefits
science.Journal of Informetrics, 5(1):114–121, 2011.
[7] J. Bollen, M. A. Rodriguez, and H. Van de Sompel. MESUR: Usage-based Metrics of Scholarly Impact. In
Proceedings of the 7th ACM/IEEE-CS Joint Conference on Digital Libraries, JCDL ’07, pages 474–474, New York, NY, USA, 2007. ACM. URL: http://doi.acm.org/10.1145/1255175.1255273, doi:10.1145/1255175.1255273.
[8] J. Bollen, H. Van de Sompel, and M. A. Rodriguez. Towards Usage-based Impact Metrics: First Results
from the Mesur Project. InProceedings of the 8th
ACM/IEEE-CS Joint Conference on Digital Libraries, JCDL ’08, pages 231–240, New York, NY, USA, 2008. ACM. URL:
http://doi.acm.org/10.1145/1378889.1378928, doi:10.1145/1378889.1378928.
[9] G. W. Brown, A. M. Mood, et al. On median tests for
linear hypotheses. InProceedings of the Second
Berkeley Symposium on Mathematical Statistics and Probability. The Regents of the University of California, 1951.
[10] L. Colledge. Snowball metrics recipe book. 2014, 2014. [11] L. Egghe. Theory and practise of the g-index.
Scientometrics, 69(1):131–152, 2006.
[12] C. Gormley and Z. Tong.Elasticsearch: The Definitive
Guide: A Distributed Real-Time Search and Analytics Engine. ” O’Reilly Media, Inc.”, 2015.
[13] J. E. Hirsch. An index to quantify an individual’s
scientific research output.Proceedings of the National
academy of Sciences of the United States of America, 102(46):16569–16572, 2005.
[14] W. H. Kruskal and W. A. Wallis. Use of ranks in
one-criterion variance analysis.Journal of the
0 10 20 30 40 50 60 70 80 90 Sc ie nc e N atu re Ph ys ic al Re vi ew D Str uc tu re Mo le cu lar S im ul ati on Am er ic an Jo ur nal o f B otan y Jo ur nal o f C om pu tati on al P hy si cs An nal s of B io m ed ic al E ng in ee rin g Mo nth ly N oti ce s of th e Ro yal A str on om ic al S oc ie ty Co m pu tin g in S ci en ce an d En gi ne er in g Jo ur nal o f B io m ol ec ul ar N MR Jo ur nal o f Hi gh E ne rg y Ph ys ic s Co m pu te r P hy si cs C om m un ic ati on s Bu lle tin o f th e Se is m ol og ic al S oc ie ty o f A m er ic a Mo le cu lar P hy lo ge ne tic s an d Ev ol uti on Jo ur nal o f P hy si cs : C on de ns ed Matte r Jo ur nal o f C om pu tati on al C he m is tr y Jo ur nal o f P hy si cs B N atu re Mate rial s As tr op hy si cal Jo ur nal S up pl em en t S er ie s Mo le cu lar P hy si cs An nu al Re vi ew o f A str on om y an d As tr op hy si cs Ph ys ic al Re vi ew B Jo ur nal o f A pp lie d Ph ys ic s Cl as si cal an d Q uan tu m G rav ity O pti cs E xp re ss N atu re S tr uc tu ral & Mo le cu lar B io lo gy Ph ys ic al Re vi ew L ette rs Jo ur nal o f Mo le cu lar B io lo gy Ph ys ic s of A to m ic N uc le i Jo ur nal o f C he m ic al T he or y an d Co m pu tati on Jo ur nal o f C he m ic al P hy si cs Jo ur nal o f C om pu te r-ai de d Mo le cu lar D es ig n Ph ys ic al Re vi ew E Jo ur nal o f P hy si cal C he m is tr y B N uc le ic A ci ds Re se ar ch Pr ote in s Jo ur nal o f P hy si cal C he m is tr y A N ew Jo ur nal o f P hy si cs Co nc ur re nc y an d Co m pu tati on : P rac tic e an d Lan gm ui r Ph ys ic al Re vi ew A PL O S G en eti cs Cr ys tal G ro w th & D es ig n Sc ie nti fic Re po rts Bi oi nf or m ati cs Ch em ic al P hy si cs L ette rs G eo ph ys ic al Re se ar ch L ette rs PL O S Co m pu tati on al B io lo gy Ph ys ic al C he m is tr y Ch em ic al P hy si cs Bi oc he m is tr y O pti cs L ette rs Ch em is tr y of Mate rial s Jo ur nal o f P hy si cal C he m is tr y C Che minfor m Jo ur nal o f B io lo gi cal C he m is tr y Pr oc ee di ng s of th e N ati on al A cad em y of S ci en ce s of Ac ta Mate rial ia N atu re C om m un ic ati on s Bi op hy si cal Jo ur nal In du str ial & E ng in ee rin g Ch em is tr y Re se ar ch In or gan ic C he m is tr y N an ote ch no lo gy Ap pl ie d Ph ys ic s Le tte rs eL ife PL O S O NE N an o Le tte rs Jo ur nal o f P hy si cal C he m is tr y Le tte rs An ge w an dte C he m ie Jo ur nal o f G eo ph ys ic al Re se ar ch AC S Catal ys is Jo ur nal o f C he m ic al In fo rm ati on an d Mo de lin g AC S N an o Ch em is tr y: A E ur op ean Jo ur nal Jo ur nal o f Me di ci nal C he m is tr y Bi om ac ro m ol ec ul es Jo ur nal o f th e Am er ic an C he m ic al S oc ie ty AC S Ap pl ie d Mate rial s & In te rf ac es Jo ur nal o f T he E le ctr oc he m ic al S oc ie ty Jo ur nal o f O rg an ic C he m is tr y O rg an ic L ette rs Mac ro m ol ec ul es Ac co un ts o f C he m ic al Re se ar ch Atm os ph er ic C he m is tr y an d Ph ys ic s
Figure 11: Average percentile ranking of XD publications by journal (by MS)
0 10 20 30 40 50 60 70 80 90 100 Str uc tu re Ph ys ic al Re vi ew D Jo ur nal o f B io m ol ec ul ar N MR Sc ie nc e Mo le cu lar P hy lo ge ne tic s an d Ev ol uti on Mo nth ly N oti ce s of th e Ro yal A str on om ic al S oc ie ty N atu re Am er ic an Jo ur nal o f B otan y Jo ur nal o f C om pu tati on al P hy si cs An nal s of B io m ed ic al E ng in ee rin g Co m pu te r P hy si cs C om m un ic ati on s PL O S G en eti cs Co m pu tin g in S ci en ce an d En gi ne er in g As tr op hy si cal Jo ur nal S up pl em en t S er ie s Jo ur nal o f P hy si cs : C on de ns ed Matte r Mo le cu lar P hy si cs Jo ur nal o f P hy si cs B N atu re Mate rial s Jo ur nal o f C he m ic al P hy si cs Mo le cu lar S im ul ati on An nu al Re vi ew o f A str on om y an d As tr op hy si cs Ph ys ic s of A to m ic N uc le i Jo ur nal o f C om pu te r-ai de d Mo le cu lar D es ig n Jo ur nal o f Hi gh E ne rg y Ph ys ic s Ph ys ic al Re vi ew B Jo ur nal o f A pp lie d Ph ys ic s Cl as si cal an d Q uan tu m G rav ity N atu re S tr uc tu ral & Mo le cu lar B io lo gy Bu lle tin o f th e Se is m ol og ic al S oc ie ty o f A m er ic a Jo ur nal o f C om pu tati on al C he m is tr y Ph ys ic al Re vi ew L ette rs Jo ur nal o f Mo le cu lar B io lo gy Jo ur nal o f C he m ic al T he or y an d Co m pu tati on Ph ys ic al Re vi ew E Jo ur nal o f P hy si cal C he m is tr y B Pr ote in s In or gan ic C he m is tr y Lan gm ui r Cr ys tal G ro w th & D es ig n Co nc ur re nc y an d Co m pu tati on : P rac tic e an d Ph ys ic al Re vi ew A O pti cs E xp re ss Jo ur nal o f P hy si cal C he m is tr y A Ch em ic al P hy si cs L ette rs Sc ie nti fic Re po rts G eo ph ys ic al Re se ar ch L ette rs N ew Jo ur nal o f P hy si cs N uc le ic A ci ds Re se ar ch Jo ur nal o f P hy si cal C he m is tr y C Jo ur nal o f B io lo gi cal C he m is tr y eL ife PL O S Co m pu tati on al B io lo gy Ch em is tr y of Mate rial s Bi oc he m is tr y Bi oi nf or m ati cs Ph ys ic al C he m is tr y Ch em ic al P hy si cs Pr oc ee di ng s of th e N ati on al A cad em y of S ci en ce s of N an ote ch no lo gy Ap pl ie d Ph ys ic s Le tte rs An ge w an dte C he m ie Ac ta Mate rial ia N atu re C om m un ic ati on s PL O S O NE N an o Le tte rs Jo ur nal o f C he m ic al In fo rm ati on an d Mo de lin g O pti cs L ette rs Che minfor m Jo ur nal o f P hy si cal C he m is tr y Le tte rs Jo ur nal o f G eo ph ys ic al Re se ar ch AC S N an o Ch em is tr y: A E ur op ean Jo ur nal AC S Catal ys is Bi om ac ro m ol ec ul es Jo ur nal o f T he E le ctr oc he m ic al S oc ie ty Bi op hy si cal Jo ur nal In du str ial & E ng in ee rin g Ch em is tr y Re se ar ch Jo ur nal o f Me di ci nal C he m is tr y Jo ur nal o f th e Am er ic an C he m ic al S oc ie ty O rg an ic L ette rs Jo ur nal o f O rg an ic C he m is tr y AC S Ap pl ie d Mate rial s & In te rf ac es Ac co un ts o f C he m ic al Re se ar ch Atm os ph er ic C he m is tr y an d Ph ys ic s Mac ro m ol ec ul es
Figure 12: Median percentile ranking of XD publications by journal (by MS)
[15] H. B. Mann and D. R. Whitney. On a test of whether one of two random variables is stochastically larger
than the other.The annals of mathematical statistics,
pages 50–60, 1947.
[16] T. Penfield, M. J. Baker, R. Scoble, and M. C. Wykes. Assessment, evaluations, and definitions of research
impact: A review.Research Evaluation, 23(1):21–32,
2014.
[17] P. Thomas and D. Watkins. Institutional research rankings via bibliometric analysis and direct peer review: A comparative case study with policy
implications.Scientometrics, 41(3):335–355, 1998.
[18] J. Towns, T. Cockerill, M. Dahan, I. Foster,
K. Gaither, A. Grimshaw, V. Hazlewood, S. Lathrop, D. Lifka, G. Peterson, R. Roskies, J. Scott, and N. Wilkins-Diehr. XSEDE: Accelerating Scientific
Discovery.Computing in Science Engineering,
16(5):62–74, Sept 2014.doi:10.1109/MCSE.2014.80.
[19] G. von Laszewski, F. Wang, G. C. Fox, D. L. Hart, T. R. Furlani, R. L. DeLeon, and S. M. Gallo. Peer comparison of xsede and ncar publication data. In
2015 IEEE International Conference on Cluster Computing, pages 531–532, Sept 2015.
doi:10.1109/CLUSTER.2015.98.
[20] F. Wang, G. von Laszewski, G. C. Fox, T. R. Furlani, R. L. DeLeon, and S. M. Gallo. Towards a scientific impact measuring framework for large computing
facilities - a case study on xsede. InProceedings of the
2014 Annual Conference on Extreme Science and Engineering Discovery Environment, XSEDE ’14, pages 25:1–25:8, New York, NY, USA, 2014. ACM. URL:
[image:8.612.79.533.49.241.2]