Query Computation Time and Its Performance over
Distributed Database Frameworks
D Ravikiran, S.V. Naga Srinivasu
Abstract It is essential to maintain a relevant methodology for data fragmentation to employ resources, and thus, it needs to choose an accurate and efficient fragmentation methodology to improve authority of distributed database system. This leads the challenges on data reliability, stable storage space and costs, Communication costs, and security issues. In Distributed database framework, query computation and data privacy plays a vital role over portioned distributed databases such as vertical, horizontal and hybrid models, Privacy of any information is regarded as the essential issue in nowadays hence we show an approach by that we can use privacy preservation over the two parties which are actually distributing their data horizontally or vertically. In this chapter, I present an approach by which the concept of hierarchal clustering applied over the horizontally partitioned data set. We also explain the desired algorithm like hierarchal clustering, algorithms for finding the minimum closest cluster. Furthermore, it explores the performance of Query Computation over portioned databases with the analysis of Efficiency and Privacy.
Keywords: Distributed Database, Vertical partition, Horizontal partition, query computation.
I. INTRODUCTION
The distributed database is different from the relational database (Non-distributed databases). The basic concept is the same in both types of database. The relational databases are centralized, only available at the single site. However, contrary to this, distributed databases are the databases that scattered at multiple sites, which connected via a network. This gives an advantage to the distributed database over the relational database. A distributed database system is one which utilizes sharing and replication to increase performance and improve reliability. When information partitioned, we could use different access patterns to spread load into the nodes in our audience sensibly, therefore not one of them gets helpless. In addition, if information replicated, our program might continue to operate whether a node becomes unreachable. Distributed programs open up several chances, but also present new challenges (view Eric Brewer's CAP Theorem). Specifically, it's not possible to ensure all of the ACID possessions if we have to satisfactorily withstand a deliberate failure in our supply system. Because of this, distributed systems need to make tradeoffs between availability and consistency when confronted with system collapse or latency.
Revised Manuscript Received on October 10, 2019
D Ravikiran, Research Scholar, Acharya Nagarjuna University, Nagarjuna Nagar, Guntur, Andhra Pradesh-522510, India.
S. V Naga Srinivasu, Professor, Narasaraopet Engineering College, Narasaraopet, Andhra Pradesh-522601, India.
Data Partitioning and Fragments Allocation in Distributed Database
a. Horizontal Fragmentation
In horizontal fragmentation, horizontal subsets of a relation which contains those of tuples which satisfy selection conditions (single or multiple attributes) are fragmented. All tuples which meet the requirement will create a subset which will be the horizontal fragment of the considered relation. It consists of all the columns of the original base relation. Horizontal fragmentation can be primary fragmentation (primary relation) and derived fragmentation (secondary relationships that are dependent on primary relation; related to foreign keys).
b. Vertical Fragmentation
In vertical fragmentation, the relation is partitioned vertically by columns. Each site may not need all the attributes of the relation. To keep all the vertical fragments connected (as there is no condition in creating vertical fragments), every fragment should include the primary key attribute of the parent relation.
c. Hybrid Fragmentation
The term hybrid means combination. In hybrid fragmentation, both horizontal and vertical fragmentation techniques used. This technique is flexible as the result of this technique minimizes irrelevant information. Reconstruction of the original table from this fragmentation is an expensive task. SELECT and PROJECT used in this fragmentation. Hybrid fragmentation can do in two different ways.
1. Parent relation is fragmented horizontally, and then vertical fragmentation is applied on one or more horizontal fragments.
2. Else, vertical fragmentation applies to the parent relation, and then horizontal fragmentation used on one or more vertical fragments.
Fragmentation: Benefits
There are many advantages to data fragmentation. The few advantages are as follow:
1) Security: The data that is required will only be available to authorized users; this will help to secure data from unauthorized users to access it.
2) Efficiency: The data that is needed will remain close to the host site. It will increase the ability of the system.
3) Parallelism: The different transactions can divide into sub-queries that will work on different fragments at the same time.
Significance of data Partitions over the distributed database.
This partitioning approach can assist decrease data access contention crosswise diverse parts of a system. Partitioning design can achieve the following things.
1. Scalability
2. Query performance 3. Availability
Designing Partitions for Scalability
It is essential to visualize and balance the size and workload of each compartment so that the data is distributed for maximum scalability.
To work out the partition scalability, follow these steps: Investigate application to concede data access models, so as size of return set of results for every query, the recurrence of access, internal latency, and processing requirements on the server.
1. Accept this examination to conclude modern and expected scalability targets, such as data volume and workload.
2. Assured that every partition becomes enough support to meet size requirements in terms of data volume and performance.
II. PARTITION DESIGN FOR QUERY PERFORMANCE
Query execution can usually improve by utilizing smaller datasets and identical queries. Every separation should include a small part of full dataset. This volume compression can widen your query performance. However, separation is not a choice to composing and adequately configuring a database.
To create query performance partitions, follow these steps: 1. Explore application requirements and run them
a. Use your business requirements to identify critical queries that should always be built quickly. b. Check the system to identify slow-moving issues c. Find the most frequent searches. Even if one
consultation involves minimal costs, the total consumption of resources can be significant. 2. Partition the data that is causing slow performance:
d. Limit the size of each partition so that the request response time is at the destination.
e. If you are using a horizontal partition, you create a snippet key so that the application can easily select the appropriate partition. This prevents the query from analyzing each partition.
f. Consider the location of the barrier. If possible, try to save data in partitions that are geographically close to applications and accessed by users.
A database model is a kind of data model that determines the logical structure of a database and also determines how data can be saved, organized and manipulated. The most used model of a database model is the relational model which uses the table format.
III. CHALLENGES IN DATA SEGMENTATION Few critical issues are
Distributed Query Processing:
procedures. The challenging question is how to choose a strategy for each issue over a network in the most cost-effective way. Factors to consider include data dissemination, communication costs and the lack of sufficient information at the local level
Heterogeneous Databases:
If there are no differences in data files in different locations, there are different ways to logically structure data (data model) or data access mechanisms (language).
Distributed Concurrency Control:
Concurrency control is essential for the restoration of each system if two or more database transactions simultaneously access the same data element. A well-established theory of viable control of database systems has been developed: How to manage data partition in a distributed database
environment.
Support for a particular level of transactions: what kind of consistency guarantees support? Most distributed databases are compatible with single row during updates. Some distributed databases can support multi-row transactions as long as they are in one data compartment. Common databases are usually incompatible with strong ACID semantics.
Data are serving latencies. The DDB as the HBase of the LSM edition model is stored in the WAL log, retaining the recently ordered written documents. The data requested in memory is periodically downloaded to disk. WAL enters until the reels take place so that data lost through node errors can be restored to consciousness. This helps to ensure high recording speed performance, as the only attachment that reaches the drive is the WAL attachment.
Data backup level (must be repeated between clusters or cluster)
Application level hooks so that allowing applications to synchronize the operating server synchronously (for example, the HBase end-processor endpoint or SGBMS-stored procedures) or asynchronous (eg HBase co-processor viewer or RDBMS activators).
Consequence of Data Fragmentation. The overall effect of Fragmentation is
1. Better transaction scope. 2. No irrelevant data is available. 3. Security And efficiency increase. 4. Storage Space is needed more. 5. Complexities in terms of Reconstruction arise.
IV. QUERY COMPUTATION AND PERFORMANCE OVER PORTIONED DISTRIBUTED
DATABASES.
Clustering is widely used in many real-time areas, such as business, marketing, medicine, chemicals, insurance, machine cleaning, data acquisition, and many more. Clustering is an approach which is ideal in case we're working with a few compassionate information or perhaps info. The privacy is the primary concern since there are chances that are many that the info is a leak. Hence clustering is the best procedure to make the confidentiality strong Clustering is generally believed that in case we're clustering some information then we've to find the data which is most comparable in their properties hence they're a cluster in a single team. Each team differs from the various other groups both in size, selection of items and the dimension of theirs as well as they've different details types.
V. VERTICAL FRAGMENTATION
QUOTE and POLICY are both tables, and these belong to two different subject areas in the Insurance industry. QUOTE Table: In the Insurance industry, the policy system is starts from the underwriting the policy and that's become a quotation. Once that quotation is approved from management/policyholder it will be converted to actual policy. So basically, QUOTE table contains the information that quotation id, start date, end date, household number, address, term, etc.
Description:
QUOTE table is the relational database object in DB2 applications. It has the different values of a policy quote example quote id – it is the uniquely identified number of a quotation, eff_dt, and end_eff_dt are defined about the quote expiration. Along with this, the other columns represent the details about the quote. And we identified a few columns as not null columns because the data must be expected from source and used in the reporting.
POLICY Table: As per the information above, once the quotation is approved, it will be converted to actual policy. So, POLICY table here having the policy number, term date, start date, end date, coverage, household number, etc. Description:
POLICY table is the relational database object in DB2 applications. It has the different values of a policy example policy_id_sk – it is the uniquely identified number of policy, eff_dt, and end_eff_dt are defined about the quote expiration. Along with this, the other columns define the details about the system. And we identified a few columns as not null columns because the data must be expected from source and used in the reporting.
To maintain the integrity and increase data mining process data will be stored in a single table called to QUOTE_POLICY table. It has complete information on how many records are being converted to POLICY and how many are not yet.
In addition to this, some attributes added to QUOTE_POLICY table to secure processing of data representation and it should mean full.
Structure of QUOTE_POLICY table: Table 1 Structure of QUOTE_POLICY table
At a time, you can see the entire information of the data in a single table this can be achieve using Informatics power center.
This data in QUOTE_POLCY table can be a view, and it gives fast processing by running the query in DB2. This vertical representation of the data is quite fast
compared to two different tables separately and the accuracy of the results.
Vertical partitioning creates different tablespaces in DB2 and stores data in different tablespaces based on the key columns. It has more security as it stores data in a single table and backend it has different tablespaces.
VI. RESULTS & DISCUSSION Scenario 1:
Get the number of policies is being created on a single day, each policy having different coverage’s and capable of the coverage and the policy.
Query:
Explanation:
In this report query, have selected the policy_id_sk, quote_id, soi_id, and coverage type code and its effective date of the policies from the QUOTE_POLICY tables.
Have joined QUOTE_POLICY and EDW_AUTO_SOI_CVG table base on PLCY_DI_SK key column and filtering the data on DW_CR_TMSP. DW_CR_TMSP is the timestamp column, and it
Output:
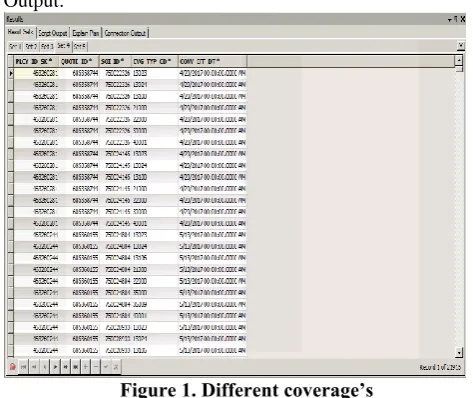
Figure 1. Different coverage’s
Explanation:
The output shows the different coverages has been taken for the single policy and with its particular quote id.
4/20/2017 dated list of the systems and its separate coverage details.
[image:4.595.309.542.96.159.2]Script output:
Figure 7.2 Output screen of vertical partitioning on the EDW_QUOTE_PLCY table.
Explanation:
It took 00:00:28,505 to return the output and it has to vertical partitioning on the EDW_QUOTE_PLCY table. Scenario 2:
Frequently used coverage code/name among the policies which are being created on a single day.
Query:
Explanation:
Have written the query to fetch for a single day 4/20/2017polices in this scenario.
Selected coverage type codes and their name along with the count of coverages.
Joined QUOTE_POLICY table with EDW_QUOTE_SOI_CVG on the PLCY_ID_SK and filtering with the date of 4/20/2017.
And Sendit to the QUOTE table otherwise process will be
Output:
COLLISION coverage is mostly taking i.e. 7241 counts is taking through all the policies in a single day.
Explanation:
Their multiple coverages have recorded on a single day, among them, collision coverage with coverage type code 13024 has rated as the most frequently used coverage and personal injury protection coverage with 12023 coverage type code is 7229. Script output:
Explanation:
It took 0:00:29,057 times to complete the execution of the above query.
Scenario 3:
Many households are taking many policies in a single day. Query:
Explanation:
SRC_SYS_HH_NUM is the primary policyholder number. Policy can insure on the same householder/primary policyholder or others. The query is written to select the count of
householders who had been taken the new policies or modified the policies on a single day.
Joined the QUOTE_POLICY table with EDM_AUTO_SOI_CVG on the POLICY_ID_SK column filtering with dated of a single day.
Output:
Explanation:
5337 households are the average count who is obtaining the new policies and includes the policies which modified on a single day.
[image:4.595.305.548.617.675.2]Script output:
Explanation:
It took 0:00:16,708 times to complete the above query.
Scenario 4:
Total coverage amounts of each policy of all the coverages under the same policy turned in a single day.
Query:
Explanation:
Joined QUOTE_POLICY table with EDW_AUTO_SOI_CVG table based on the POLICY_ID_SK column and filtering on the single day 4/20/2017.
Sum of coverage amount from the EDW_AUTO_SO_CVG table and cluster by the policy id sk. It returns each policy and the coverage amount of all the coverages.
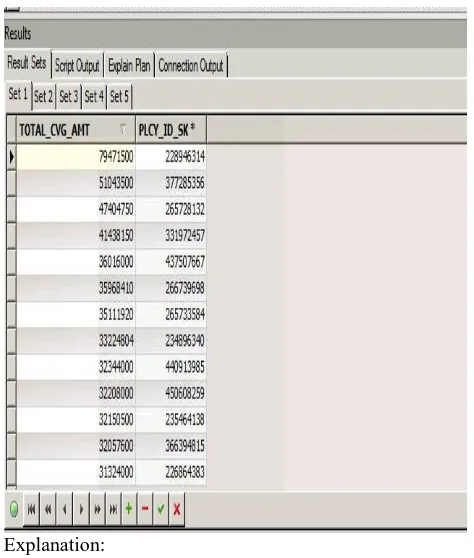
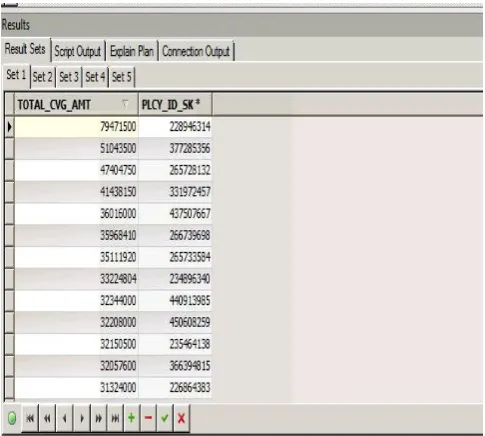
Output:
Explanation:
The coverage amount is for the sum of all the coverages of a single policy. If we execute the query against individual coverages of the policy may reduce the amount. It shows the total coverage amount of a policy including all coverages of within the time period.
Script output:
Explanation:
It took 0:00:11,651 times to execute this query.
Table 7.4 Performance Evaluation: Scenario Partition
Type
Query Query
execution time (in Seconds)
1 Vertical Number of
Policies made in a single day
00:00:28,505
2 Vertical Collision Coverage
0:00:29,057
3 Vertical Number of
households are taking the number of policies in a single day
0:00:16,708
4 Vertical Total coverage amounts of each policy of all the coverages under the same policy turned in a single day.
[image:5.595.45.282.402.681.2]0:00:11,651
Figure 2 Performance of Vertical Query Computation Horizontal Fragmentation
Below scenario has been tested after horizontal partitioning the EDW_QUOTE_PLCY table.
Scenario 1:
Get the number of policies is being created on a single day, each policy having different coverages and capable of the coverage and the policy.
In this report query, have selected the policy_id_sk, quote_id, soi_id, and coverage type code and its effective date of the policies from the QUOTE_POLICY tables.
Have joined QUOTE_POLCY and
EDW_AUTO_SOI_CVG table base on PLCY_DI_SK key column and filtering the data on DW_CR_TMSP. DW_CR_TMSP is the timestamp column, and it
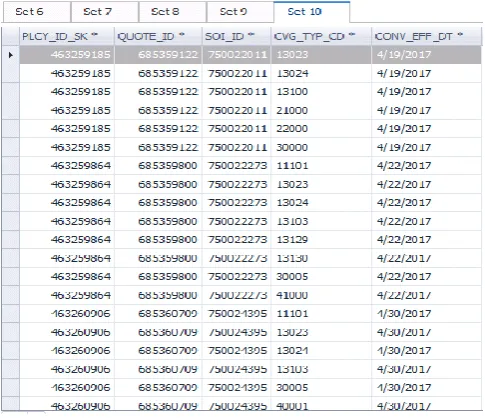
indicates that when the record inserted into the table. Output:
Explanation:
The output shows the different coverages has been taken for the single policy and with its particular quote id.
4/20/2017 dated list of the policies and its coverage and so details.
Script output:
It took 00:00:01,450 to return the output and it has to horizontal partitioning on the EDW_QUOTE_PLCY table.
Scenario 2:
Frequently used coverage code/name among the policies which are being created on a single day.
Query:
Explanation:
Have written the query to fetch for a single day 4/20/2017 polices in this scenario.
Selected coverage type codes and their name along with the count of coverages.
Joined QUOTE_PLCY table with EDW_QUOTE_SOI_CVG on the PLCY_ID_SK and filtering with the date of 4/20/2017.
Output:
COLLISION coverage is mostly taking, i.e. 7241 counts is taking through all the policies in a single day.
Explanation:
Their multiple coverages have been recorded on a single day, among them, collision coverage with coverage type code 13024 has been rated as the most frequently used coverage and personal injury protection coverage with 12023 coverage type code is 7229. Script output:
It took 0:00:02,435 time to complete the execution of the above query.
Scenario 3:
few households are taking some policies in a single day. Query:
Explanation:
SRC_SYS_HH_NUM is the primary policyholder number. Policy can insure on the same householder/primary policyholder or others.
[image:6.595.48.291.312.521.2]policies or modified the policies on a single day. Joined the QUOTE_PLCY table with
EDM_AUTO_SOI_CVG on the POLICY_ID_SK column filtering with dated of a single day.
Output:
5337 households are the average count who is taking policies a single day.
Explanation:
5337 households are the average count who is obtaining the new policies and includes the policies which are modified on a single day.
Joining with coverage table gives the appropriate list of household which are under the different policies. Script output:
It took 0:00:04,088 time to complete the above query.
Scenario 4:
Total coverage amount of each policy of all the coverages under the same policy turned in a single day.
Query:
Explanation:
Joined QUOTE_PLCY table with EDW_AUTO_SOI_CVG table based on the PLCY_ID_SK column and filtering on the single day 4/20/2017.
Sum of coverage amount from the EDW_AUTO_SO_CVG table and cluster by the policy id sk. It returns each policy and the coverage amount of all the coverages.
Output:
Explanation:
The coverage amount is for the sum of all the coverages of a single policy. If we execute the query against individual coverages of the policy may reduce the amount. It shows the total coverage amount of a policy including all coverages of within the period.
Script output:
It took 0:00:05,226 time to execute this query.
Explanation:
[image:7.595.306.549.49.267.2] It took 0:00:05,226 time to execute this query.
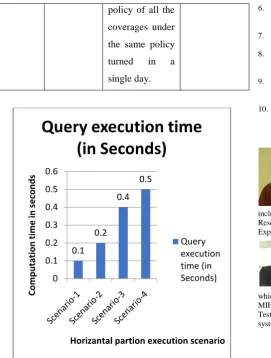
Table 3 Horizontal Partition Performance Evaluation: Scenario Partition
Type
Query Query
execution time (in Seconds) 1 Horizontal Get the number
of policies created on a single day.
00:00:01,450
2 Horizontal Collision Coverage.
0:00:02,435
3 Horizontal Some
households are taking some policies in a single day.
0:00:04,088
4 Horizontal Total coverage amounts of each
[image:7.595.60.273.150.208.2]policy of all the coverages under the same policy turned in a single day.
Figure 3 Horizontal Partition Execution Performance Scenarios
VII. CONCLUSION
This paper presents an Efficiency and Privacy Analysis on Distributed Data Base concerning insurance policy dataset, also compared the performance of portioned query computation among Vertical, Horizontal and mixed or regular framework. Also, presents the Efficiency and Privacy Analysis with Clustering approach over partitioned databases.Finally, we conclude the query optimization and privacy measuring over portioned distributed database models with Insurance policy benchmark datasets. QUOTE and POLICY are the both tables and these belongs to two different subject areas in Insurance industry, which are used as two party computations. We have measured the query computation performance, efficiency and Privacy Analysis with Clustering approach.
REFRENCES
1. Baião, Fernanda et al. “Horizontal Fragmentation in Object DBMS:
New Issues and Performance Evaluation.” (2000).
2. Bellatreche, Ladjel et al. “Horizontal Class Partitioning in
Object-Oriented Databases.” DEXA (1997).
3. Ceri S, Negri M, Pelagatti G. “Horizontal data partitioning in database
design." Proceedings of the 1982 ACM SIGMOD international conference on Management of data. ACM. 1982; 128-136.
4. Cheung, David Wai-Lok et al. “Efficient Mining of Association Rules
in Distributed Databases.” IEEE Trans. Knowl. Data Eng. 8 (1996): 911-922.
5. Drissi, A. et al. “Horizontal fragmentation for fuzzy querying
6. Ezeife, Christie I. and Ken Barker. "Distributed Object-Based Design:
Vertical Fragmentation of Classes." Distributed and Parallel Databases 6 (1998): 317-350.
7. Taneja, Shweta et al. "A Review on Privacy-Preserving Data Mining:
Techniques and Research Challenges.” (2014).
8. D. Ravikiran& Dr. S.V.N Srinivasu,“An Efficient Mapreduce-based
System to Find User likeness on Social Networks”, ISSN: 0975-4172, Volume 15, issue 7.
9. D Ravikiran and S V N Srinivasu. “Regular Pattern Mining on Crime
Data Set using Vertical Data Format”. International Journal of Computer Applications 143(13):42-45, June 2016.
10. Tassa, Tamir. “Secure Mining of Association Rules in Horizontally
Distributed Databases.” IEEE Transactions on Knowledge and Data Engineering 26 (2014): 970-983.
AUTHOR PROFILE
D Ravikiran, completed his M.Tech in Computer Science & Engineering and pursuing PhD in Computer science and engineering from Acharya Nagarjuna University, Nagarjuna Nagar, Guntur, Andhra Pradesh 522510, India. His area of interest includes data analytics, Big data, and machine learning. He published 20+ Research papers in different domains and had 16+ years of Teaching Experience.
Dr.S.V.NagaSrinivasu, Professor, Computer science and engineering, Narasaraopeta Engineering College, Narasaraopet, Andhra Pradesh 522601, India. He has published more than 58 articles in reputed journals which includes Scopus and other indexed bodies. He is a member of IEEE, MIET. His area of interest includes Software Engineering, Software Testing, Machine Learning, Deep learning, Mobile Networking, Operating systems, Data Mining, Image Processing and Black chain technology.
0.1 0.2
0.4 0.5
0 0.1 0.2 0.3 0.4 0.5 0.6
Co
m
p
u
tat
io
n
tim
e
in
se
co
n
d
s
Horizantal partion execution scenario