International Journal of Innovative Technology and Exploring Engineering (IJITEE) ISSN: 2278-3075,Volume-8 Issue-12, October 2019
Abstract: In this study the effect and optimisation of machining parameters on surface roughness in a facing operation of Ti6Al4VELI by single point diamond machining have been investigated. The experimental studies carried under varying cutting speeds, feed rates, different tool nose radius and depths of cut. The orthogonal array, signal-to-noise ratio (S / N) and variance analysis (ANOVA) were used to examine the performance characteristics of the Ti6Al4VELI alloy turning by using single-point diamond cutting tool. The influential factors on the surface roughness after machining are feed rate and cutting speed after the conclusions revealed. Whereas the feed rate had the most significant effect on tool life. Minimal surface roughness achieved after machining is in nano-level which is better than other conventional precision machining.
Keywords: Taguchi method, Analysis of variance (ANOVA), Ti6Al4VELI, Signal-to-noise (S/N) ratio, Surface roughness.
I. INTRODUCTION
The use of Titanium alloys (Ti6Al4VELI) in a variety
of fields, such as biomedical, aviation and automotive makes it a versatile material[1]. It is a α+β two-phase alloy, aluminium as α and vanadium as a β stabiliser. The exceptional resistance to corrosion and superior biocompatibility of titanium and its alloys are due to their outstanding mechanical characteristics and the thin oxide layer of the surface[2][3]. As it is having low density and good elastic modulus which makes these metals mechanically closer to those of bones. Titanium and its alloys are one of the few materials that naturally meet the human body's implantation demands due to their lightness, strength and biocompatibility[4].Ti-6Al-4V (grade 5) and pure titanium (cp Ti, grade 2) alloys are used as commercial material in the biomedical field among all the titanium and its alloys [5]. They are commonly used in artificial bones, joints and dental implants. An articulating bearing consisting of Femoral head and cup which is the part of Artificial hip joints and stem are one of the most common applications of titanium alloys [6][7].Revised Manuscript Received on October 05, 2019
Nitish Chandra, present, pursuing Master of Engineering (Manufacturing Technology) from NITTTR, Chandigarh.
Dr. Sukhdeep Singh Dhami
professor and Head of the Department in Mechanical Engineering at the NITTTR-Chandigarh.
In such demands, Titanium alloys parts have tribological contact made from different material like dissimilar metal, polymers and other media under different conditions like dynamic or stationary loading along with various temperatures[8]. These interactions can cause numerous negative impacts on titanium parts, such as corrosion, elevated friction and even seizures such as galvanic and crevice corrosion, leading to early failure of implanted devices[9]. Improving surface quality for titanium and its alloys are, therefore to control or prevent these effects and to extend the lifetime of the implant[10]. Ultra-precision machining seeks to produce high-quality products for sophisticated components in terms of shape precision, surface finish and dimensional integrity [11]. In Ultraprecision machining Diamond turn machining have been used[12]. In Diamond Turn machining Single point diamond tool is used to machine the workpiece. When conventional precision machines can generate surfaces with accuracy level better than 1 μm, diamond turn machines can produce a similar surface within a few tens of nm accuracy[13][14].
II. MATERIAL AND METHODS
Workpiece material, Tool material and methods have been discussed below.
A. Workpiece material
Titanium is available in several different grades. Titanium alloys are categorized into three primary groups, such as α-phase, β-phase and α-β phase. Workpiece material before machining is shown in Figure 2.1.1.
Figure2.1.1 Workpiece material before machining Ti6Al4VELI alloy is an alpha-beta wrought alloy.Ti6Al4VELI (grade 23) is very similar to Ti6Al4V (Grade 5), except that Ti6Al4VELI contains lower concentrations of oxygen
Optimisation of Cutting Parameters for Minimal
Surface Roughness in Single Point Diamond
Turning of TI6AL4VELI
TI6AL4VELI
and carbon where ELI stands for “Extra Low Interstitials”, [image:2.595.46.289.132.327.2]and These reduced interstitials provide enhanced ductility [15].Ti6Al4VELI alloy with a diameter of 2mm was utilized as the raw material. Physical and Chemical Properties of Workpiece are shown in Table 2.1.1.
Table 2.1.1 Physical and Chemical Properties of Workpiece
Physical Properties of workpiece Part
Density
Ultimate Tensile Strength
Yield Strength
Elongation at Break
Vickers hardnes s[HV] 4.41g/cm3 1290 ± 80
MPa
1150 ± 80 MPa
8 ± 4% 320 ± 15
Chemical Properties of Workpiece
Element Ti Al V C O S
Weight %
88.49 6.10 3.89 1.13 0.28 0.16
Atomic %
79.59 9.32 4.45 5.40 1.15 0.09
B. Tool Material
Single crystal diamond instrument has a small affinity to the materials used in ultra-precision cutting and can be rendered with a very sharp cutting edge. It is recognized to be an ideal ultra-precision cutting tool. Exact contoured surfaces and highly accurate devices are to be produced by diamond cutting tool.For ultra-precision machining of targeted workpiece single point diamond tool with nose radius of 1mm and 5mm with zero rake angle used for facing operation. Different tool nose radius of diamond tool is shown in fig 2.1.1.
Figure 2.1.1 Single point diamond tool with different nose radius
C. Experimental Procedure
On a two-axis CNC (Nanoform 200 from Precitech) ultra-precision machine, all Diamond cutting tests were carried out .Wide literature survey have been carried out to select cutting parameters on diamond turning. MINITAB 17 Software is used to analyse the variance and for making the design of experiments. After machining all combination the Surface roughness of workpieces was measured using CCI optical profilers (Non-contact type).
D. Design of experiments (DoE) and observations DoE is the most efficient technique for optimizing process parameters where various parameters are employed. Numbers of trials reduced by utilizing the Taguchi method [16]. It will be too expensive and time-consuming to machine all combinations of tests, thus avoiding all these combinations, an orthogonal array with the minimum amount of tests have been performed. An orthogonal matrix is selected for this
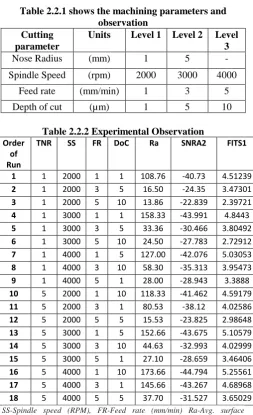
[image:2.595.303.557.206.622.2]study, L18, which is a multilevel experiment. So, cutting speed, feed rate, depth of cut and nose radius was selected as input parameters whose values were selected from the existing literature. Three levels of each parameter were chosen for testing in the current research. The chosen range of cutting speed was (2000 to 4000 rpm), the feed rate was (1 to 5 mm/min) and depth of cut was (1 to 10 µm). There are two levels for tool nose radius so for this we are going for mixed-level for making DOE. To compare the machining of Ti6Al4VELI is done with a single point diamond tool in cutting mentioned above conditions. Machining parameters and observation are shown in Table 2.2.1.
Table 2.2.1 shows the machining parameters and observation
Cutting parameter
Units Level 1 Level 2 Level 3
Nose Radius (mm) 1 5 -
Spindle Speed (rpm) 2000 3000 4000
Feed rate (mm/min) 1 3 5
Depth of cut (µm) 1 5 10
Table 2.2.2 Experimental Observation Order
of Run
TNR SS FR DoC Ra SNRA2 FITS1
1 1 2000 1 1 108.76 -40.73 4.51239 2 1 2000 3 5 16.50 -24.35 3.47301 3 1 2000 5 10 13.86 -22.839 2.39721 4 1 3000 1 1 158.33 -43.991 4.8443 5 1 3000 3 5 33.36 -30.466 3.80492 6 1 3000 5 10 24.50 -27.783 2.72912 7 1 4000 1 5 127.00 -42.076 5.03053 8 1 4000 3 10 58.30 -35.313 3.95473 9 1 4000 5 1 28.00 -28.943 3.3888 10 5 2000 1 10 118.33 -41.462 4.59179 11 5 2000 3 1 80.53 -38.12 4.02586 12 5 2000 5 5 15.53 -23.825 2.98648 13 5 3000 1 5 152.66 -43.675 5.10579 14 5 3000 3 10 44.63 -32.993 4.02999 15 5 3000 5 1 27.10 -28.659 3.46406 16 5 4000 1 10 173.66 -44.794 5.25561 17 5 4000 3 1 145.66 -43.267 4.68968 18 5 4000 5 5 37.70 -31.527 3.65029
SS-Spindle speed (RPM), FR-Feed rate (mm/min) Ra-Avg. surface roughness (nm), DoC-depth of cut (µm)
The signal-to-noise ratio (S / N) is calculated for each factor
level combination .S/N ratio Smaller-is-better using base 10
log the formula for this is
Where Y = factor level combination response n = number of factor-level combination responses
[image:2.595.84.252.446.548.2]International Journal of Innovative Technology and Exploring Engineering (IJITEE) ISSN: 2278-3075,Volume-8 Issue-12, October 2019
III. ANALYSIS AND THE DISCUSSION OF EXPERIMENTAL RESULTS
After machining, the roughness of the machined workpiece is evaluated by coherence correlation interferometer (CCI) taylor hobson which is a type of Non-Contact Optical Profiler
Figure 3.1 Surface Roughness Comparison Plot Table 2.2.2 Shows the best surface roughness plots obtained from the optical profiler in 3rd run i.e. by tool of 1 mm nose radius at a speed of 2000 rpm, 5mm/min feed rate and 10 µm depth of cut. Table 3.1 shows the comparison of surface roughness among 1 mm nose radius and 5 mm nose radius of tool.
Table 3.1 Surface Roughness of workpiece SEM image OoR Ra A(50µm) B(100µm)
3rd 13.86 7
4rd 158.3 3
12rd 15.33 3
16rd 173.6 7
OoR-Order of Run, Ra-Average Roughness (nm-nanometer) A. Taguchi’s Analysis of Surface Roughness
Taguchi analysis is used to design the experiments and then to research the findings obtained on MINITAB 17. It is easier to approach S / N ratio for the evaluation purpose and it has been observed that the smaller approach is better [18]. The S / N ratio describes the impacts of uncontrollable variables on the response factors. In the response charts delta is the change from the highest limit to the lower limit. and rank is the sequence in which variables influence the response
[image:3.595.47.301.119.219.2]parameter[19 ]. Tables 3.1.1 indicate the mean surface roughness response table and table 3.1.2 indicates the response table of S/N Ratio for Surface Roughness.
Table 3.1.1: Response Table for Mean for Surface Roughness
Level Nose
Radius(mm)
Spindle Speed
Feed Rate
DoC
1 63.18 58.92 139.79 91.40
2 88.43 73.43 63.17 63.79
3 95.06 24.45 72.22
Delta 25.24 36.13 115.34 27.61
[image:3.595.304.556.255.350.2]Rank
4
2
1
3
Table 3.1.2: Response Table of S/N Ratios for Surface Roughness
Level Nose
Radius(mm)
Spindle Speed
Feed Rate
DoC 1 -32.94 -31.89 -42.79 -37.29 2 -36.48 -34.59 -34.08 -32.65
3 -37.65 -27.26 -34.20
Delta 3.54 5.77 15.53 4.63
Rank 4 2 1 3
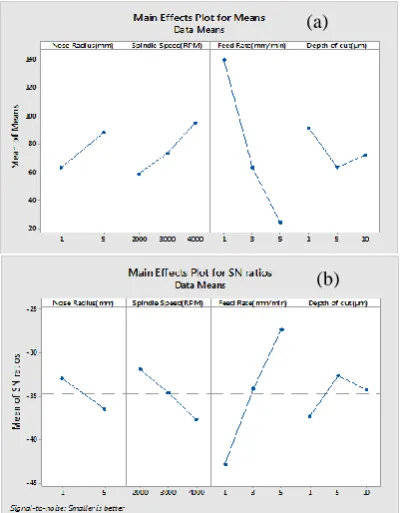
[image:3.595.45.289.331.675.2]These charts indicate that feed rate has the greatest impact on surface roughness, accompanied by machining, then spindle speed and depth of cut, but nose radius has the lowest impact on surface roughness. Figure 3.1.1 show Main effects plots for means and figure 3.1.2. Shows S/N ratios of the surface roughness.
Figure 3.1.1 (a) Main effects plots for means (b) S/N ratios of the surface roughness
(a)
[image:3.595.330.531.428.685.2]TI6AL4VELI
It can be interpreted from the plots that by machining of 1 mmtool nose radius, minimum surface roughness is obtained. In the situation of Depth of cut, it can be seen that the surface roughness first reduces with an increase in DoC and then rises. At 5 μm depth of cut surface roughness is minimum. For feed rate, the surface roughness reduces with a rise in feed rate and at 5 mm / min feed the finest surface finish is achieved. Spindle speed model with surface roughness variation is just contrary to feed rate, i.e. surface roughness increases with spindle speed rise. The minimum surface roughness is acquired at 2000 rpm from the result. From the above assessment, it can be stated that machiningofTi6Al4VELI workpiece with 1 mm tool nose radius at a reduced velocity with intermediate feed rate with a higher cutting depth in order to achieve minimum surface roughness.
[image:4.595.304.553.51.171.2]B. Regression Analysis of Surface Roughness
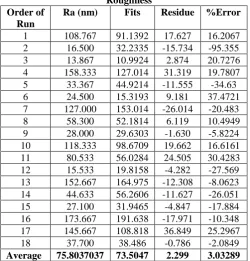
Table 3.2.1 demonstrates the actual surface roughness scores acquired after the tests, the fit characteristics forecast by the ANOVA system and the distinction between the actual value and fits shown by residue. The average error measured from experiment is 3.03289% from Table 3.2.1.
Table 3.2.1: Actual and Predicted Values of Surface Roughness
Order of Run
Ra (nm) Fits Residue %Error 1 108.767 91.1392 17.627 16.2067 2 16.500 32.2335 -15.734 -95.355 3 13.867 10.9924 2.874 20.7276 4 158.333 127.014 31.319 19.7807 5 33.367 44.9214 -11.555 -34.63 6 24.500 15.3193 9.181 37.4721 7 127.000 153.014 -26.014 -20.483 8 58.300 52.1814 6.119 10.4949 9 28.000 29.6303 -1.630 -5.8224 10 118.333 98.6709 19.662 16.6161 11 80.533 56.0284 24.505 30.4283 12 15.533 19.8158 -4.282 -27.569 13 152.667 164.975 -12.308 -8.0623 14 44.633 56.2606 -11.627 -26.051 15 27.100 31.9465 -4.847 -17.884 16 173.667 191.638 -17.971 -10.348 17 145.667 108.818 36.849 25.2967 18 37.700 38.486 -0.786 -2.0849 Average 75.8037037 73.5047 2.299 3.03289
Figure 3.2.1 shows the experimental and the predicted values of the surface roughness by the ANOVA model and gives a comparison between both of them. In the plot order of run is shown on the horizontal axis while on vertical axis surface roughness. Figure 3.2.1 reflects and compares the test and expected surface roughness results from the ANOVA model.
Figure 3.2.1 Experimental and Fitted Values for Surface Roughness
[image:4.595.303.548.234.323.2]Figure 3.2.2 shows the Residue Chart for Surface Roughness. In this plot Zero is the reference line and variations is described above and below this line.
Figure 3.2.2: Residue Chart for Surface Roughness In this chart, Residue is represented on the vertical axis while order of run on the horizontal. Analysis of surface roughness is shown by the ANOVA table mentioned in Table 3.2.2.
Table 3.2.2: ANOVA Table for Surface Roughness Source Adj
SS
Adj MS
F-Valu e
P-Va lue
%
PCR Remark Regressi
on 11.97 2.994 28.89 0
Spindle
Speed 1.322 1.322 12.76 0.003 9.922 2 Feed
Rate 9.584 9.584 92.49 0 71.93 1
DoC 0.323 0.323 3.12 0.101 2.428 4
Nose
Radius 0.746 0.746 7.2 0.019 5.599 3
Error 1.347 0.103
Total 13.32
1-most significant, 2-moderate significant, 3-least significant, 4-non significant
Model is significant when the p value should be less than 0.05. From the table it is shown that that feed rate is a most valuable parameter for the surface roughness while Tool nose radius is less significant source ,there is not any significace of depth of cut means to say that not much effect by changing DoC and most significant is feed rate which will effect the surface roughness more. Table 3.2.3 shows that R-sq is 95.08% which is compared with the predicated value of 90.00% about its mean from the model summary for surface roughness.
Table 3.2.3: Model Summary for Surface Roughness S R-Sq. R-Sq.(Adj) R-Sq.(Pre) 0.019321
0
95.08
% 93.56% 90.00%
[image:4.595.39.290.345.607.2]International Journal of Innovative Technology and Exploring Engineering (IJITEE) ISSN: 2278-3075,Volume-8 Issue-12, October 2019
Table 3.2.4: Unusual Run Data for Surface Roughness
S R-sq R-sq(adj) R-sq(pred)
0.321911 89.89% 86.78% 81.94%
Regression equations acquired by the Taguchi model are shown in equation 4.1 and 4.2.
Regression Equation for 1mm tool nose radius ln( Ra) = 4.332 + 0.000332 Spindle Speed(RPM) - 0.4469 Feed Rate(mm/min) - 0.0364 Depth of cut(µm) ………...equation 4.1
Regression Equation for 5mm tool nose radius ln(Ra) = 4.739 + 0.000332 Spindle Speed(RPM) - 0.4469 Feed Rate(mm/min)
- 0.0364 Depth of cut(µm)……...………...equation 4.2
IV. CONCLUSION
In this study, the optimisation of turning operations has been investigated and presented on the surface roughness based on the parameter design of the Taguchi method. Based on the analysis of results it may be concluded that the 3rd Order of run for 1mm tool nose radius and 12th order of run for 5mm tool nose radius settings are the optimal machining parameters for surface roughness, respectively. Based on the analysis of variance (ANOVA) results and from the experimental results and derived analysis, one can conclude that feed Rate has the most dominant effect on the observed surface roughness, followed by cutting speed, depth of cut and effect of tool nose radius. Tool nose radius has the least effect whose influences on surface roughness are smaller. Minimal surface roughness achieved after machining is 13 nm. There is improvement of 300 % in surface roughness after optimal machining.
REFERENCES
1. S. DE VITERI AND E.FUENTES,“TITANIUM AND TITANIUM ALLOYS AS
BIOMATERIALS,”TRIBOL.-FUNDAM.ADV.,2013.
2. F. Trevisan et al., “Additive manufacturing of titanium alloys in the biomedical field: processes, properties and applications,” J. Appl. Biomater. Funct. Mater., vol. 16, no. 2, pp. 57–67, 2018.
3. M. Niinomi, “Biologically and Mechanically Biocompatible Titanium Alloys,” Mater. Trans., vol. 49, no. 10, pp. 2170–2178, 2008. 4. M. Niinomi, Y. Liu, M. Nakai, H. Liu, and H. Li, “Biomedical titanium
alloys with Young’s moduli close to that of cortical bone,” Regen. Biomater., vol. 3, no. 3, pp. 173–185, 2016.
5. L. Crespo et al., “On the interactions of human bone cells with Ti6Al4V thermally oxidised utilising laser shock processing,” Biomed. Mater., vol. 11, no. 1, 2016.
6. C. N. Elias, J. H. C. Lima, R. Valiev, and M. A. Meyers, “Biomedical applications of titanium and its alloys,” Jom, vol. 60, no. 3, pp. 46–49, 2008.
7. C. F. Cheung and W. B. Lee, “Materials and Manufacturing Processes Study of Factors Affecting the Surface Quality in Ultra-Precision Diamond Turning Study of Factors Affecting the Surface Quality in Ultra-Precision Diamond Turning,” Mater. Manuf. Process., vol. 15, no. 4, pp. 481–502, 2000.
8. G. Li, S. Yi, S. Sun, and S. Ding, “Wear mechanisms and performance of abrasively ground polycrystalline diamond tools of different diamond grains in machining titanium alloy,” J. Manuf. Process., vol. 29, pp. 320–331, 2017.
9. M. Zhou, B. K. A. Ngoi, and X. J. Wang, “Tool wear in ultra-precision diamond cutting of non-ferrous metals with a round-nose tool,” Tribol. Lett., vol. 15, no. 3, pp. 211–216, 2003.
10. M. J. Raghavendra, C. G. Ramachandra, T. R. Srinivas, and M. Prashanth Pai, “Optimization of Surface Roughness in Turning Operation in Machining of Ti-6AL-4V (Titanium Grade -5),” IOP Conf. Ser. Mater. Sci. Eng., vol. 376, no. 1, 2018.
11. Y. Zhang, Z. Zhou, J. Wang, and X. Li, “Diamond tool wear in precision turning of titanium alloy,” Mater. Manuf. Process., vol. 28, no. 10, pp. 1061–1064, 2013.
12. X. Ruibin and H. Wu, “Study on cutting mechanism of Ti6Al4V in ultra-precision machining,” Int. J. Adv. Manuf. Technol., vol. 86, no. 5–8, pp. 1311–1317, 2016.
13. G. D. Revankar, R. Shetty, S. S. Rao, and V. N. Gaitonde, “Analysis of surface roughness and hardness in titanium alloy machining with polycrystalline diamond tool under different lubricating modes,” Mater. Res., vol. 17, no. 4, pp. 1010–1022, 2014.
14. T. T. George, J. Venugopal, M. A. Xavior, and R. Vinayagamoorthy, “Investigation on Precision Turning of Titanium Alloys,” Adv. Mater. Res., vol. 622–623, pp. 399–403, 2012.
15. E. O. Systems, “Material data sheet EOS Titanium Ti64 Material data sheet Technical data,” vol. 49, no. 0, p. 5, 2011.
16. S. Thakur and S. R. Chauhan, “Optimisation of cutting parameters using Taguchi design of experiment for titanium alloy (grade-5) on CNC turning centre,” Int. J. Mach. Mach. Mater., vol. 12, no. 4, p. 398, 2012.
17. S. Athreya and Y. D. Venkatesh, “Application Of Taguchi Method For Optimization Of Process Parameters In Improving The Surface Roughness Of Lathe Facing Operation,” Int. Ref. J. Eng. Sci., vol. 1, no. 3, pp. 13–19, 2012.
18. C. Biswal, “Optimization Of Techniques In Parameters Of Tool Life And Surface Optimization Of Techniques In Parameters Of Tool Life And Surface Roughness By The Taguchi Method,” no. November 2018, 2019.
19. Nutek Inc Bloomfield Hills, Design of Experiments ( DOE ) Using the Taguchi Approach: 16 Steps to Product and Process Improvement. 2004.
AUTHORSPROFILE
Nitish Chandra completed his Bachelor of Engineering (Mechanical Engineering) from Sathyabama University, Chennai. At present, he is pursuing Master of Engineering (Manufacturing Technology) from NITTTR, Chandigarh. His research areas are Micro machining, Ultra precision machining, Modeling and Simulation.