International Journal of Innovative Technology and Exploring Engineering (IJITEE) ISSN: 2278-3075, Volume-8 Issue-8S, June 2019
Abstract: There are many Bicycle Sharing System usability models. Most of them are not tested to evaluate their accuracy, user-friendliness, and applicability in the real world. This study aims to evaluate oBike mobile application by usability techniques for cost and time effectiveness rather Heuristic testing technique. The oBike application is used in 24 countries globally including Malaysia to assist commuters seeking transport services. For usability testing of oBike application, 15 student participants were randomly approached from Universiti Utara Malaysia, UUM. The response gathered was conducted after task completion on 21 metrics questionnaires to measure oBike application for effectiveness, performance, efficiency, errors, learnability, and accuracy. The usability evaluation of oBike application was based on the participant feedback, task completion rates, satisfaction ratings, ease or difficulty ratings to complete the task, time spent on task, and recommendations for improvement. The results of the usability evaluation process of oBike mobile application observed some usability issues. The application is easy to use for experts and difficult for novice users. Thus, participant feedback suggested further improvement to satisfy user needs. This study provides vital incite recommendations that ensureoBike mobile application to continue as user-centered and usability enhancement.
Keyword: oBike mobile application; Bicycle Sharing System; Usability Evaluation; Usability Evaluation Metrics; Usability.
I. INTRODUCTION
Usability is considered as a quality feature of the particular product that indicated how easy that product is which enables users to learn and use with ease [1]. For example, mobile usability is faced with many evaluation challenges such as mobile context, connectivity, small screen, different display resolutions, limited processing capability and power, and data entry methods [2]. Similarly, application usability evaluation has become a more important component for application performance [3].
Revised Manuscript Received on May 22, 2019.
Azham Hussain,School of Computing, Universiti Utara Malaysia, Kedah, Malaysia
Ahmed Al-Athwari, School of Computing, Universiti Utara Malaysia, Kedah, Malaysia
Noor Nabeel,School of Computing, Universiti Utara Malaysia, Kedah, Malaysia
Mustafa M Barkat, School of Computing, Universiti Utara Malaysia, Kedah, Malaysia
Rohiza Ahmad, Software Quality and Quality Assurance (SQ2E) Research Cluster, UniversitiTeknologi PETRONAS, Malaysia
It is the usability of the applications and software of the computer and the Web is what Nielsen Norman defined as a property that evaluates to what extent the user interface is easy to use [5]. For these reasons, usability is the core component for any software or application evaluation that defines the ease of use and value character of any emerging technology (product) which leads to acceptability and of course, emphasizes reliability and satisfaction among users by heart [6].Application usability is an approach where users are required to achieve a certain set of tasks and their actions can be recorded through different data collection methods [7] cited by [8]. Usability evaluation should be used to reveal how tools and systems are really used so that improvements to their design can be made [8]. Therefore, usability is also defined as the capability of a product to be understood, learned, operated, and attractive to users when used to achieve certain goals with effectiveness and efficiency in specific environments [9][10][11] cited by [12].
Bicycle sharing systems (BSS) provide an easy transportation service which facilitates many people and especially foreign tourists who use bicycles to complete their work and enjoy them. Bicycle sharing systems combine smartphone and Smart Lock technology for sharing and bicycle rental solutions. Bicycle sharing systems provide many benefits such as measures data like speed, distance, and pace, and help with tasks such as route planning, goal setting, community building, learning, or other bike-related objectives[13]. Moreover, the benefits of Bicycle sharing systems could be reduced vehicle emissions, reduces energy consumption, improve health benefits, financial savings for individuals, reduced congestion and fuel consumption [14] and easy to be found everywhere. oBike is one of the BSSs which is a universal bicycle sharing company that provides cyclists with different solutions such as easy to use anywhere and environmentally friendly alternative to transportation. It provides the rider with a different method which enables them searching for a nearestoBike bike on the map and reserving oBike bicycles, unblock them by scanning QR code or by entering the bike ID which can be found on the bike, and buying balance with payment modes via Credit Card or Debit Card.
However, bicycle sharing system is one of the noteworthy as well as any of cycling-focused apps measures data like speed, distance, and pace, and help with tasks such as route
Usability Evaluation Model for oBike Mobile
Application: Novice vs Expert Users
planning, goal setting, community building, coaching, or other bike-related objectives[13].Cycling is an environmentally friendly and economical means of personal transport, driven by the workforce, and the use of bicycles as a means of public transport as a promising pillar that develops alternatives to green transport based on environmental conditions and economic factors[15].
On the other hand, the usability evaluation for mobile applications is one of the key issues in application development. The usability issues of mobile applications can be identified through a series of approaches which includes task analysis [16]. Performing usability evaluation of Bicycle Sharing Application is therefore important as it contributes to the environmental quality, noteworthy user experience, and making the user feel at ease and probably fulfilled [17].
II. METHODOLOGY
The study invited 15 students (6 experts and 9Novices) to participants to usability evaluation based on 21 metrics questionnaires for the oBike mobile application. The participants were students andapplication users from different levels of study at University Utara Malaysia (UUM).The participants were engaged from two places of university premises: Varsity-Mall and Sports Centre. The participants were randomly selected to conduct the test, complete the given tasks, and giving feedback on using oBike mobile application in the form of the questionnaire. 5 tasks were assigned to each user such as:
1. Pay Now (Pay the balance using the payment methods by credit card and debit card).
2. Check my Wallet (Checking the balance which could be allowed to use unblock the bike).
3. Searching and Reserving (The participants were required to use the map that oBike Mobile App provides to search for the bikes around through the map, then reserve the available bike).
4. Unlock Locked oBike Bike (The participants were required to scan the QR code. If QR did not work the participant would use the author which is by entering the bike ID on the bike).
5. Logout from oBike Account (Once tasks are completed; the participants are requested to log out from the account).
The participants‘ demography consisted of 73% male participants and 27% female participants. The ages of participants were:60% of participants below 25 years, 33% between 26 and 35, and 7% from 36 to 45 years. The rate of expert users was40%whereasthe novice users were 60%.Once users completed their tasks, they provided with questionnaires to get their feedback about usability evaluation of oBike mobile application.
Measurements Metrics Used in This Study
To evaluate mobile applications or websites, measurements are considered important[18]to satisfying user‘s needs. This section demonstrates what metrics were used to evaluate the
application. From these metrics, usability issues would be clear based on oBike Mobile Application. Metrics were offered to the participant after when he/she has been completed using the required tasks.
The metrics that were collected from the evaluating session were as follow:
1. Time taken to finish the task. 2. Tasks errors.
3. Difficulty of the task.
4. Satisfaction (ease of use and ease of learning). 5. Time taken to learn.
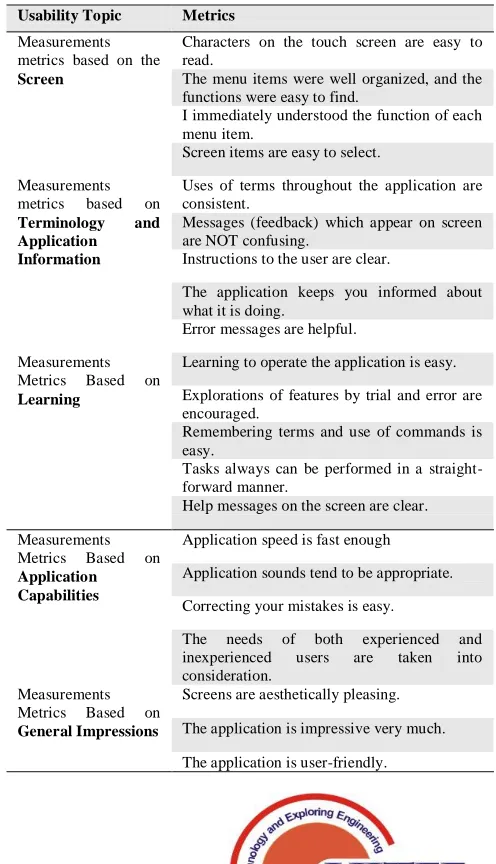
[image:2.612.324.572.294.726.2]Table I below shows other metrics that collected from the evaluating session which were used to measure the usability of oBikemobile application which measured using a questionnaire based on Screen, Terminology and Application Information, Learning, Application Capabilities and General Impressions
Table. 1 Questionnaire of measuring the Usability of oBike Mobile Application
Usability Topic Metrics
Measurements metrics based on the
Screen
Characters on the touch screen are easy to read.
The menu items were well organized, and the functions were easy to find.
I immediately understood the function of each menu item.
Screen items are easy to select. Measurements
metrics based on
Terminology and Application Information
Uses of terms throughout the application are consistent.
Messages (feedback) which appear on screen are NOT confusing.
Instructions to the user are clear.
The application keeps you informed about what it is doing.
Error messages are helpful. Measurements
Metrics Based on
Learning
Learning to operate the application is easy. Explorations of features by trial and error are encouraged.
Remembering terms and use of commands is easy.
Tasks always can be performed in a straight-forward manner.
Help messages on the screen are clear. Measurements
Metrics Based on
Application Capabilities
Application speed is fast enough Application sounds tend to be appropriate. Correcting your mistakes is easy.
The needs of both experienced and inexperienced users are taken into consideration.
Measurements Metrics Based on
General Impressions
International Journal of Innovative Technology and Exploring Engineering (IJITEE) ISSN: 2278-3075, Volume-8 Issue-8S, June 2019
III. FINDINGS AND DISCUSSION
According to response collected through questionnaire, most of the participants (80%) agreed that the characters on the touch screen are easy to read. The 73 % of participants agreed that explorations of features by trial and error are encouraged. Though, 53% (due to 4 uncertain and 4 agree) agreed that the menu items are well organized, and functions are easy to find. While, 66.7% of the participants agreed that application keeps you informed about what it is doing, learning to operate the application is easy, correcting your mistakes is easy and screens are aesthetically pleasing. Likewise, 60% agreed that screen items are easy to select, remembering terms and use of commands was also easy, help messages on the screen are clear, application sounds tend to be appropriate. Moreover, the needs of both experienced and inexperienced users are taken into consideration and application is quite user-friendly. And, 53.4% of participants agreed that application speed is fast enough. Similarly, 53.3% of the participants agreed that they understood the function of each menu items. Almost, half of the participants (46.7%) agreed that the use of terms throughout the applicationis consistent, error messages are helpful, tasks can be performed in a straight-forward manner.
On the other hand, 40% of participants agreed that Messages (feedback) which appear on the screen are NOT confusing.
The novice VS expert participants
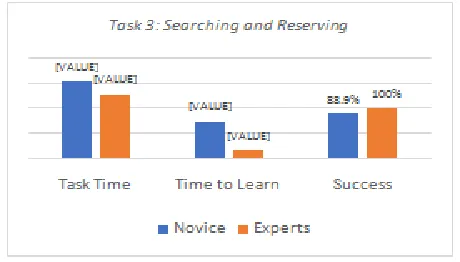
In this section, 5 tasks will be compared and measured by their rating of task time, time to learn, and task success based on giving them the mean scores. As shown in Figure 1 below, has proved that both expert and novice users have successfully completed this task. Yet, according to the time to complete task and time task of learning 4 of 6 experts, users spent more time than novice users for Task 1 (Pay Now). This result depicts that they were not familiar with this task since they usually use free bike ride offers. However, figure 2 shows that both expert and novice users have completed task 2 successfully. Moreover, expert users spent more time to learn and time to complete the task than novice users. Figure 3 shows that novice users spent more time to complete task 3 for ―Searching and Reserving‖ as well as to learn. also, the task success rates of the novice users were less than expert users. In simple words, novice users were lacking in task 3 as compared to expert users. For that, the reason appears that the oBike company sometimes provides offers which could be confusing for the novice users to differentiate between the bikes and offers icons as demonstrated in figure 6.
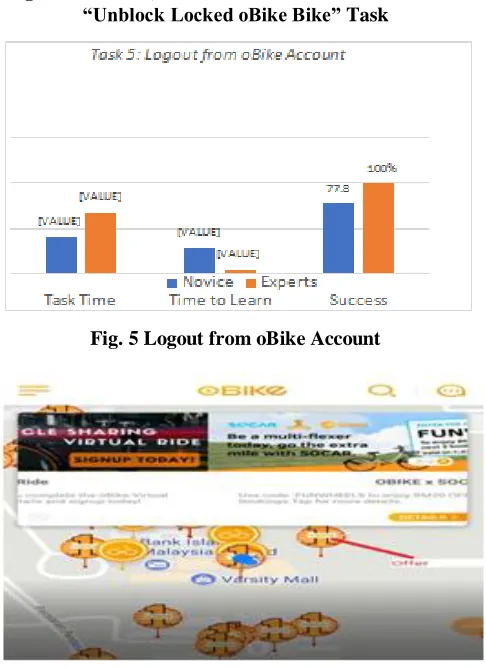
For task 4 which is ―Unblock Locked oBike Bike‖, results showed that novice users took longer time than the expert users to finish this task as well as depicted in figure 4. However, the success rate for accomplishing task4 for novice users is higher than the expert users but this is not about users, rather it is associated with defective bicycle locks. In figure 5 showed expert users needed more time to finish the task ―log out from account‖. The reason behind was irregular user logging out from oBike application. Such that some users do
[image:3.612.327.557.132.263.2]not perform this (log out from the account) task regularly, as they log in once without logging off so not to be considered new users which took more time for novice users than expert users to learn how to accomplish task5. Finally, figure 7reveals the collective task completion rates of all 15 participants.
[image:3.612.321.561.307.452.2]Fig. 1 Time Task, Time to Learn and Task Success on “Pay Now” Task
Fig. 2 Time Task, Time to Learn and Task Success on “Check my Wallet” Task
[image:3.612.325.555.492.623.2]Fig. 4 Time Task, Time to Learn and Task Success on “Unblock Locked oBike Bike”Task
Fig. 5 Logout from oBike Account
Fig. 6 Offers that oBike Company Provides
Task Completion Success Rate
All participants have completed successfully task 1 (Pay Now), task 2 (Chick my Wallet) and task 5 (Log Out from Account). 93% of participants have completed task 3 successfully (Search and reserving). Task 4 (Unlock oBike Locked Bike) got the lowest percentage of successfully achieving with 73.3 % of the participants Figure 7 demonstrates that all participants successfully completed 1 task (Pay Now), task 2 (Check my Wallet) and task 5 (Log out from Account).
Fig. 7 Task Completion Rates
However, 93% of participants completed task 3 successfully (Searching and Reserving) and Task 4 73.3% of respondents completed task 5 (Unblock Locked oBike Bike) which is the lowest percentage of achieving success rate.
Time Spent on Task
Testability testers recorded the time of the task for each participant. Some tasks were inherently more difficult to complete than they were, reflected in the average time in the task. Table II shows the times consumed by users in completing each of the five tasks. Table II demonstrates that T1 takes 144 Avg., T2 takes 25.3 Avg., T3 takes 126.6 Avg., T4 Takes 61.5 Avg., and T5 takes 67.8 Avg. for expert users. However, for novice user that T1 takes 123.77 Avg., T2 takes 16.33 Avg., T3 takes 151.77 Avg., T4 takes 85.222 Avg., and T5 takes 40.777Avg.The metric of Task Time calculated by seconds.Table II:shows summaries of all Participants (Time on Tasks) Who Participate in this Usability Evaluation.
[image:4.612.55.298.228.562.2]International Journal of Innovative Technology and Exploring Engineering (IJITEE) ISSN: 2278-3075, Volume-8 Issue-8S, June 2019
Table. 2 Participant Summary
Time to learn
Testability testers recorded the ―Time to Learn‖ metric for each participant. Table II shows the times that consumed by users in learning each of the five tasks. Table III demonstrates thatT1 takes 33.3 Avg., T2 takes 14 Avg., T3 takes 95.5 Avg.,
[image:5.612.85.524.264.374.2]T4 Takes 0 Avg., and T5 takes 5 Avg. for expert users. However, T1 takes 13.5 Avg., T2 takes 3.8 Avg., T3 takes 72.8 Avg., T4 takes 1.6 Avg., and T5 takes 28 Avg. for novice users. The metric of Time to Learn calculated by seconds.
Table. 3 Summaries of all Participants (Time to Learn) Who Participate in this Usability Evaluation
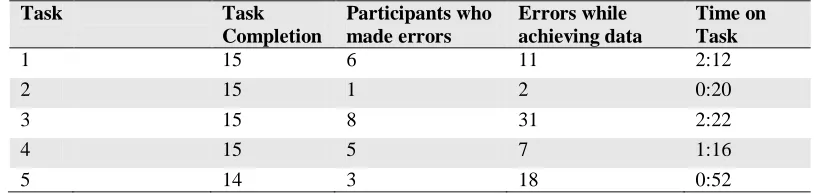
Completion rates, satisfaction ratings, high errors and time on tasks are demonstrated in Table IV and Table IV
Table. 4 Summary of completion, errors while achieving the task, Time on Task
Summary of Data and Errors
Summary of the results is stipulated in table IV. All tasks were completed successfully except task 5. 14 out of 15 participants who completed task 5 successfully spent time of 2:12 minutes. However, only 6 participants made errors 11 times during the completion of task 5. And in task 2, only 1 participant made an error and repeated it 2 times while accomplishing task 2 consuming 0:20 seconds of time. 8 participants made errors and repeated it 31 times and took 2:22 minutes to complete task 3. Further, 5 of the participants made errors and repeated it 7 times and consumed 1:16 minutes to achieve task 4. Finally, only 3 participants made errors and repeated errors 18 times to complete task 5 while consuming 0:52 seconds of time.
V. CONCLUSION AND RECOMMENDATION
Usability evaluation enhances ease to evaluate applications and is more useful tool in contemporary user-centered application development. This study was conducted to test oBike mobile application for station-less Bike sharing to evaluate its usability issues. The response of 6 experts and 9 novice users from UUM were evaluated and 33.4% of participants reported lower satisfaction was noticed regarding ‗Error messaging are helpful‘ aspect of oBike mobile application. 46.7% of participants could not find feedback message and hampered learning when the user made a mistake while completing any of the tasks.
Expert Users Novice Users
Tas ks
P5 P6 P8 P11 P12 P15 Avg. P1 P2 P3 P4 P7 P9 P10 P13 P14 Avg.
T 1 138 197 102 82 250 95 144 141 122 119 110 94 210 64 104 150 123.77
T 2 20 14 8 65 31 14 25.3 19 48 14 10 7 15 13 11 10 16.33
T 3 128 77 110 163 52 230 127 209 254 306 80 270 30 92 99 26 151.77
T 4 56 92 45 65 67 44 61.5 61 300 78 68 15 28 70 102 45 85.22
T 5 14 320 17 30 16 10 67.8 50 9 17 62 15 144 32 18 20 40.77
Expert Users Novice Users
Tasks P5 P6 P8 P11 P12 P15 Avg P1 P2 P3 P4 P7 P9 P10 P13 P14 Avg
T 1 45 76 2 0 42 35 33.3 0 17 28 0 3 20 27 26 1 13.5
T 2 0 8 0 46 20 12 14 0 23 2 2 0 0 2 1 5 3.8
T 3 2 51 93 147 278 2 95.5 0 118 158 0 154 1 134 90 1 72.8
T 4 0 0 0 0 0 0 0 0 10 1 0 0 0 4 0 0 1.6
T 5 0 0 0 23 0 7 5 45 5 28 5 0 135 27 7 0 28
Task Task
Completion
Participants who made errors
Errors while achieving data
Time on Task
1 15 6 11 2:12
2 15 1 2 0:20
3 15 8 31 2:22
4 15 5 7 1:16
[image:5.612.101.508.419.516.2]Moreover, users were satisfied with the efficiency and effectiveness of oBike mobile application, except when completing task 3 which was ‗Searching and reserving‘. Such that, users faced difficulty to learn and complete the task. Further, the bike icon and the offers icon on searching and reserving map were difficult to differentiate for novice users in particular. This deficiency made most participants end up in errors rather than completing the task. As a result, participants lost more time and took considerable time to learn the task as well. Therefore, this study is useful to identify this gray area and the author rightly contends for quality improvement in the application in this regard.
REFERENCES
1. L. Kantner and S. Rosenbaum, ―Usability studies of WWW sites: Heuristic evaluation vs. laboratory testing,‖ In SIGDOC, vol. 97, pp. 53– 160, 1997.
2. A. Hussain, E. O. C. M. J. Musa1, and S. Mortada, ―A user experience evaluation of amazon kindle mobile application.,‖ in AIP conference proceedings, 2017, vol. 1891, no. 1, p. 020060.
3. Hashim N.L., Adamu R. (2017). Usability evaluation of mobile banking application interfaces. Journal of Engineering and Applied Sciences, Vol 12, Issue 21
4. Hussain and E. O. C. Mkpojiogu, ―Usability Evaluation Techniques in Mobile Commerce Applications: A Systematic Review,‖ in AIP Conference Proceedings, 2016, vol. 1761, no. 1, p. 020049.
5. J. Nielsen, ―Usability 101: Introduction to Usability,‖ Nielsen Norman Group, 2012. [Online]. Available: https://www.nngroup.com/articles/usability-101-introduction-to-usability/.
6. H. I. Abubakar, N. L. Hashim, and A. Hussain, ―Usability Evaluation Model for Mobile Banking Applications Interface : Model Evaluation Process using Experts ‘ Panel,‖ SearchGate, no. January, 2016.
7. J. Preece, Y. Rogers, and H. Sharp, Interaction Design: Beyond human-computer interaction of data collection methods, 3rd ed. Chichester: John Wiley & Sons, 2011.
8. L. BALL and T. BOTHMA, ―The importance of usability evaluation when developing digital tools for a library–a case study,‖ SearchGate, 2017.
9. K. Hornbæk and E. L.-C. Law, ―Meta-Analysis of Correlations Among Usability Measures,‖ in In Proceedings of the SIGCHI conference on Human factors in computing system, 2007, pp. 617–626.
10. N. Bevan, ―Measuring usability as quality of use,‖ Softw. Qual. Journal, 4(2), pp. 115–130, 1995.
11. ―International Organization for Standardization (ISO),‖ 2002.
12. R. Baharuddin, Dalbir Singh, and R. Razali, ―Usability dimensions for mobile applications—a review,‖ Res. J. Appl. Sci. Eng. Technol. 5(6) 2225-2231, 2013.
13. D. Trends, ―The best cycling apps,‖ 2018. [Online]. Available: https://www.digitaltrends.com/outdoors/best-cycling-apps/.
14. L.-Y. Qiu and L.-Y. He, ―Bike sharing and the economy, the environment, and health-related externalities,‖ Sustainability, p. 1145, 2018.
15. Yung-HsiangCheng and Kuo-ChuLiu, ―Evaluating bicycle-transit users‘ perceptions of intermodal inconvenience,‖ Transp. Res. Part A Policy Pract., vol. 46(10), pp. 1690–1706, 2012.
16. A. Hussain and E. O. C. Mkpojiogu, ―The effect of responsive web design on the user experience with laptop and smartphone devices,‖ Jurnal Teknologi., pp. 41–47, 2015.
17. M. Hassenzahl, ―User experience (UX): towards an experiential perspective on product quality,‖ 20th Int. Conf. Assoc. Francoph. d‘Interaction Homme-Machine, vol. 8, pp. 11–15, 2008.