Revised Manuscript Received on June 13, 2019
Monisa Latif, Civil Engineering Department, RIMT University , Punjab .INDIA
Dr Sandeep Singla. , Civil Engineering Department, RIMT University , Punjab .INDIA
Vishal Yadsv, Civil Engineering Department, RIMT University , Punjab .INDIA
Abstract: Parking is mostly seen in a strategic point of view in terms of demand and supply. There is little knowledge about modeling the user's behavior and the time needed to park a car. The focus of this project is on modeling off-street parking at educational institutes based on user’s behavior. In this study two types of multiple linear regression models using SPSS software were developed. Disaggregate model and aggregate model. Disaggregate model study determines the most suitable independent variables affecting the parking demand based on user’s socio economic behavior. The demand for this model is expressed in terms of parking usage per person per day in hours at educational institutions in Srinagar city. The disaggregate model analysis revealed that the most influencing independent variables for this model are travel distance and income per month for employees and visitors with the coefficient of variation(R)=0.96 and coefficient of determination(R2) =0.92 and family income and travel distance for students with the coefficient of variation(R)=0.98 and coefficient of determination(R2) =0.96. Aggregate model study determines the most suitable independent variable for estimating the parking demand (vehicle hours) or parking supply (space hours) at educational institutions. The formula emulated can be used to establish the number of parking bays to be provided to accommodate the parking needs at educational institutions. The aggregate model analysis predicts that most fitting independent variable for determining the parking demand formula is the number of employees working at the institution with the coefficient of variation(R)=0.997 and coefficient of determination (R2) =0. 993.The most suitable model is that for which the coefficient of variation(R) and coefficient of determination (R2) is nearly equal to one. Goodness of fit test or significance test and validation test has been conducted on the developed equations and can be used with a high level of confidence.
I. INTRODUCTION
No specific studies have been carried out to project the parking demand of educational institutions. Most of the parking spaces allocated are based on free land available[1][2]. Hence, it is necessary to obtain a balance of parking supply and demand. Therefore, it is important to develop a parking demand model so that the parking demand is calculated based on various independent variables[3].
Parking demand is depend on trip generation, trip purpose and land use and socio-economic characteristics of users[4]. Parking demands are not generated by the building space itself but it is generating by the number of residents in the area and its mode of transportation[5]. Thus, there may be instances where an educational institution, because of its
location (either at urban area, suburban area, or rural area etc.), would have higher or lower parking requirements than indicated by the recommended standard, where such conditions are not likely to change with time, modification of the standard is in order [6]. In such circumstances a specialized study needs to be undertaken to establish these parking requirements. Some of the socio economic factors which affect parking demand include a) Total population in catchments b) Average vehicle ownership c) Average income of parkers d) Average travel distance from each resident to destination e) Parking time f) The daily average passengers have high degree of association with parking supply.
The daily average passengers have high degree of association with the parking supply [7]. Parking influences the spatial distribution of transport use and viability of development. Parking should be considered as at metropolitan level than to consider for a particular region[8][9][10].Parking supply characteristics can play a significant role in reducing automobile dependency. Parking demand decreases with good and efficient transport facility. The majority of car drivers will not change their behavior when they do not have to pay for entering the area.The goodness of fit test is great and the model can reflect the actual situation of the relationship between speed and capacity under the road parking influence.
Research Objectives involve 1) To study the parking characteristics at higher educational institutions and to assess whether the demand is met with;2)To identify the problems of traffic and parking;3)To analyze the present parking scenario in Srinagar city 4)To determine the most suitable independent variables affecting parking demand and to develop a parking demand model.
METHODS
For developing the parking supply model, multiple linear regressions will be considered. The multiple linear regression equation will be solved using the software SPSS.
Steps followed in the Multiple Regression Analysis using SPSS Software Package are:
• Inclusion of the dependent variable;
• Inclusion of the entire set of independent variables (parameters) or predictors;
• Variables having least partial correlation with the dependent variable removed sequentially (step-wise) so that
Modeling Off-Street Parking Based on User’s
Behavior using Spss Software
all the variables that contribute least to the model (statistically insignificant)
are eliminated; and
• Determining the final functional form containing only those parameters or predictors which have significant impact on the dependent variable (here parking demand).
Significance Level (Sig.) determines whether the particular parameter is a significant predictor of the dependent.
Site Selection
University of Kashmir was selected to develop disaggregate model predicting the parking usage based on the socio economical characteristics of users. Finally, an aggregate model was developed to predict the total parking demand based on number of users and other characteristics of institutions. NIT Srinagar, University of Kashmir, IUST Awantipora, GMC Srinagar, Zukara campus of KU, Womens college M.A road Srinagar were selected to develop aggregate model.
Site Survey and Data Collection
It includes employee survey, student survey, visitors survey and campus survey.
Separate questionnaire has been developed for each category. At least 10 samples for each category will be collected which is as per the requirement of statistical tests. The questionnaire developed is given in the appendix. Campus data would be obtained from campus authorities.
Modeling of Parking Demands
Linear regression will be used to develop the parking demand model. Two types of models were developed. Disaggregate and Aggregate. Aggregate model has been developed based on the characteristics of the institutes. The demand is expressed in terms of peak parking demand based on accumulation curve. In aggregate model peak demand is expressed as a function of floor area, number of students, number of employees, availability of college bus facility and parking charges at these institutes. Disaggregate model was developed at KU based on socio-economic characteristics of users. Here users are student, employees and visitors. This model will give us the parking usage in hours per person at the educational institutes. The questions based on ‘Revealed Preference Survey ‘and ‘stated preference survey’ of over 50 respondents from student and employee and visitor group have been used to formulate the disaggregate demand functions. These demand functions help in identification of the factors influencing parking demand in the study areas, highlighting the fact that parking demand analysis should be done in a case specific manner. Parking demand has been expressed in terms of parking usage in hours per day. Disaggregate model has been developed for two groups. One group include only students and the other group includes employees and visitors. The structure of the disaggregate model
will be as: Y (1,2,3) =a + b1 × x1 + b2 × x2 + b3 × x3 ………
Where Y is the demand function and x1, x2.x3 will be the
characteristics of employees, students and visitors affecting parking. The parking supply is expected to have a positive linear relationship with daily number of users and a negative linear relationship with parking charges and bus service/public transport. The bus service/public transport is important in order to control the parking demand. The parking demand modeling will be carried out Using SPSS.
II. DATA COLLECTION
Separate questionnaire has been developed for employee, students, and visitors. Questionnaire of socio economic behavior of people affecting parking demand . Socio- economic behavior of employee and visitors at KU . Socio- economic behavior of students. At least 10 samples for each category will be collected which is as per the requirement of statistical tests. Campus data would be obtained from campus authorities. The general guidelines to be taken for the collection of parking data and analysis of the data collected at various sites under study. The data is collected to formulate two types of models. Disaggregate model based on the socio economic characteristics of the users affecting parking usage (demand) and aggregate model based on the general characteristic of the educational institutes. The guidelines prescribed by IRC were strictly followed in this study while collecting data in the campuses.
Since the campus has no defined parking area it becomes very difficult to use license plate method or fixed period patrolling method for studying parking characteristics, so IN OUT survey has been used to identify the various parking characteristics. The survey was carried out to determine the total number vehicles entering and leaving the campus at each ten minutes’ interval, since the campus has three gates, three persons were employed to determine the total count. The survey was conducted from 8am to 5pm.The data for aggregate model is obtained from university records.
University of Kashmir (main campus at Hazratbal)
TABLE I:Parking demand at KU *based on the parking space requirement and converting all the
demand in terms of car parking space
TABLE II: Characteristics of KU campus: source university record
Vehicle Peak
parking demand (vehicle hours)
Conversion factor*
total car parking Demand (veh. hours)
Car 682 1 682
Bus 14 1.96 28
Parking data analysis:
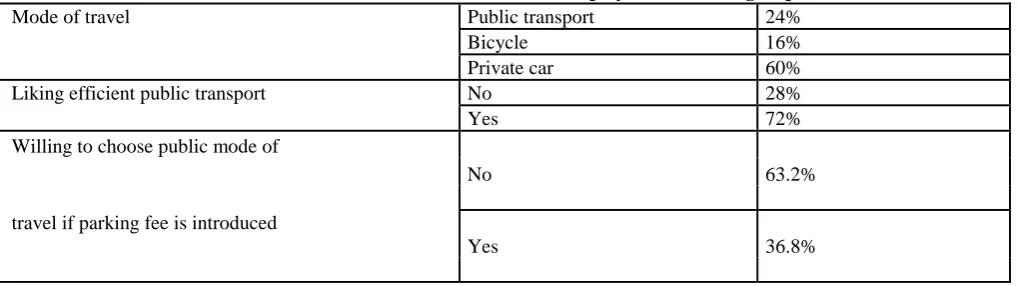
[image:3.595.47.556.203.346.2]a) Case processing summary employee and visitor’s data:
TABLE III:Correlation matrix at KU for employee and visitor group Total
area
Floor area m2
Total number of Employee s
Total number of students on roll
College bus Services
Parking Charges
Peak Parking Demand
74.56 hec.
94675 1974 7993 Available None 772
Mode of travel Public transport 24%
Bicycle 16%
Private car 60%
Liking efficient public transport No 28%
Yes 72%
Willing to choose public mode of
No 63.2%
travel if parking fee is introduced
parking usage
per day
mode of travel
travelle d distance
travel time (hour)
liking efficient
public transport
age
income per month in lacs
Cars owned
preferred parking
fee per hour
willing Choose parking
fee is introduce
d
parking usage per
day 1 .699 .640 .469 -.042 .09 .625 .406 .130 -.364
mode of travel .699 1 .118 -.028 -.328 .631 .707 .891 .616 -.337
travelled distance .640 .118 1 .861 .207 -.017 .109 -.023 .376 -.237
travel time (hour)
.469 -.028 .861 1 .213 -.108 -.083 -.132 .206 -.239
-.042 -.328 .207 .213 1 -.265 -.298 -.260 -.170 .307
Age .09 .631 -.017 -.108 -.265 1 .773 .722 .537 .566
income per month
in lacs .625 .707 .109 .083 -.298 .773 1 .751 .630 .564
cars owned .406 .891 .023 .132 -.260 .722 .751 1 .568 -.272
.130 .616 .376 .206 -.170 .537 .630 .568 1 -.496
willing to choose public mode of travel if parking fee is introduced
-.364 -.337 -.237 -.239 .307 .566 -.564 -.272 -.496 1
b) Case processing summary of students:
Mode of travel Public transport 44.2%
Bicycle 19.2%
Private car 36.5%
Liking efficient public No 25%
Transpor
t Yes 75%
Willing to choose public mode of travel if parking fee is introduced
No 44.8%
Yes 55.2%
TABLE IV:Correlation matrix at KU for students group parki ng usag e per day in hours mo de of trav el Trav elled Dista nce tra vel tim e liking for effici ent publi c trans port a ge Scho larship avail ing per mont h Vehi cle own ed Fami ly inco me per mont h willing to choose public mode of travel if parking fee is introduced Prefer red Parkin g fee(ru pees) per Day parking usage per day in hours
1 .83
0 .569
.32
6 -.187
.5
73 .736 .830 .818 -.021 .511
mode of
travel .830 1 .287
.16
9 -.298
.5
83 .742 1.000 .895 .050 .442
travelle
d distance .569
.28
7 1
.85
6 .072
.3
05 .413 .287 .330 -.026 .269
travel time
liking for
.326 .16
9 .856 1 -.011
.1
92 .265 .169 .240 -.095 .138
efficient public
Transpo rt
-.187 -.2
98 .072
-.0
11 1
-.
197 -.293 -.298 -.288 .089 -.139
Age .573 .58
3 .305
.19
2 -.197 1 .531 .583 .485 -.009 .247
Scholars hip availing
per Month
.736 .74
2 .413
.26
5 -.293
.5
31 1 .742 .670 .096 .221
Vehicle
owned .830
1.0
00 .287
.16
9 -.298
.5
83 .742 1 .895 .050 .442
Family income
per month
.818 .89
5 .330
.24
0 -.288
.4
85 .670 .895 1 .053
.433 willing to choose public mode of travel if parking fee is introduced
-.021 .
050 -.026
-.0
95 .089
-.
009 .096 .050 .053 1 -.115
Preferre d parking fee(rupe es) per
Day
.511 .
442 .269
.13
8 -.139
.2
47 .221 .442 .433 -.115 1
III. MODELING PARKING DEMAND Derivation of disaggregate demand functions
The questions based on ‘Revealed Preference Survey ‘and ‘stated preference survey’ of over 50 respondents from the study area (KU) for educational trips have been used to
formulate the disaggregate demand functions. Separate study was carried out at KU and two separate models-one for employees and visitors and
other for students were formulated. These demand
identification of the factors influencing parking demand in the study areas, highlighting the fact that parking demand analysis should be done in a case specific manner. Parking demand has been expressed in terms of Duration of parking (parking space usage per visit) in hours. The Parameters (Independent Variables) considered for analysis include age monthly income in lacs for employee and visitors and family income of
students (dummy variable with coding as
:1=<0.25,2=0.25-0.5,3=0.5-0.75and so on) • Parking usage per day
• Preferred parking fee
Their liking for efficient public transport (dummy variable:1=yes.0=no). Response to the introduction of parking fee i.e. if parking fee is introduced will parkers change their mode of travel (dummy variable:1=yes,0=no)
• Travel time and distance
The questionnaire is given in the Appendix A.
A) Demand function at KU for visitor and employee group Using SPSS, parking modeling with simple linear regression analysis is done using “Stepwise” method. The following shows the summary of the models. Steps followed
in the Multiple Regression Analysis using SPSS Software Package are:
Inclusion of the dependent variable;
Inclusion of the entire set of independent variables (parameters) or predictors; • Variables having least partial correlation with the dependent variable removed sequentially (step-wise) so that all the variables that contribute least to the model (statistically insignificant) are eliminated; and
• Determining the final functional form containing only those parameters or predictors which have significant impact on the dependent variable (here parking demand).
• Significance Level (Sig.) determines whether the particular parameter is a significant predictor of the dependent variable. Significance Level of the Full Model is a measure of the overall ‘Goodness of Fit’
Linear regression by stepwise method with
constant
TABLE V(a) linear regression by stepwise method with constant
Model Variables entered R R square Std. error of the estimate
1 travelled distance .632 .400 3.68213
2 income per month in lacs .752 .565 3.17938
3 cars owned .799 .639 2.93923
Model Sum of Squares Df Mean
Square F Sig.
1 Regression 325.303 1 325.303 23.993 .000
Residual 488.092 36 13.558
Total 813.395 37
2 Regression 459.599 2 229.799 22.733 .000
Residual 353.796 35 10.108
Total 813.395 37
3 Regression 519.665 3 173.222 20.051 .000
Residual 293.729 34 8.639
Total 813.395 37
TABLE V(b):linear regression by stepwise method with constant
model Variables Coefficient T Sig
1 (Constant) 1.8 3.989 .000
traveled
distance .248 4.898 .000
2 (Constant) 0.37 .646 .523
traveled
distance 0.25 5.759 .000
income per month in lacs 0.406 3.645 .001
[image:6.595.41.568.334.561.2]
traveled
distance 0.22 5.091 .000
income per month in lacs .628 4.722 .000
cars owned 0.363
-2.63
7 .013
4. Linear
regression by stepwise method without constant
Table VI(a) regression by stepwise method without constant
Std.
error of
Variables
R The
Sum of
Mean
M o d e
l Entered R square estimate
Squares df Square F Sig.
1
Regression 3577.171 1 3577.171 188.050 .000
Travele
d
Residual
703.829 37 19.022
distance 0.914 .836 4.3614 Total
4281.000 38
2 Travele
d
Regression
3922.990 2 1961.495 197.240 .000
distance
income per Residual 358.010 36 9.945
month in
Lacs 0.957 .916 3.1535 Total
4281.00 38
Variables
coefficient
t
Sig
model
1
traveled distance0.38
13.713 0.000
2
Traveled distance0.23
7.913 0.000
Income per month in lacs
0.43
5.887 0.000
TABLE VI(b): Linear regression by stepwise method without constant
Using SPSS, parking modeling with simple linear regression analysis is done using “Stepwise” method. The following shows the summary of the models
linear regression by stepwise method with constant
TABLE VII(a):linear regression by stepwise method with constant
TABLE VII(b):Linear regression by stepwise method with constant
Variables
coefficient T Sig
model
1 (Constant)
2.064
5.072 .000
traveled distance
0.28
5.555 .000
2 (Constant)
0.93
1.689 .103
traveled distance
0.28
5.923 .000
Family income per month
0.329
2.808 .009
3 (Constant)
1.522
2.820 .009
traveled distance
0.43
6.061 .000
Family income per month
0.415
3.764 .001
travel time
-0.497
-2.703 .012
Model
Variables removed
Beta In T Sig. Partial Correlation
1
travel time-.298 -1.388 .177 -.258
liking for efficient public transport
-.115 -.859 .398 -.163
age
.105 .789 .437 .150
Scholarship availing per month
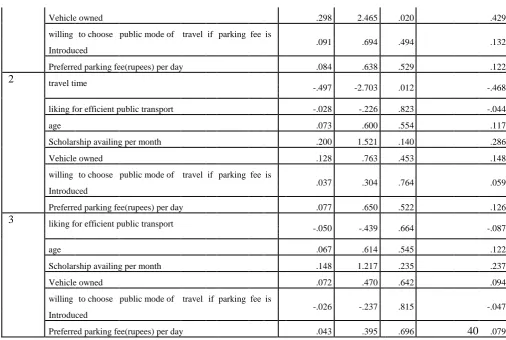
.303 2.346 .027 .411 [image:8.595.47.550.133.341.2]
Vehicle owned
.298 2.465 .020 .429
willing to choose public mode of travel if parking fee is
.091 .694 .494 .132
Introduced
Preferred parking fee(rupees) per day
.084 .638 .529 .122
2
travel time-.497 -2.703 .012 -.468
liking for efficient public transport
-.028 -.226 .823 -.044
age
.073 .600 .554 .117
Scholarship availing per month
.200 1.521 .140 .286
Vehicle owned
.128 .763 .453 .148
willing to choose public mode of travel if parking fee is
.037 .304 .764 .059
Introduced
Preferred parking fee(rupees) per day
.077 .650 .522 .126
3
liking for efficient public transport-.050 -.439 .664 -.087
age
.067 .614 .545 .122
Scholarship availing per month
.148 1.217 .235 .237
Vehicle owned
.072 .470 .642 .094
willing to choose public mode of travel if parking fee is
-.026 -.237 .815 -.047
Introduced
Preferred parking fee(rupees) per day
.043 .395 .696
40
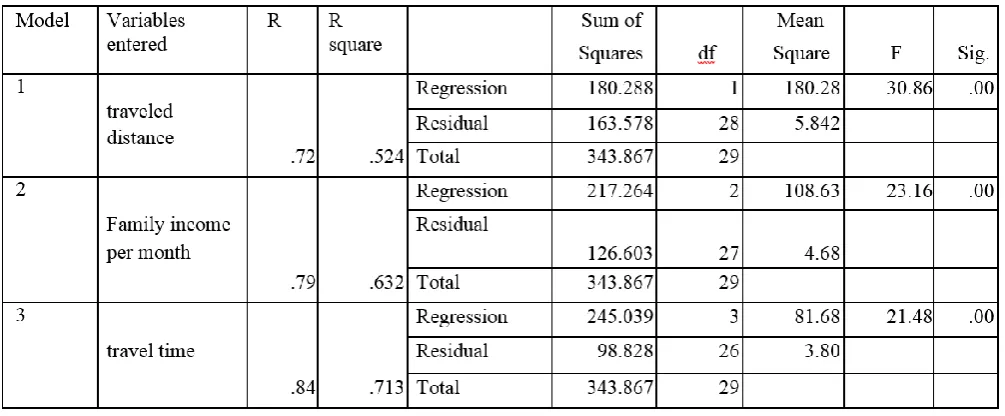
.079 [image:9.595.45.552.43.383.2]Linear regression by stepwise method without constant
TABLE VIII:linear regression by stepwise method without .
Model Variables R R
entered Square Sum of Squares df Mean Square F Sig.
1
Regression
3192.115 1 3192.115
294.92
1 .000
traveled
.95 .710 Residual
313.885 29 10.824
distance
Total
3506.000 30
2
Family
Regression
3366.021 2 1683.010
336.65
2 .000
income per .98 .960 Residual 139.979 28 4.999
Month Total 3506.000 30
Model
Partial
Excluded
variables Beta In t Sig. Correlation
1
travel time
.395
1.957 .060
.347
liking for efficient public transport .083 .922 .365 .172
Scholarship availing per month .273 3.117 .006 .508 Family income per
month .437 5.898 .000 .744
Vehicle owned .402 5.855 .006 .742
If parking fee is
introduced
.150
2.149 .040
.376
Preferred parking fee(rupees) per
day .196 2.602 .015 .441
2
travel time
-.282
-1.512 .142
-.279
liking for efficient public transport .033 .536 .596 .103
Age .175 1.605 .120 .295
Scholarship availing per month .105 1.374 .181 .256
Vehicle owned .208 1.478 .151 .274
willing to choose public mode of Travel if parkin
g fee is
.033
.582 .565
.111 Introduced
Preferred parking fee(rupees) per
day .074 1.209 .237 .227
Model
Coefficient
s t sig
1 traveled distance 0.58 17.471 .000
traveled distance 0.36 8.112 .000
2 Family income per month 0.66 5.899 .000
Derivation of aggregate demand functions
The aggregate demand function is expressed in terms of peak parking demand and the characteristics of whole campus. The peak parking demand is the dependent variable and is expressed in terms of number of employees, number of tudent, floor area, bus feeder services and parking charges. The following data shows the summary of data collection at educational institutes from the authorities for parking demand
modeling Before the analysis is carried out, it is important to find out whether the independent variables Selected for the parking demand modeling have high degree of association with the car parking demand at each site. The table below tabulates the correlation matrix between the chosen independent variables. the correlation between the independent variables seems to be more significant, therefore, parking demand modeling is carry out with SPSS.
peak parking demand Floor area students employees bus facilities
peak parking demand 1 .996 .920 .999 .574
Floor area .996 1 .939 .994 .565
Students .920 .939 1 .913 .404
Employees .999 .994 .913 1 .596
bus facilities .574 .565 .404 .596 1
Using SPSS, parking modeling with simple linear regression analysis is done using step wise method.The following shows the summary of the models
Linear regression by stepwise method with constant
TABLE X: linear regression by stepwise method with constant
model Variables
Entered R Sum of Mean
R Square Squares df Square F Sig.
3 Employees Regression
302842.281 1 302842.281 1.686E3 .000
.999 .998
Residual 718.552 4 179.638
Total 303560.833 5
Model Variables
Entered coefficient t Sig.
3 (Constant) 40.348 5.019 .007
Employees .368 41.059 .000
Variables Coefficient
Removed t Sig. Partial Correlation
Floor area .244 1.097 .353 .535
Students .051 .816 .475 .426
bus facilities -.032 -1.101 .351 -.536
Linear regression by stepwise method without constant
TABLE XI:linear regression by stepwise method without constant
Model Variables
R Sum of Mean
Entered
R Square Squares df Square F Sig.
4 Employees
Regression 776025.414 1 776025.414 739.97 .00
.997 .993 Residual 5243.586 5 1048.717
Total 781269.000 6
Model Variables entered
coefficient t Sig.
4
employees .401 27.202
.000
removed Coefficient t Sig. Correlation
Floor area .087 .159 .882 .079
students .206 2.580 .061 .790
bus facilities .011 .161 .880 .080
IV. RESULT
Linear Regression Estimates for The Disaggregate Model Are:
I. For employees and visitors group
By stepwise method with constant
Parking usage=0.98+0.22(travelleddistance) +0.628(income per month in lac) +0.363(car owned)
With R= 0.799 and R2=0.639
Since the t-value for the constant and cars owned is not significant (i.e. more than 0.05), therefore, this model is rejected.
By stepwise method without constant
MODEL 1
Parking usage=0.38 (travelled distance); R= 0.914 and R2=0.836
MODEL2
Parking usage=0.23(travelled distance) +0.43(income per month in lac)
R = 0.957 and R2= 0.916
Over all t-value for both model 1 and model 2 is significant and also the individual coefficients have significant t -value (i.e. less than 0.05), therefore both models can be accepted. Further the model satisfies the validation test on the observed data.
II. For student group
By stepwise method with constant
Parking usage=1.522+0.43(travelled distance) +0.415(family income per month in lac)-0.497(travel time)
R= 0.84 and R2=0.713
Since the t-value for the constant and travel time are not significant (i.e. more than 0.05), therefore, this model is rejected.
By stepwise method without constant
MODEL1
Parking usage=0.58(travelled distance); R=0.95 and R2=0.91
MODEL2
Parking usage=0.36(travelled distance) +0.66(family income per month in lac) R=0.98 and R2=0.960
Over all t-value for both model 1 and model 2 is significant and also the individual coefficients have significant t -value (i.e. less than 0.05), therefore both models can be accepted. From the above equations it is predicted that travel distance and income are the only significant parameters affecting parking demand in terms of parking usage.
b) LINEAR REGRESSION ESTIMATES FOR THE AGGREGATE MODEL
By stepwise method with constant
Peak parking demand (vehicle hours) =40.348+0.368(total number of employees) R=0.99 and R2=0.998
Since the t-value for the constant is not significant (i.e. more than 0.05), therefore, this model is rejected.
By stepwise method without constant
Peak parking demand (vehicle hours) =0.401(total number of employees)
R=0.997 and R2=0.993
Over all t-value for the model is significant and also
the individual coefficient has significant t -value (i.e. less than 0.05), therefore the can be accepted and can be used to
determine the peak parking demand. Further the model satisfies the validation test on the observed data.
V. CONCLUSION
This study of parking demand analysis in Srinagar city is first time carried out in Srinagar city based on scientific methods using modern sophisticated software SPSS. This study was carried out in limited time and utilizing limited resources. This study concludes that: -
The disaggregate model developed determines the independent parameters influencing parking demand, where parking demand is expressed in terms of parking usage. It is concluded that for employees and visitors and students the travel distance and income are the influencing parameters effecting parking demand.
The aggregate model developed determines the independent variables influencing parking demand. The parking demand is expressed in the units of vehicle hours. The number of employees working in the institution has highest degree of association with the parking demand.
if a new educational institution will be located in the Srinagar and the parking facilities will be provided, the above
The Srinagar city lacks in the efficient public transport system. The transportation system in the city faces frequent traffic jams and traffic congestions which is mainly due increased growth of private vehicles. The solution to the problem lies in introducing the best public transportation system.
Free parking in the city, mostly in the educational institutes and other offices encourages the use of private mode of travel, causing traffic jams and congestions at morning and evening peak hours, if parking fee is introduced the people will shift to public mode of travel and subsequently decrease traffic jams on the roads during morning and evening offices hours. Almost all the study sites have inadequate parking area, the capacity of the parking lawn is less than demand, compelling the parkers to park their vehicles all-round the site at their own will. This vagueness may be removed by conducting detailed studies of parking
study is one of such efforts to study parking demand and the factors effecting parking demand at Srinagar city and finally formulate parking demand model. The parking demand models have been developed, but because of limited time and
resource the study was carried out at small scale. For developing improved parking demand models in the Srinagar city, such studies should be conducted at comprehensive level
REFERENCES
1. IRC-SP-12., "GUIDELINES FOR PARKING FACILITIES IN URBAN AREAS.," IRC, 2015..
2. C. P. A. P. PREVEDOUROS, TRANSPORTATION ENGINEERING AND PLANNING, PEARSON, 2000.
3. T. V. a. K. K. R. Mathew, "Introduction to Transportation engineering.," Civil Engineering–Transportation Engineering. IIT Bombay,NPTEL ONLINE, [Online]. Available: http://www. cdeep. iitb. ac. in/nptel/Civil% 20Engineering, 2006. [Accessed 2017].
4. C. P. a. D. M. M. Ng, "The development of model estimation to determine parking needs at LRT stations in suburban area," Proceedings 5. of the Eastern Asia Society for Transportation Studies, vol. 5, 2005. 6. D. L.R.KADIYALI, TRAFFIC ENGINEERING AND PLANNING,
KHANNA PUBLISHERS, 2016.
7. W. D. B. a. S. S. Young, "An analysis of the spatial distribution of parking supply policy and demand," Australasian Transport Research Forum (ATRF), vol. 33, 2010.
8. H. X. Q. G. H. &. P. X. Qin, "Analysis on the Parking demand of the Commercial Buildings Considering the Public Transport Accessibility," Nature and Science, 2010.
9. Z. Y. W. L. Z. L. W. a. J. X. C. Wang, "Study of influence of parking in the ways on road capacity around schools based on flocking theory.,"
Procedia-Social and Behavioral Sciences 96, 2013.
11. P. A. B. a. H. T. Van der Waerden, "Attitudes and behavioral responses to parking measures.," European journal of transport and infrastructure research, 2006.
9. S. a. T. M. Chakrabarti, "Behavioral Characteristics of Car ParkingDemand: A Case Study of Kolkata.," Institute of Town Planners, India Journal, 2010.
AUTHORSPROFILE
Monisa Latif, EDUCATION AND QUALIFICATION
Masters of technology, Rimt University, Batchelors of technology
Islamic University of Science and Technology,
Sandeep Singla, EDUCATION AND QUALIFICATION
Doctor of Structural Engineering , National Institute of technology , Kurukshetra India 2018, Master of Structural
Engineering, Thapar Institute of engineering and technology , Patiala, India 2004
Bachelor of Civil Engineering
Punjab technical university Jalandhar2001.
EMPLOYMENT RECORD
Professor and Head Of Department RIMT University Member of ISTE and IEI
RESEARCH INTEREST
Environmental engineering ,Waste management , Concrete technology Artificial intelligence Remote sensing GIS
Vishal Yadav
EDUCATION AND QUALIFICATION Masters of Technology
R.P Indraprastha Eucational Trust Bastra (KARNAL) Kurukshetra University
Bachelor of Civil Engineering
MM Engineering College Mullana Kurukshetra University