Performance Evaluation of Total Variation based
Compressed Sensing MRI for Different Sampling
Patterns
T.Surya Kavitha, K.Satya Prasad
Abstract: Magnetic Resonance Imaging (MRI) has been utilized broadly for clinical purposes to portray human anatomy due to its non-intrusive nature. The information acquisition method in MRI naturally picks up encoded signals (Fourier transformed) instead of pixel values and is called k-space information. Sparse reconstruction techniques can be executed in MRI for producing an image from fewer measurements. Compressive sensing (CS) technique samples the signals at a rate lower than traditional Nyquist’s rate and thereby reduces the data acquisition time in MRI. This paper investigates a new proposed sampling scheme along with radial sampling and 1D Cartesian variable density sampling. For various sampling percentages, subjective and quantitative analyses are carried out on the reconstructed Magnetic Resonance image. Experimental results depicts that the high sampling density near the center of k-space gives a better reconstruction of compressing sensing MRI.
Keywords: 1D Cartesian Sampling, Compressive Sensing, k-space, MRI, Radial Sampling
I. INTRODUCTION
Magnetic Resonance Imaging (MRI) is a non-intrusive methodology broadly utilized in clinical diagnosis because of its excellent tissue depiction. MRI scanning process acquires large amount of information from the patient’s body which leads to long acquisition time. Sometimes it may be claustrophobic for patients and any movement of the patient body causes image artifacts that are non-recoverable. Hence reduction of MRI scan time is very essential. Recently enhanced compressive sensing (CS) technique makes it feasible for image reconstruction from few samples there by reducing scan time. Compressive sensing theory proves that signals at a sampling rate very less than Nyquist’s rate can be retained with a greater quality [1]. The MRI scanners acquire data in the form of individual Fourier coefficients and are stored in k-space and sampled during MR measurement. Magnetic resonance images can be sparse in Fourier or in Wavelet domain. Energy distribution of the k-space at outer and the central regions is different. Hence, obtaining CS-MRI technique might accounted as choosing the subset of k-space that incorporates synthesizing variable density sampling method [3]. In this paper k-space information is under sampled using variable density Cartesian sampling and then reconstructed applying CS techniques. minimization is basically used for the reconstruction of CS data [2]. Total Variation (TV) minimization is utilized to diminish the frequency aliasing
Revised Manuscript Received on September 03, 2019
T.Surya Kavita*, Research Scholar, Department of Electronics and Communication Engineering, JNTUK, Kakinada, Andhra Pradesh, India,
obtained by under-sampled k-space information. This paper combines minimization with TV minimization to obtain better quality images. Different MR images are under sampled at various sampling percentages and the nature of the reconstructed MR images are compared.
II.METHODOLOGY
A. Compressive Sensing MRI
Compressive Sensing is a technique that can reproduce precisely an under sampled signal by the methods such as minimization, as long as the signal is sparse. CS method reduces measurement time and sampling rates in applications like MRI [1], [4]. This section briefly explains MR image reconstruction using CS. It is important to record that the k-space data of magnetic resonance images are encoded in Fourier domain and the data acquired by MRI scanner is complex [5]. Let is a linear operator, which transforms the image into another sparse domain, is complex vector notation of restored image and is under sampled Fourier transform. The required signal can be restored by resulting the constrained optimization equation as shown below [5]:
(1)
In (1), represents the estimated noise level threshold parameter and used to constraint the reconstruction fidelity, and represents the k-space data acquired by MRI scanner. By minimizing ℓ1 norm of and executing the
consistency by the constraint , the sparsity constraint can be upgraded.
B. TV Based Model
With the data acquired using under sampling trajectory, the image is restored using nonlinear convex program. The optimization problem is taken care by the TV algorithm as shown [6]:
(2)
III. k-SPACE SAMPLING
Raw data obtained by the MRI scanner is said to be in k -space. This raw image is not ready for image processing and it must be processed to obtain an image. Inverse Fourier transform of the raw data should be taken to transfer k-space data to real space. During MRI acquisition, the trajectory along which the image Fourier data is sampled is called k -space trajectory. Sufficient Fourier data must be acquired along the trajectory to ensure proper reconstruction of the object later. To determine k-space trajectory, Gx, Gy and Gz
are the gradients considered along x, y and z directions respectively. The total scan time is mainly determined by the accumulated waiting times present between the successive trajectories that are used to cover total k-space. Highly under sampled k-space data results in artifacts present in the reconstructed image [7], [8]. Many different trajectories have been conceived. Mainly Cartesian and radial trajectories are discussed in this paper.
A. Cartesian Sampling
In conventional MRI, k-space information is line-by-line sampled, commonly known as Cartesian sampling. The main benefit of this sampling is that all the sample points are directly placed on a grid at an equal distance. Hence, it is easy to carry out simple method of reconstruction using an Inverse Fast Fourier Transform (IFFT). Other advantage is it reduces sampling errors that occur in the starting point of a trajectory due to weak signal. Cartesian sampling trajectory starts at one edge of k-space and ends at the opposite edge. During this period, gradient Gx is constant and Gy = 0.
Before starting each trajectory, the gradient goes to the starting point of the trajectory. In Cartesian sampling, k-space is sampled in straight path parallel to kx- axis.
Sampling interval generally equals to the distance between two successive trajectories.
The 2D random sampling method is constructed based on the concept of 2D variable density sampling technique and has high sampling density closer to the centre of k-space. At a location in k-space, the probability function for sampling is given by (3) [9]:
(3)
Where, , , and is real number that lies between 0 to 1. is a parameter which restricts the samples count to be considered. Both and are selected randomly by trial and error method. Conventional MRI scanners cannot implement 2D random sampling physically instead they use 1D random sampling. The 1D random sampling method is constructed based on the concept of 1D variable density sampling technique and has high sampling density closer to the k-space centre. The resulting probability function is given by:
[image:2.595.391.461.47.129.2]
(4)
Fig. 1. 1D Variable density Cartesian Sampling
B. Radial Sampling
In 1973, Lauterbur first proposed the radial acquisition method [11]. In Cartesian sampling, the k-space data is line-by-line sampled, where, in radial sampling it is done along the spokes. The first spoke of trajectory is a spoke with angle taken from the middle row. Hence other spokes can also be acquired by taking combination of neighborhood gradients in x- and y- directions, resulting in rotation of spokes around the center of k-space [10]. Generally similar gradient signals are utilized for all spokes, while a variation is maintained in gradient amplitudes in both x- and y- directions and given by the following equations as:
(5)
[image:2.595.386.466.420.502.2]Where, denotes the desired spoke angle, and is the central k-space row amplitude required for sampling. This technique provides constant timing sequence and permits direct application on a MRI system, thus making the traditional Cartesian sequence to easily adapt radial sampling with a less effort. Fig. 2 shows the radial sampling trajectory.
Fig. 2. Radial Sampling
IV. PROPOSED METHOD
The proposed sampling method reveals a different technique apart from 1D variable density sampling. It uses two orthogonal 1D variable density samplings in Cartesian k -space and denser sampling near the center. The probability function is given by
(6)
The parameters defined in (6) are same as in (3). refers to a constant depending on the count of sampling lines in ky
[image:2.595.101.231.694.722.2]
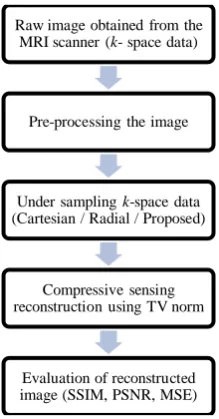
Fig. 3. Flow chart of the proposed method
In traditional Cartesian Magnetic Resonance Imaging, two encoding gradients namely phase and frequency, are applied in k-space on orthogonal directions [12]. At each excitation, amplitudes of phase encoding gradient change to samples for various lines in k-space. Therefore, by just randomly varying the phase encoding gradient amplitudes, 1D random sampling can be done easily. But the same scenario is complicated with the 2D random sampling, since it requires random changes in both frequency and phase encoding gradients simultaneously. In present systems, high amplitude and high slew-rate are limiting the gradients, causing peripheral nerve stimulation.
Hence, an intermediate sampling between 1D and 2D sampling schemes is considered for the proposed method, varying both amplitude and direction of phase encoding gradient. To under sample an image, if lines are to be captured, in kx direction lines are acquired with
phase encoding and in ky direction they are acquired with
frequency encoding. Here the parameter is determined by
the under sampling ratio and the variable takes the value , is constant in (6). The other lines are acquired in ky direction with phase encoding and in kx direction with
frequency encoding. In both the cases, the data is fully sampled in frequency encoding direction and randomly sampled only in phase encoding direction.
V.EXPERIMENTAL RESULTS
Simulation and experiments were carried out on 256×256 MR images and the reconstruction outcomes of proposed sampling are compared with the existing 1D variable density Cartesian sampling and radial sampling. Original brain, spine, knee and shoulder MR images are shown in Fig. 4(a-d). From the samples of 1D Cartesian sampling, Radial sampling and the proposed sampling, various MR images are reconstructed. Fig. 5(a-d) shows 1D Cartesian sampling patterns and reconstruction results at various sampling percentage as 60%, 50%, 40% and 30%. Cartesian sampling patterns are obtained using the Probability Density Function (PDF) given by (4).The PDF region closer to the center widens with increase in sampling percentage. These patterns are used to under sample MR images and TV minimization is used for reconstruction.
For different percentages, radial sampling trajectories are shown in Fig. 6(a-d). These sampling trajectories are used to under sample original MR images. Then by applying TV minimization to the under sampled data, magnetic resonance images are reconstructed. It is observed that as the sampling percentage increases, the count of radial lines in sampling pattern also increases and there by improves the quality of the reconstructed image. The proposed sampling patterns for 60%, 50%, 40% and 30% sampling percentage and the corresponding reconstructed MR images are shown in Fig. 7(a-d). From the results obtained, the sampling method proposed is predominant over 1D Cartesian sampling and radial sampling schemes.
[image:3.595.50.289.508.701.2](a) (b) (c) (d)
Fig. 4. Original MRI Images (a) Brain (b) Spine (c) Knee (d) Shoulder
(Courtesy: Pinnacle Hospitals, Visakhapatnam, India)
Raw image obtained from the MRI scanner (k- space data)
Pre-processing the image
Under sampling k-space data (Cartesian / Radial / Proposed)
Compressive sensing reconstruction using TV norm
Evaluation of reconstructed image (SSIM, PSNR, MSE)
(a)
Fig. 5. 1D Cartesian sampling patterns and reconstructed Magnetic Resonance images for various sampling percentage (a) 60% (b) 50% (c) 40% and (d)
[image:4.595.50.290.523.767.2]30% and Corresponding reconstructed MR images
Fig. 6. Radial sampling patterns and reconstructed Magnetic Resonance images for various sampling percentage (a) 60% (b) 50% (c) 40% and (d)
30% and Corresponding reconstructed MR images
(d) (c)
(a) (a)
Fig. 7. Proposed sampling patterns and reconstructed Magnetic Resonance images for various sampling percentage (a) 60% (b) 50% (c) 40% and (d)
30% and Corresponding reconstructed MR images
(c) (b)
(d)
(a)
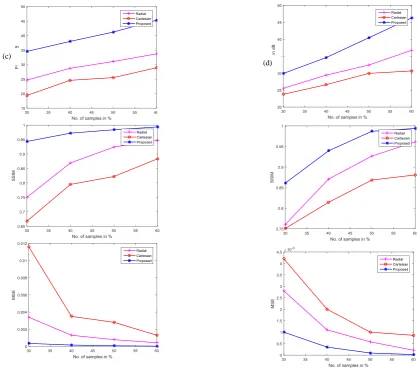
Fig. 8. Comparing PSNR, SSIM and MSE for reconstructed MRI of (a) brain (b) spine (c) knee and (d) shoulder images respectively
Applying total variation minimization enhances the quality of the reconstructed MR images. Error between the pixels along both horizontal and vertical directions is reduced by using Total variation. To test the reconstructed MR images, sampling patterns are considered at different sampling percentages. As the sampling percentage decreases, the count of k-space samples reduces and the effect of artifacts will be more. Compressive sensed k-space data is reconstructed and compared using the performance evaluation parameters, Structural Similarity Index Metric (SSIM), Mean-Squared-Error (MSE) and Peak-Signal-to-Noise-Ratio (PSNR). Fig. 8(a-d) gives the comparison of these performance evaluation parameters for the three sampling schemes tested on different Magnetic Resonance images at various sampling percentages.
VI. CONCLUSION
Conventional sampling techniques follow Nyquist sampling theorem and images are sampled at a rate greater than or equal to Nyquist rate. This leads to acquisition of large amount of information. Using compressive sensing one can collect only important data from the image. A new sampling
and PSNR. The sampling method proposed in this paper is energy efficient and reduces aliasing that occurs at low frequency, which generally present in under sampling process. Significant improvement in PSNR can be observed using the proposed sampling when compared to the radial sampling and 1D Cartesian sampling. High sampling density close to the k-space center is giving better reconstruction results.
REFERENCES
1. Lustig M., Donoho D. and Pauly J.M., “Sparse MRI: The application of compressed sensing for rapid MR imaging”, Magnetic Resonance in Medicine, vol. 58, pp. 1182-1195, 2007.
2. Candes, E.J.Wakin, M.B, “An Introduction To Compressive Sampling”, Signal Processing Magazine IEEE, Vol.2 (5), March 2008.
3. E.Candes, J.Romberg, “Sparsity and incoherence in compressive sampling, Inverse Problems”, Vol.23, p.969, 2007.
4. Gamper, U., Boesiger, P., Kozerke, S. “Compressed sensing in dynamic MRI”, Magnetic Resonance in Medicine, 59, (2), pp. 365– 373, 2008.
5. Lustig, M., Donoho, D., Santos, J.M., et al.: “Compressed sensing MRI”, IEEE Signal Process. Mag., 2008, 2, (25), pp. 72–82 6. Shiqian Ma, Watao Yin and Amit Chakraborty, “An Efficient
Algorithm for Compressed MR Imaging using Total Variation and (c)
8. Liu Q, Wang S, Yang K, Luo J, Zhu Y, Liang D. “Highly under sampled magnetic resonance image reconstruction using two-level Bregman method with dictionary updating”, IEEE Trans. Med. Imaging 2013;32:1290–301.
9. M. Lustig, D. Donoho and J.M. Pauly, “Sparse MRI: The application of compressed sensing for rapid MR imaging,” Magnetic Resonance in Medicine, vol. 58, pp. 1182-1195, Dec. 2007.
10. Kieren Grant Hollingsworth, “Reducing acquisition time in clinical MRI by data under sampling and compressed sensing reconstruction”, Physics in Medicine & Biology, vol. 60, pp. 297– 322, 2015.
11. P.D. Lauterbur. “Image formation by induced local interactions: Examples employing nuclear magnetic resonance”, Springer Nature, 242:190–191, 1973.
12. M. A. Bernstein, K. F. King,, X. J. Zhou. “Handbook of MRI pulse sequences”. Boston, MA: Academic Press, 2004.
AUTHORS PROFILE
T.Surya Kavita received her B.Tech and M.Tech Degrees from JNTU, Kakinada, India and presently pursuing Ph.D in ECE department, JNTU, Kakinada, India. Currently she is working as Associate Professor in the Department of Electronics and Communication Engineering in Raghu Engineering College, Visakhapatnam, India with an Experience of 15 Years in teaching. She got a professional membership in IETE, ISTE. Her Research interests are Image Processing, Signal Processing and Communications.