Int. J. Electrochem. Sci., 7 (2012) 9271 - 9277
International Journal of
ELECTROCHEMICAL
SCIENCE
www.electrochemsci.orgShort Communication
Effect of Sodium Dodecyl Sulfate on Copper Anodic Dissolution
in Phosphoric Acid Solution
Deyu Li1, Ning Li1,*, Guofeng Xia1, Ning Xiao1, Zhen Zheng1, Wenjie Zhai1, Gang Wu2
1
School of Chemical Engineering and Technology, Harbin Institute of Technology, Harbin 150001, China
2
Materials Physics and Applications Division, Los Alamos National Laboratory, Los Alamos, NM 87545 USA
*
E-mail: [email protected]
Received: 30 August 2012 / Accepted: 19 September 2012 / Published: 1 October 2012
In Electrochemical Mechanical Planarization process (ECMP), concentrated phosphoric acid is usually used as electrolyte. Role of sodium dodecyl sulfate (SDS) in anodic dissolution of Cu in concentrated phosphoric acid was studied by Cyclic Voltammetry (CV), inhibition efficiency (IE) calculation and in-situ observation of the Cu electrode surface at anodic overpotentials. It was found that presence of SDS enhances surface passivation of Cu in both active and passive potential regions. Moreover, in the passive region, introduction of SDS results in fine, close-packed and stable layers of oxygen bubbles, which can effectively inhibit anodic dissolution of Cu. A correlation was established between the electrochemical impedance spectroscopy and the structure of the passive film. The values of Rct,Yct,Rf,Yf increase with the addition of SDS indicate that SDS is helpful to form the film of oxide
copper. Therefore, SDS can be used as an additive to achieve excellent planarization efficiency for ECMP.
Keywords: Sodium dodecyl sulfate, phosphoric acid, Cu, inhibitor, electrochemical mechanical planarization
1. INTRODUCTION
and low defect rate, etc. In ECMP, dissolution inhibitor for anode is added to polishing electrolyte solutions in order to obtain uniform and flat surface layer of Cu. Dissolution inhibitor can effectively prevent nano-scale recessed areas from dissolution by forming physical layer with closed-packed structures on Cu. During ECMP process, tiny protrusions are removed by combined forces of mechanical polishing, anodic dissolution and chemical reaction of phosphoric acid, and the recessed areas remain intact due to the presence of physical barrier of adsorbed inhibitor. In this way, excellent planarization efficiency can be achieved. The most commonly used Cu corrosion inhibitors, such as benzotriazole (BTA)[7-9], 5-phenyl-1H-tetrazole (PTA)[7, 10] and ammonium dodecyl sulfate (ADS)[4-6], etc, have been employed as dissolution inhibitors for Cu planarization. BTA is probably the best efficient Cu dissolution inhibitor; however, its effect is diminished in concentrated phosphoric acid[11]. Y. Hong et al. studied Cu planarization process in electrolyte solution which is composed of aminoacetic acid and hydrogen peroxide[12]. It was found that ADS is more effective than BTA for corrosion inhibition at low concentrations. Roy D indicates that passive layer on Cu can be readily formed by using BTA and ADS together[1]. PC Goonetilleke found that ADS is a good corrosion inhibitor on Cu in CMP and ECMP processes[13]. The author attributed the corrosion inhibiting ability of ADS to the formation of semi-micelles, which adsorb on Cu and become compact physical barrier.
In this study, SDS was used as dissolution inhibitor for Cu electrochemical mechanical planarization. Cu electrode surface was monitored in-situ by optical microscope during anodic dissolution of Cu, and role of SDS in Cu electrochemical mechanical planarization was investigated.
2. EXPERIMENTAL
Cu (99.95% purity) plate with 1mm thickness was used as working electrode, Pt as counter electrode and Hg/Hg2SO4 was used as reference electrode. Experiments were conducted in an H
electrochemical cell. 85% phosphoric acid solution was used as electrolyte and 1g/L SDS was used as dissolution inhibitor. SP-150 electrochemical station (Biologic, France) was used for Cyclic Voltammetry study. KLN-J500 400× USB Digital Microscope was used for in-situ observation of the Cu dissolution under anodic potentials, and surface images of Cu were captured with a computer.
The electrochemical test cell was composed of the Cu working electrode, the platinum counter electrode and the Hg/Hg2SO4 reference electrode with a Luggin probe. EIS measurements were
performed with BIOLOGIC SP-150 electrochemical workstation and operated over the frequency range from 105 to 10-1 Hz. A small amplitude perturbation of 10 mV in a sine wave was applied to ensure the linearity for impedance analysis. Prior to each EIS measurement, the potential was held for 10 min to form a passive film.
3. RESULTS AND DISCUSSION
region was reached as anodic potential increased to 0.4V, and O2 was not released until potential
reached 1.5V. As shown in Figure 1, dissolution current in the active region was lower with than without the presence of SDS. Moreover, with SDS the passive current was stable, and passive region was reached at a lower anodic potential. As the anodic potential passed 1.5V (Figure 1b), passive current began to decrease until it reached the minimum at 1.7V, after which the current began to increase.
-0.2 0.0 0.2 0.4 0.6 0.8 1.0 1.2 1.4 1.6 1.8 2.0 -5
0 5 10 15 20 25 30 35
j
(m
A
/c
m
2 )
E (V vs. Hg/Hg2SO4)
-0.2 0.0 0.2 0.4 0.6 0.8 1.0 1.2 1.4 1.6 1.8 2.0 -5
0 5 10 15 20 25 30 35
j
(m
A
/c
m
2 )
E (V vs. Hg/Hg2SO4)
(a) (b)
Figure 1. CV curves for Cu anodization in 85% phosphoric acid solution (a) and in 85% phosphoric
acid solution containing 1g/L SDS (b).
0.0 0.4 0.8 1.2 1.6 2.0
0 15 30 45 60 75
IE
(%
)
E(V vs. Hg/Hg
[image:3.596.62.497.203.370.2]2SO4)
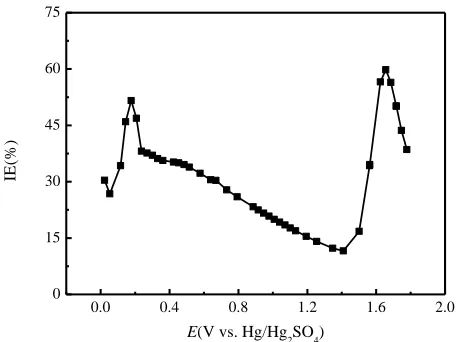
Figure 2. Plot of Inhibition Efficiency (IE) of SDS on Cu in 85%wt phosphoric acid vs applied anodic potential E.
Based on the CV curves for Cu anodization, Inhibition Efficiency (IE) of SDS for Cu in Phosphoric acid solution was obtained, which was calculated by using the following equation:
[image:3.596.176.405.438.609.2]
As shown in Figure 2, anodic dissolution of Cu in phosphoric acid was inhibited in the active region, passive region and O2 releasing potential region due to the addition of SDS. In active region
(0~0.4V), IE of SDS on Cu increased with applied anodic potential, with a maximum value of 51%; while in passive region (0.4V~1.5V), IE decreased from 40% to 11% as the applied potential became higher. In O2 releasing region (1.5~1.8V), IE increased to 60% and then decreased. The inhibition
effect of SDS on Cu in active and passive regions is probably due to the fact that SDS molecules adsorb on Cu and form semi-micelle clusters with a close-packed structure.Anodization of the Cu electrode surface was monitored in-situ by optical microscope. O2 was found when applied anodic
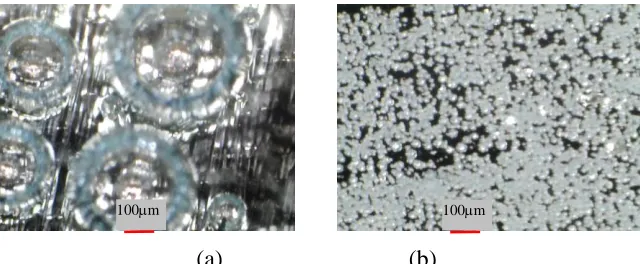
potential on Cu in phosphoric acid solutions increased to 1.5V. In 85wt% phosphoric acid containing no SDS, O2 bubbles escaped from Cu surface to bulk solution without adhering on Cu, and diameters
of the bubbles were found to be in the range of 300 to 400 µm (see Figure 3a). In contrast, with SDS in phosphoric acid, O2 bubbles adhered on Cu surface, forming compact layers of tiny bubbles. The
bubbles, with diameters of 10~20m (see Figure 3b), covered the whole surface area of Cu electrode. As anodic potential was further increased to 1.8V, large amount of O2 was produced and O2 bubbles
were seen to detach from Cu surface. When the Cu electrode was pulled out from electrolyte solution to air, the O2 bubble layer stayed on electrode surface for 60s, and then disappeared. The stable,
compact layers of tiny O2 bubbles adhering on Cu act as a physical barrier between Cu and the
planarization electrolyte solution, which reduces effective surface area of Cu electrode, and therefore, reduces the passive current on Cu. A minimum current had been observed, as shown in Figure 1b. As more O2 was produced, the physical barrier formed with O2 layers was damaged by collision with
escaping O2 bubble from electrode surface, and thus, resulting in the increase in passive current.
乐
[image:4.596.140.460.453.585.2](a) (b)
Figure 3. Pictures of O2 generated from Cu surface in a CV test under the following conditions: (a) in
85%wt H3PO4 solution at 1.6V; (b) in 85%wt H3PO4 solution containing 1g/L SDS at 1.6V.
Figure 4 exhibit 3-D Bode phase plots for a Cu electrode obtained at various anodic potentials in the potential range 0.5 to 1.4V. in 85%H3PO4 electrolyte (Figure 1a) with 1g/L SDS (Figure 1b).
Bode phase plots of Figure 1 shows two maximum peaks at intermediate frequency, which indicate the presence of two time lags. Nyquist plots also exhibits a double-semicircle mode with increasing frequency in a counter-clockwise direction. Therefore, a double-capacitance mode is used to fit these EIS data of Cu interface. Similar to others model[14-19], the equivalent circuit simulating the interface behavior of Cu ECMP is depicted in Figure 5 where Rs is the solution resistance; Rf, the passive-film
resistance; Rct, the charge-transfer resistance; CPEf, the passive-film constant phase elements; and
CPEdl, the double-layer constant phase elements. In the case of a non-uniform surface with distributed
elements, the ideal capacitive element would be replaced by the constant-phase element (CPE), and then the EIS results of the practical electrodes could be fitted more agreeably. The equivalent circuit exhibits two capacitive loops, one for the solid–electrolyte interface (Rct, CPEdl) in high frequency and
one for the passive film (Rf, CPEf) in low frequency.
-1 0 1 2 3 4 5 1.4 1.2 1.0 0.8 0.6 0.4 0 30 60 90 120 Freq uenc
ies / log(
Hz)
-P ha
s
e a
n
g
le / d eg re
s
s
E/V v
s H g/Hg 2SO 4 -1 0 1 2 3 4 5 1.4 1.2 1.0 0.8 0.6 0.4 0 30 60 90 120 Fre quen
cies / log(
Hz)
-Ph as e a ng le / d
e
g
re ss
E /V v
s H g/Hg
2SO 4
(a) (b)
[image:5.596.124.475.196.397.2]Figure 4. 3-D Bode phase plots for a Cu electrode obtained at various anodic potentials in the potential range 0.5 to 1.4V. (a) 85%H3PO4,(b) 85%H3PO4+1g/L SDS
Figure 5. Equivalent-circuit diagram used to fit the EIS results in Figure 4
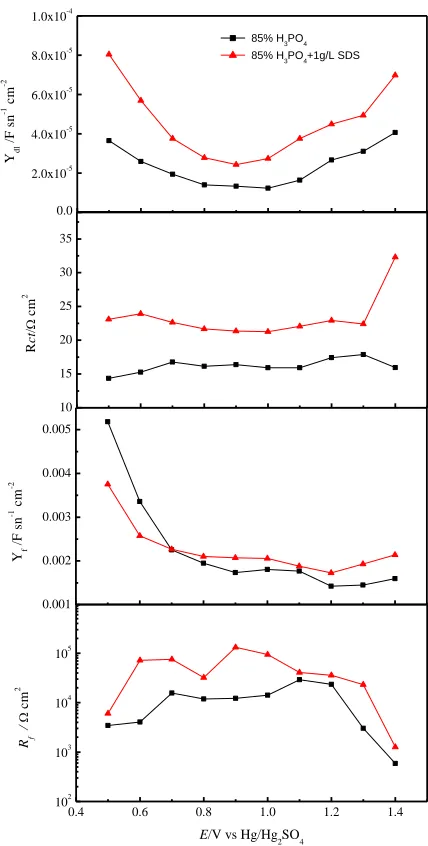
Rct, the charge transfer resistance, is typical for metal electrodes not blocked by an oxide film.
As Figure 6 shows the best-fit results for Rct are ~17cm2 in 85wt% H3PO4 and ~23cm2 in
SDS-containing electrolyte. A smaller charge transfer time delay, defined as RctCdl , led to a faster Cu
dissolution rate[2]. The charge transfer time delay increased in SDS-containing solution indicating that SDS significantly had inhibited the Cu dissolution in H3PO4. The value of Yf increases with the
increase of anodic potentials. Yf is consistent with the oxide film thickness(Lf), Yf = 0/Lf)[20].
Therefor film thickness of copper oxide is increases with the increase of anodic potentials and increase with the addition of SDS. the addition of SDS also increase Rf by ~10 times. The results show that
[image:5.596.248.347.467.537.2]
Figure 6. Best-fit results of each element of the equivalent circuit in Figure 6 to the impedance spectra in Figure 5
4. CONCLUSIONS
It was demonstrated that anodic dissolution of Cu in phosphoric acid solution at different applied potentials was inhibited when SDS was added. In both active and passive potential regions, the inhibition effect was resulted from the adsorption of SDS on Cu. At high anodic potentials, O2 was
generated from Cu surface, and tiny O2 bubbles aggregated on the whole electrode surface. The
compact O2 layers acted as a physical barrier between Cu and electrolyte solution, preventing Cu from
further dissolution, which increased the inhibition efficiency. Therefore, SDS can be used as an additive in phosphoric acid electrolyte to achieve excellent planarization efficiency for Cu electrochemical mechanical planarization.
0.4 0.6 0.8 1.0 1.2 1.4
102 103 104 105
Rf
/
cm
2
E/V vs Hg/Hg
2SO4
0.001 0.002 0.003 0.004 0.005
Yf
/
F
s
n
-1 c
m
-2
10 15 20 25 30 35
R
ct
/
cm
2
0.0 2.0x10⁻⁵ 4.0x10⁻⁵ 6.0x10⁻⁵ 8.0x10⁻⁵ 1.0x10⁻⁴
85% H3PO4 85% H3PO4+1g/L SDS
Ydl
/
F
s
n
-1 c
m
This paper has presented the EIS results accompanied with the simulated equivalent circuit for Cu in 85wt% H3PO4. The effects of sodium dodecyl sulfonate(SDS) on the oxide film forming of Cu
have also been analyzed and discussed. The values of Rct, Yct, Rf, Yf increase with the addition of SDS
indicate that SDS significantly has inhibited the Cu dissolution in H3PO4 and increase the film
thickness of copper oxide.
ACKNOWLEDGEMENTS
This research was financially supported by National Natural Science Foundation of China (no. 50975058)
References
1. B.S. Kim, S.P. Beaudoin, J Electrochem Soc, 156 (2009) H390.
2. T.-M. Kung, C.-P. Liu, S.-C. Chang, K.-W. Chen, Y.-L. Wang, J. Electrochem. Soc., 157 (2010) H763.
3. S.-C. Chang, J.-M. Shieh, C.-C. Huang, B.-T. Dai, Y.-H. Li, M.-S. Feng, Journal of Vacuum Science & Technology B: Microelectronics and Nanometer Structures, 20 (2002) 2149.
4. A.C. West, H. Deligianni, P.C. Andricacos, Ibm J Res Dev, 49 (2005) 37-48. 5. R. Vidal, A.C. West, J Electrochem Soc, 142 (1995) 2682-2689.
6. Y.F. Wu, T.H. Tsai, Microelectron Eng, 84 (2007) 2790-2798.
7. P. Cojocaru, F. Muscolino, L. Magagnin, Microelectron Eng, 87 (2010) 2187-2189.
8. Y. Hong, V.K. Devarapalli, D. Roy, S.V. Babu, J Electrochem Soc, 154 (2007) H444-H453. 9. M. Kodera, S. Uekusa, H. Nagano, K. Tokushige, S. Shima, A. Fukunaga, Y. Mochizuki, A.
Fukuda, H. Hiyama, M. Tsujimura, H. Nagai, K. Maekawa, J Electrochem Soc, 152 (2005) G506-G510.
10. A. Tripathi, C. Burkhard, I.I. Suni, Y. Li, F. Doniat, A. Barajas, J. McAndrew, J Electrochem Soc, 155 (2008) H918.
11. J.-Y. Lin, A.C. West, Electrochim Acta, 55 (2010) 2325-2331.
12. Y. Hong, D. Roy, S.V. Babu, Electrochemical and Solid-State Letters, 8 (2005) G297. 13. P.C. Goonetilleke, D. Roy, Appl Surf Sci, 254 (2008) 2696-2707.
14. I.I. Suni, B. Du, Ieee T Semiconduct M, 18 (2005) 341-349.
15. D. Padhi, J. Yahalom, S. Gandikota, G. Dixit, J Electrochem Soc, 150 (2003) G10. 16. . Babi , M. Metikos - ukovi , . Juki , J Electrochem Soc, 148 (2001) B146.
17. A. Tripathi, I.I. Suni, Y.Z. Li, F. Doniat, J. McAndrew, J Electrochem Soc, 156 (2009) H555-H560.
18. T.-H. Tsai, Y.-F. Wu, S.-C. Yen, Appl Surf Sci, 214 (2003) 120-135. 19. S. H. Glarum and J. H. Marshall, J. Electrochem. Soc., 132(1985)2872.
20. E. Barsoukov, J. R. Macdonald, Impedance spectroscopy: theory, experiment, and applications, John Wiley and Sons, 2005.