In the present study, we confirmed the enhancement of Pt dissolution during an oxygen evolution reaction (OER).In situanalysis using a channelflow double electrode showed anodic dissolution during the OER and cathodic dissolution from the reduction of Pt oxide. Pt dissolution during the OER showed transient dissolution behavior. Initiation of the OER triggered anodic Pt4+dissolution; however, the dissolution was strongly inhibited by the development of oxides. Reduction of oxides formed in the OER region required lower potential than those formed below 1.5 V. The lower reduction potential increased the reduction rate of oxides and enhanced the instantaneous dissolution rate of Pt2+.
[doi:10.2320/matertrans.M2015116]
(Received March 23, 2015; Accepted May 18, 2015; Published June 26, 2015) Keywords: platinum dissolution, oxygen evolution, channelflow double electrode
1. Introduction
Pt dissolution has attracted much interest in recent years and it destabilizes Pt-containing electrodes in oxygen electrochemistry.1) Currently, the majority of data reported on Pt dissolution is below 1.5 V (vs. standard hydrogen electrode (SHE)), corresponding to the potential to which the cathode of the proton exchange membrane fuel cells may be exposed.2) However, the use of Pt during an oxygen evolution reaction (OER) is inevitable.35) Such aggressive electrochemical conditions cause significant degradation of the Pt surface, which was mainly found to be induced by Pt dissolution.6,7) Otaet al.reported significant mass loss of Pt electrodes after the potential sweep from 0.1 to 2.3 V in acidic media.6)However, the mechanism of Pt dissolution during an OER remains unclear.
Pt dissolution below 1.5 V has been extensively re-ported.812)It occurs preferentially during transient processes such as potential cycling and is accelerated by the repeated formation and reduction of Pt oxide. Our group has detected Pt dissolution in oxide formation (anodic dissolution) and reduction (cathodic dissolution).8,9) Anodic dissolution re-sults from the interfacial place exchange between the adsorbed O atoms and the top layer of the Pt atoms.13) Conversely, cathodic dissolution correlates with the reduction of unstable PtO2. The amount of Pt dissolution increases with the upper potential limit (EU) of potential cycling because of the increasing amount of oxide formed and reduced.
In this study, we extended theEUinto the OER region and scrutinized the anodic and cathodic dissolutions by in situ analysis via a channelflow double electrode (CFDE) system. Using this system, we previously investigated the effects of chloride ions (Cl¹)10) and the scan rate11) on Pt dissolution below 1.4 V. In addition to the CFDE analysis, we combined potential cycling with ex situ measurement using inductively coupled plasma mass spectrometry (ICP-MS) to evaluate the enhancement of Pt dissolution in the OER potential region. Using these obtained data, we discuss the mechanism of the anodic dissolution of Pt during the OER as well as the cathodic dissolution and its dependences on EU and the duration of exposure to the OER.
2. Experimental
The sample used in this study was a Pt working electrode (Pt-WE) composed of a Pt film electrodeposited on a gold substrate.8)First, we evaluated the amount of Pt dissolution by ICP-MS wherein we conducted the potential cycling of the Pt-WE at 100 mV/s in 0.5 M H2SO4. TwoEU(s) of 1.4 and 2.0 V were used, and 300 cycles were performed for each EU. The lower potential limit (EL) was 0.05 V. Tests were conducted in a double-compartment stationary cell. An Au counter electrode was placed in a separate cell from the Pt-WE, avoiding the redeposition of Pt ions. After 300 cycles, the test solutions were analyzed by ICP-MS (Agilent Technologies Inc., 7700x).
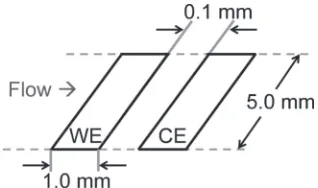
We then investigated the dissolution behavior of the Pt-WE in a single cycle using a CFDE system. The CFDE system consisted of a WE and a collector electrode (CE), as shown in Fig. 1. The collection number (N) of the WE-CE assembly was 0.3 as a result of its geometries,14)indicating that 30%of the dissolved Pt ions from the WE should have been collected on the CE; a polycrystalline Au plate was the CE. An Au wire serving as the counter electrode was placed downstream of the WE-CE, and a double-junction KCl-saturated Ag/ AgCl electrode was used as the reference electrode. However, all potentials were referred to the SHE. The electrolyte used was 0.5 M H2SO4, which was deaerated using Ar gas. The averageflow rate of the electrolyte was 20 cm/s.
In the CFDE system, Pt ions (Pt2+ and Pt4+) dissolved upstream from the WE were detected downstream on the CE. Pt4+ was detected when the CE was set at 0.7 V because of the reduction of Pt4+ to Pt2+ (eq. (1)). Conversely, the
Fig. 1 Schematic of a double electrode assembly.
[image:1.595.348.507.276.370.2]dissolution of Pt2+ was detected when the CE was set at 1.4 V, corresponding to the oxidation of Pt2+ to Pt4+ (eq. (2)).9)
0:7 V : Pt4þþ2e!Pt2þ ð1Þ 1:4 V : Pt2þ!Pt4þþ2e ð2Þ The detection of Pt on the CE produced a current response (collector current, IC) from which we calculated the amount of Pt dissolution from the WE. In the following plots, all residual currents of IC (approximately 15 nA at 1.4 V and ¹1³1 nA at 0.7 V) were subtracted for comparison.
In the CFDE tests, we used potential cycling and trapezoid polarization for the Pt-WE. For potential cycling, threeEU(s) of 1.4, 1.6, and 2.0 V were used, with three consecutive cycles performed at 20 mV/s for eachEU. The data from the third cycle were used for the results and discussion section. For the trapezoid polarization shown in Fig. 2, a singleEUof 2.0 V was used. The Pt-WE underwent holding for 60 s at 0.45 V, an anodic scan from 0.45 to 2.0 V at 20 mV/s, holding at 2.0 V, and a cathodic scan from 2.0 to 0.05 V at 20 mV/s. Five values of the holding time (tH) at 2.0 V were used®0, 300, 600, 900, and 1200 s. For each trapezoid polarization, two individual cycles were performed and data from thefirst cycle were used. All measurements were performed on a multichannel potentiostat (PS-08, TOHO Technical Research, Japan) at 25°C.
3. Results and Discussion
3.1 Evaluation of Pt dissolution by ICP-MS
Figure 3 showed the cyclic voltammogram (CV) of the Pt-WE from 0.05 to 2.0 V at 100 mV/s with 0.5 M H2SO4 in a stationary cell. The CV in Fig. 3 was the second cycle of a 300 cycle test. The large current above 1.4 V indicated the OER. The potential region below 1.4 V was plotted on a magnified scale as an inset in Fig. 3. After 300 cycles between 0.05 and 2.0 V, the total amount of Pt dissolution was 520 ng and the value for an EU of 1.4 V was 86 ng (Table 1). This result confirmed the enhancement of Pt dissolution by exposing the Pt surface to the OER. Shifting theEUfrom 1.4 to 2.0 V resulted in an approximately six-fold enhancement of the Pt dissolution. In the following sections, we discuss the details of this enhancement using the in situ analysis of the anodic and cathodic dissolutions with the CFDE tests.
3.2 Anodic dissolution during the OER
Anodic Pt dissolution has been better understood.912) Above 1.2 V, the dissolved species was identified as a Pt4+
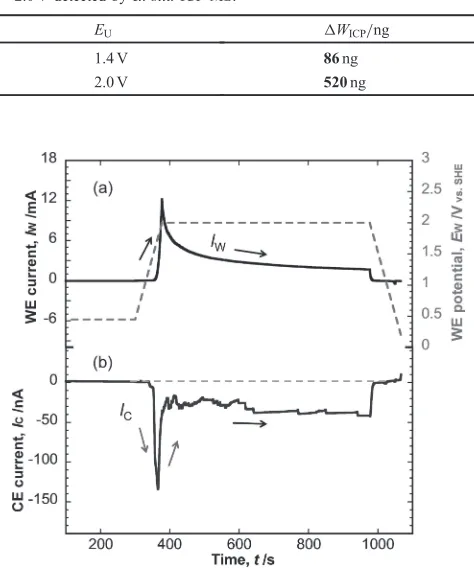
complex; the dissolved species could also be detected in a CFDE system by setting the CE at 0.7 V (eq. (1)). Figure 4 showed the time-resolved current of the WE (IW) when it underwent trapezoid polarization with the IC of the CE set at 0.7 V for the detection of Pt4+. The IW increased with an increase in the potential of the WE (EW) during the anodic scan from 0.45 to 2.0 V and decayed when the EW was constant at 2.0 V (Fig. 4(a)). The kinetics of the OER on Pt have been discussed in another study.15) The I
W decay was attributed to the formation and growth of Pt oxide.
2H2O!O2þ4Hþþ4e ð3Þ
Fig. 2 Trapezoid polarization profile of Pt-WE for CFDE tests.
[image:2.595.62.275.70.159.2]Fig. 3 CV of Pt-WE at 100 mV/s with an EU of 2.0 V obtained in a stationary cell.
Table 1 Amount of Pt dissolved after 300 cycles with theEUof 1.4 and 2.0 V detected byex situICP-MS.
EU ¦WICP/ng
1.4 V 86ng
2.0 V 520ng
[image:2.595.312.543.73.221.2] [image:2.595.308.545.289.573.2]TheICin Fig. 4(b) showed a sharp peak during the anodic scan of the WE in the OER region. This peak may be attributed to the reduction of Pt4+ or O2, which were generated from the WE during the OER. To elucidate the influence of O2on the detection of Pt4+on the CE at 0.7 V, we conducted a cathodic polarization of the CE from 1.1 to 0.4 V at 0.5 mV/s and the WE was held at 2.0 V or rested at open circuit potential (OCP) in a CFDE with 0.5 M H2SO4. The cathodic polarization curves of the CE were shown in Fig. 5. When the potential of 2.0 V was applied to the WE, a large amount of O2 evolves from the WE and the CE (solid line) current began to increase below 0.6 V. When the WE was constant at OCP, O2was not detected on the CE and the ICwas constant against theECuntil 0.4 V. Note that reduction of O2on the CE occurred below 0.6 V, as represented by the rapid increase. Thus, the reduction of O2 on the CE was negligible when the CE was held at 0.7 V. The peak in theIC in Fig. 4(b) indicated the detection of Pt4+.
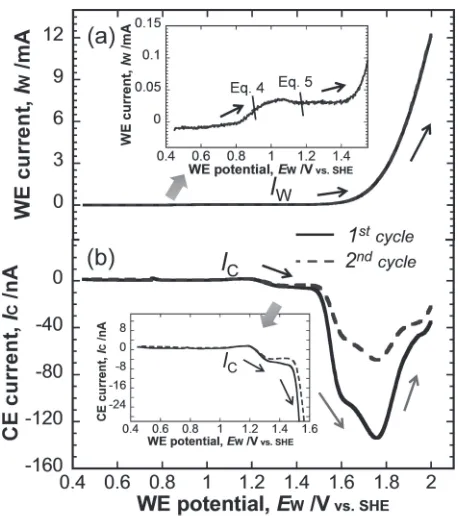
The IW(s) and IC(s) in the anodic scan of Fig. 4 were plotted against EW in Fig. 6. The rapid increase in IW (Fig. 6(a)) indicated the initiation of the OER. Prior to the OER, the Pt surface experienced oxygen adsorption (eq. (4)), the interfacial place exchange of the adsorbed oxygen atoms with the top layer of the Pt atoms, and the formation of PtO2 (eq. (5)),13,16,17) as represented by the I
W in the inset of Fig. 6(a). OER (eq. (3)) increased with EWand changes the composition and structure of the oxide layer.1822)
PtþH2O!Pt-Oþ2Hþþ2e ð4Þ Pt-OþH2O!PtO2þ2Hþþ2e ð5Þ TheIC(s) in Fig. 6(b) represented the detection of Pt4+on the CE. TheICbegan to increase near 1.2 V and continued to increase withEWuntil it saturates at 1.3 V. In this region, the place exchange of the adsorbed oxygen atoms with the top layer of the Pt atoms induced Pt4+ dissolution (eqs. (6), (7)).9,11) Saturation may be attributed to the growth of the Pt oxide as the potential increases.16,17) Above 1.55 V, the IC increased with EW to 1.75 V, after which it decreased. Thus, the initiation of the OER triggered the dissolution of Pt4+.
Pt-Oþ2Hþ!Pt4þþH2Oþ2e ð6Þ PtO2þ4Hþ!Pt4þþ2H2O ð7Þ
The enhancement of Pt4+ dissolution at the beginning of the OER may be attributed to the local pH decrease, as illustrated in Fig. 7. The OER (eq. (3)) generated large amounts of H+ and created a local low pH zone near the reaction site, leading to the depassivation of the Pt oxide (eq. (6) or (7)).
The Pt dissolution rate also increased with the increasing rate of H+ generation. However, as the OER proceeded, it also stabilized the oxide layer1822) and inhibited Pt dissolution. Consequently, Pt4+ dissolution decayed after 1.75 V despite the ongoing OER. Therefore, the OER had a dual effect on the anodic dissolution of Pt. Moreover, the rapid decay of the anodic dissolution in the OER region was observed from thefirst to second cycle. TheICof the second cycle in Fig. 6(b) was diminished from that of thefirst cycle, although the IW values of the two consecutive cycles were nearly identical (Fig. 6(a)).
3.3 Cathodic dissolution during oxide reduction In a cathodic scan, Pt dissolved as Pt2+ during the
Fig. 5 Cathodic polarization curves of CE from 1.1 to 0.4 V at 0.5 mV/s in 0.5 M H2SO4. WE is held at 2.0 V or rests at OCP in two individual experiments, respectively.
Fig. 6 (a)IWof the Pt-WE of the anodic scan at 20 mV/s from 0.45 to 2.0 V under trapezoid polarization for two consecutive cycles and (b) the correspondingICof CE at 0.7 V for the detection of Pt4+.
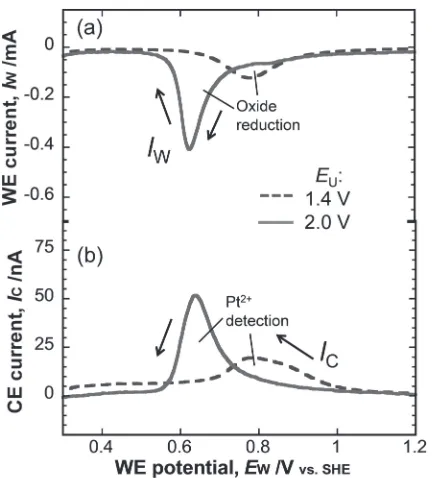
[image:3.595.62.279.67.210.2] [image:3.595.350.502.383.507.2]reduction of PtO2 (eqs. (8) and (9)).911,23) This cathodic dissolution of Pt2+was influenced by theEUof the potential cycling. Figure 8(a) showed theIWduring the cathodic scans of potential cycling at 20 mV/s withEUof 1.4 and 2.0 V. The peaks in Fig. 8(a) represented the reduction of Pt oxide. When theEUwas increased from 1.4 to 2.0 V, the reduction peak narrowed and displayed a negative shift from ca. 0.8 V to ca. 0.62 V. The oxide formed during anodic polarization in the OER region has been extensively discussed.1822) Given their similar reduction potentials, the oxides in the present study corresponded to the ¡-oxides described by Shibata.18) As such, the oxides may be a mixture of PtO and PtO2, the ratios of which are currently unclear.
PtO2þ4Hþþ4e!Ptþ2H2O ð8Þ PtO2þ4Hþþ2e!Pt2þþ2H2O ð9Þ The ICin Fig. 8(b) was recorded on the CE at 1.4 V and represented the detection of Pt2+ as described in eq. (2). From Fig. 8(b), when theEUwas raised from 1.4 to 2.0 V, the IC was increased with the sharper shape and the peak of IC was shifted to negative potentials, corresponding to the change of the reduction current in Fig. 8(a). Note that the instantaneous dissolution rate of Pt2+ was enhanced by increasing the EUfrom 1.4 to 2.0 V. The peak value of the solid line (EU=2.0 V) reached ³50 nA, which represented 166 pg/s of the WE, and the peak value of the gray line (EU=1.4 V) was only about 66 pg/s. This enhanced dissolution rate was because of reduction of larger amount of Pt oxide at a more negative potential.
The amount of cathodic dissolution in one cycle of potential cycling (¦WCFDE) can be calculated by integrating the charge of the peak ofICin Fig. 8(b), which was plotted in Fig. 9. Note that ¦WCFDEincreased with theEUof potential cycling. This increase was because of the increasing amount of Pt oxide reduced in the cathodic scan. The reduction
charge (Qr), integrated from the peak in theIWin Fig. 8(a), also increased withEU(Fig. 9).
When the WE was held constantly at 2.0 V for atHof 600 s after the anodic scan, the reduction peak in theIWexhibited a further shift from 0.62 to 0.53 V, as shown in Fig. 10(a). The reduction potential suggested that the oxide is approaching a type-I ¢-oxide, as described by Burke19,20) and Birss.22) Correspondingly, theIC(Fig. 10(b)) also showed an increase in the instantaneous dissolution rate. However, extended holding at 2.0 V for 1,200 s did not result in significant changes in either the oxide reduction or the cathodic dissolution of Pt2+; theIWand IC remained nearly identical to those after holding for 300 s (Fig. 10).
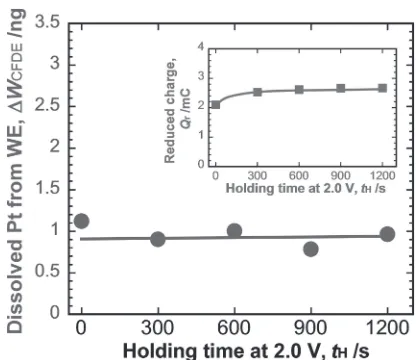
The amount of cathodic dissolution in one cycle of trapezoid polarization (¦WCFDE) was calculated by integrat-ing the charges of the peaks of ICin Fig. 10(b), which was plotted in Fig. 11 against tH. It appeared that ¦WCFDE was independent of tH as the amount of Pt oxide reduced was nearly identical to that represented by the reduction charges
Fig. 8 (a)IWin the cathodic scan of potential cycling at 20 mV/s withEU of 1.4 and 2.0 V and (b) corresponding ICof CE set at 1.4 V for the detection of Pt2+. OnlyE
Wregion from 1.2 to 0.3 V is plotted.
[image:4.595.62.278.67.306.2]Fig. 9 Amount of dissolved Pt (¦WCFDE) and reduced charge (Qr) during cathodic scan versusEU.¦WCFDEandQrwere calculated by integrating the peak charges ofICandIWin Fig. 8.
[image:4.595.332.518.73.207.2] [image:4.595.319.536.263.498.2]in the inset of Fig. 11. During the potential holding at 2.0 V for longer period than 300 s, the Pt oxide layers did not change significantly.
4. Conclusions
In the present study, we confirmed the enhancement of Pt dissolution by an OER. The in situ analysis with a CFDE suggested the following:
Initiation of the OER triggers anodic Pt4+ dissolution; however, it is strongly inhibited by the development of oxides.
Reduction of oxides formed in the OER region requires lower potential than that of oxides formed below 1.5 V. The lower reduction potential increases the reduction rate of oxides and enhances the instantaneous dissolution rate of Pt2+.
Acknowledgements
The authors thank the Ministry of Education, Culture, Sports, Science and Technology forfinancial support and Ms.
2) C. A. Reiser, L. Bregoli, T. W. Patterson, J. S. Yi, J. D. Yang, M. L. Perry and T. D. Jarvi:Electrochem. Solid-State Lett.8(2005) A273 A276.
3) R. Arrigo, M. Hävecker, M. E. Schuster, C. Ranjan, E. Stotz, A. Knop-Gericke and R. Schlögl: Angew. Chem. Int. Ed.52 (2013) 11660 11664.
4) J. Pettersson, B. Ramsey and D. Harrison:J. Power Sources157(2006) 2834.
5) S. Park, Y. Shao, J. Liu and Y. Wang:Energy Environ. Sci.5(2012) 93319344.
6) K. Ota, S. Nishigori and N. Kamiya: J. Electroanal. Chem.257(1988) 205215.
7) S. Mitsushima, S. Kawahara, K. Ota and N. Kamiya:J. Electrochem. Soc.154(2007) B153B158.
8) Y. Sugawara, T. Okayasu, A. P. Yadav, A. Nishikata and T. Tsuru:
J. Electrochem. Soc.159(2012) F779F786.
9) Z. Wang, E. Tada and A. Nishikata:J. Electrochem. Soc.161(2014) F380F385.
10) Z. Wang, E. Tada and A. Nishikata:J. Electrochem. Soc.161(2014) F845F849.
11) Z. Wang, E. Tada and A. Nishikata:Electrocatalysis6(2015) 179184.
12) A. A. Topalov, S. Cherevko, A. R. Zeradjanin, J. C. Meier, I. Katsounaros and K. J. J. Mayrhofer:Chem. Sci.5(2014) 631638.
13) G. Jerkiewicz, G. Vatankhah, J. Lessard, M. P. Soriaga and Y. Park:
Electrochim. Acta49(2004) 14511459.
14) H. Matsuda: J. Electroanal. Chem.16(1968) 153164.
15) J. Willsau, O. Wolter and J. Heitbaum: J. Electroanal. Chem. 195
(1985) 299306.
16) A. Sun, J. Franc and D. Macdonald:J. Electrochem. Soc.153(2006) B260B277.
17) H. Imai, K. Izumi, M. Matsumoto, Y. Kubo, K. Kato and Y. Imai:
J. Am. Chem. Soc.131(2009) 62936300.
18) S. Shibata: J. Electroanal. Chem.89(1978) 3758.
19) L. D. Burke, J. J. Borodzinski and K. J. O’Dwyer:Electrochim. Acta
35(1990) 967973.
20) L. D. Burke and D. T. Buckley:J. Electroanal. Chem.405(1996) 101 109.
21) G. Tremiliosi-Filho, G. Jerkiewicz and B. E. Conway: Langmuir8
(1992) 658667.
22) S. J. Xia and V. I. Birss:Electrochim. Acta44(1998) 467482.
23) D. C. Johnson, D. T. Napp and S. Bruckenstein:Electrochim. Acta15
[image:5.595.64.272.67.247.2](1970) 14931509.