This is a repository copy of Response to automatic speed control in urban areas: A simulator study..
White Rose Research Online URL for this paper: http://eprints.whiterose.ac.uk/2113/
Monograph:
Comte, S.L. (1996) Response to automatic speed control in urban areas: A simulator study. Working Paper. Institute of Transport Studies, University of Leeds , Leeds, UK. Working Paper 477
[email protected] https://eprints.whiterose.ac.uk/ Reuse
See Attached
Takedown
If you consider content in White Rose Research Online to be in breach of UK law, please notify us by
White Rose Research Online
http://eprints.whiterose.ac.uk/Institute of Transport Studies University of Leeds
This is an ITS Working Paper produced and published by the University of Leeds. ITS Working Papers are intended to provide information and encourage discussion on a topic in advance of formal publication. They represent only the views of the authors, and do not necessarily reflect the views or approval of the sponsors.
White Rose Repository URL for this paper: http://eprints.whiterose.ac.uk/2113
Published paper
Comte, S.L. (1996) Response to automatic speed control in urban areas: A simulator study. Institute of Transport Studies, University of Leeds, Working Paper 477
UNIVERSITY
OF LEEDS
Institute for Transport Studies
ITS
Working Paper
477
September
1996
Response to automatic speed control in urban areas:
A simulator study
S L COMTE
ABSTRACT
1. INTRODUCTION
1.1 Speed and Accidents
1.2 Reducing speed
1 3 Response to automatic speed control in urban areas
2. METHOD
2.1 Subjects
2.2 Experimental Design
2.3 Apparatus and materials
2.4 Independent Variables
2.5 Dependent Variables
2.6 Procedure
3. RESULTS
3.1 Approach to junctions
3.2 Traffic light violations
3.3 Following behaviour
3.4 Speed on curves
3.5 Gap acceptance
3.6 Mental workload
4. SIGNIFICANCE OF RESULTS
4.1 Safety benefits
4.2 Safety costs
1. INTRODUCTION
1.1 Speed and Accidents
In 1994, the Department of Transport reported the annual number of road traffic casualties as being 315,189 (all road users) of which 3,650 were fatalities. With the estimated cost of each fatality at
£784,090 (includes lost output, medical and ambulance costs and human costs), it can be seen that
the total cost of fatal accidents is enormous. Empirical evidence suggests that driving too fast for the conditions is a major factor in accident causation. Sabey and Taylor (1980) reported that 22- 23% of accidents have speed as a contributory factor. Likewise,
the
Federal Office of Road Safety noted excessive speed to be at least a contributing factor in up to 30% of fatal crashes in Australia during 199112. A TRL review of the literature on the effect of speed concludel ;,at a lmph reduction on traffic speed produced a 5% reduction in accidents (Finch, Kompfner, Lockwood and Maycock(1994). The Department of Transport's 1994 speed survey reports that 47% of cars were exceeding the 70mph speed limit on motorways, 31% were breaking the speed limit in 40 mph zones and 69% were breaking it on 30 mph roads. It is likely that drivers adopt a speed which they perceive as being appropriate to the conditions with little regard for the posted speed limit (Garber and Gadirajn, 1989).There exists
a
complex relationship between speed and accident rates. Early research (Solomon, 1964) reported a relationship between crash involvement and speed. It was suggested that the cause of speed in road crashes was variance from the speed ofthe
rest of the traffic, ratherthan
absolute speed itself. The U-shaped hypothesis claimed that both slow and fast travel speeds relative to the mean speed were crash inducing. Munden (1967) also reported a U-shaped relationship between crash rate and relatve speed in the UK, similar for
that
reported by Solomon inthe
USA. He suggested that vehicles travelling morethan
one standard deviation above or below the mean speed had an inflated crash rate. More recently, the studies by Kimber (1990) and O'Neill (1990) on the relationship between speed, accidents and injury in Britain and the USA revealthat
a reduction in the posted speed limit results in a reduction in speeds, accident rates and accident severity. A recent study by Fildes, Rumbold and Leening (1991), although supported Solomon's claims regarding speed variance, failed to show any evidence that slow travel was associated with increased crashes.1.2 Reducing speed
The major safety benefits of reducing speed are thought to be diminished crash frequency and severity. Various interventions to achieve compliance with speed regulations have been implemented. These include:
(i) traffic calming
Various traffic calming measures have been implemented to encourage drivers to reduce their speed. These include the alteration of
the
vertical profile of the road (e.g. road humps and raised junctions) or the creation of horizontal deflections such as pinch points and chicanes. Engineering the road and its immediate environment has been shown to have long-term effects on changing driver behaviour (Russam, 1979; Silcock and Walker 1982; Wright and Boyle 1987). However, road humps can cause problemsand
inconvenience primarily for emergency services and bus operators. Also, vehicles traversing these devices, particularly those that intempt vertical alignment, can produce noise and miration, seen as detrimental to both road user and local residents. It is also possible that the instablion of traffic calming measures on isolated roads causes local diversions onto other roads and thus create accident migration. The measures should be implemented as part of an overall Urban Safety Management Strategy and they need to be viewed in terms of the whole transportation system. Traffic calming may have the potential to stem the flow of traffic in local environments, but if the arterial and collector roads are incapable of carrying the excess tr&c, there will be no overall gain to the system.(ii) feedback
A number of studies have been carried out using mobile roadside speedometers which consist of a speed limit sign, a Doppler radar emitter and receiver to measure speeds and a display that indicates the speed of an approaching vehicle. Thus drivers are able to observe
the
posted speed limitand
their own speed simultaneously. Casey and Lund (1993) conclude that mobile roadside speedometers can be used to help reduce urban traffic speeds, but only in the short-term. They suggest that occasional police enforcement in
the
vicinity of mobile roadside speedometers could extend the system effects over longer periods, andthat
their use may be limited to specific sites where speeding traffic is particularly hazardous (e.g., school zones and construction sites).The use of Variable Message Signs to display alternative types of feedback to drivers have also been evaluated. Some researchers (Van Houten and Nau 1981,1983; Van Houten, Rolider, Nau, Friedman, Becker, Chalodovsky, and Scherer 1985; Ragnarsson and Bjorgvinsson 1991) cite suppoaive evidence for the use of using feedback signs which display the percentage of vehicles not speeding in the previous day or week The effects were apparently as long lasting as 6 months after exposure, a result also achieved by Philips and Maisey (1989). However these results were not replicated by Roqu6
and
Roberts (1989) and it is doubtfulthat
these effects are transferable to roads where no feedback is given.(iii) enforcement
presence of the marked police vehicle did significant reductions in speeds occur. The authors conclude that driving speed is controlled more by threat of punishment than by the acceptance of the value of safe driving. However the costs related to this type of enforcement are extremely high and are
thus
impractical.Even if the necessary funds were available to increase the level of enforcement, there
is
evidence to suggest that the reduction in speed is not long-lasting (absence of time-halo). In addition, if enforcement were more stringent it would be likely that the prevalence of radar detectors in cars would rise. Teed, Lund and Knoblaunch (1993) found that drivers with radar detectors slow only briefly when alerted to the presence of police and that one mile after exposure, nearly half the reduction was recovered (absence of distance halo). These results are consistent with other studies using a variety of enforcement techniques, also demonstrating the absence of time and dktance halo e f f a e.g. Hauer, Ahlin and Bowser (1982).Speed cameras, which achieved legislation in 1994, are employed by about half the police forces in the UK. A trial in 1992 in London achieved fatal
and
serious accident reductions of 36% on roads which were fitted with speed cameras (Winnett 1994). However, again, the effect is localised, and thus they may be more usefully employed not as a general speed reduction measure but only at accident blackspots.(iv) public awareness campaigns
The use of public awareness campaigns have operated by trying to alter public attitudes towards speed (e.g.,
Kill
your speed, not a cud). Elliot (1993) conducted a meta-analysis examining the characteristics of successful and unsuccessful road safety campaigns. Campaigns were more effective when they were persuasive (rather than educative), if they were based on qualitative and quantitative research, contained simple and identifiable language and characters, were emotional (rather than rational)and
had legislative support. According to Andersson (1978), the problem can be divided into three parts :(i) The recipient must be motivated
(@The material must clearly communicate to the recipient what informationaL attitudinal and behavioural changes
are
necessary(iii)The recipient must make those changes.
It seems that many campaigns e.g. Glad (1986) and Downing and Spendlwe (1981) fail to meet these criteria. The above criteria also rely on the assumption that behavioural change will arise as a result of attitudinal change, however this correlation has been shown to be weak (Fishbein and Ajzen, 1975). Publicity campaigns are difficult to evaluate; evaluations are often beforeafter studies with no proper control condition. Elliot (1993) suggests that publicity may help create
a
desirable supportive climate of opinion in which other measures can operate.(v) perceptual countermeasures
Perceptual countermeasures attempt to alter the sensory scene available to the driver in order to reduce travel speed. The measures include special signing, transverse road markings and centre
(vi) antomatic speed control
The lack of success and consensus regarding the above speed reducing measures has led to the suggestion (e.g. Fildes
and
Lee 1993)that
controlling speed at its source, i.e. withinthe
vehicle, would be the next logical step in attempting to reduce the number of road accidents with speed as a contributory factor. British and European legislation since March 1988, has made it compulsory for coaches and most heavy goods vehicles to be fitted with speed limiters. Coaches are generally limited to a top speed of 65 mph and lorries are limited to either 56 mph or 60 mph. The Department of Transport report that the percentage of articulated lorries exceeding their 60 mph speed limit on motorways decreased from 43% in 1991 to 25% in 1994. However the percentage exceeding the 50 mph limit on dual carriageways rose from 72% in 1991 to 78% in 1994. So the top speed limiter enforces the speed limit on motorways but on other types of roads where accident rates are higher anyway, this sort of speed limiter is of littleuse.Almqvist, Hyd6n and Risser (1991) carried out a small self-observational study in Lund and cite the following advantages in installing speed limiters in cars:
Drivers may speed unintentionally due to difficulties in accurately judging their own speed and so the speed limiter would effectively take over the task of monitoring speed.
Speeding due to social pressure to keep up with the traffic will be decreased. Irrational or emotional driving causing inappropriate speed choice would be limited.
Environmental benefits such as reduction in fuel consumption, air and noise poktion would ensue.
However they also point to several possible disadvantages:
When the freedom to choose ones own speed is abolished, compensatory behaviour such as red - light violations may arise.
As a result of lost time, frustration may lead to increased speed in n o d y low-speed situations (e.g. turning manoeuvres).
Hogema, van de Horst and Janssen (1994) carried out
a
simulator evaluation of different forms of Intelligent Cruise Control (ICC). The ICC regulated vehicle speed and following distance, and there resulted in a reduction of the proportion of short headways and lngh speed in the controlled area; however it was found that a compensating m e c w m meant that by actively reducing driver's speed on a few limited sections made them drive faster in other areas. A second negative impact on safetywas
also discovered; it appeared that braking reactions were somewhat later, possfily due to either a decrease in driver vigilance as a result of autonomy, or to over-confidence in the system. This effect was also found in Becker and Sonutag's (1993) study on Autonomous Intelligent Cruise Control.Plowden and Hillman (1996) recommend that speed limits should be enforced by fming cars with variable speed limiters which are set by drivers to prevent vehicles travelling above
the
speed limit. The authors suggest that "The adoption of lower speed limits, enforced by variable speed limiters, will save Jives and make our towns safer for all road users, especially childrenand
old people. It will also reduce pollution and fuel consumption, weaken still fnrther the case for major new roads, and minimisethe
need for police involvement in enforcement. Speed control is an immensely powerful instrument of transport policy which has so far been little exploited."has been no detailed research undertaken to evaluate exactly how drivers react to being speed limited. Thus the present study, Response to automatic speed control in urban areas,
was designed to evaluate the effects of automatic speed limiters on driver behaviour.
1.3 Response to automatic speed control in urban areas
This study, carried out on the University of Leeds Advanced Driving Simulator, attempts to quantify some of the safety benefits and costs of the installation of an automatic speed limiter. The study focused on the two major issues of behavioural adaptation and the identification of problems that may arise in the transitional phase that would naturally occur if speed limiters were to be introduced onto the market. In addition, subjective measures were recorded in ordcr to evaluate whether speed limiters were beneficial or detrimental in terms of drivers' mental workload. In this study the speed limiter works by permanently restricting the top speed of the car; a pilot study produced the technical characteristics of the speed limiter (i.e. deceleration rates). In a real-world implementation it would more likely involve the installation of a roadside sender at every change of speed limit. This sender would emit impulses and each vehicle would be equipped with a receiver able to receive these impulses, automatically limiting the vehicle's maximum speed to the speed limit in question.
The study was designed to enable the investigation of different levels of system penetration and alternative types of speed limiters. Three levels of system penetration were implemented; the control condition where neither the subject nor the any of the other vehicles on the road were speed limited; a 'mixed fleet' scenario where half of the other cars on the road were speed limited; and finally the
full
implementation phase where all cars were speed limited. The 'mixed-fleet' scenario is an important consideration because if speed limiters were introduced onto the market the uptake would be gradual and problems may arise due to the unpredictability of the other traffic.In addition, two types of speed limiter were evaluated. The first, referred to as the 'general speed limiter', constantly restricted the driver to a maximum speed of 30mph. The second, referred to as the 'secondary speed limiter', was only activated in the vicinity of junctions, where it automatically restricted the driver to 25mph It is referred to as a secondary device as it is only conceivable as a second stage implementation. Appendix A contains the technical details of the speed li-r. It was decided that this was a potential area of interest as in built-up areas, almost two-thirds of fatal or serious accidents take place at junctions (Road Accidents Great Britain 1994), and thus to reduce the speed of vehicles around junctions maybe beneficial in terms of accident reduction and severity involving cars both on the minor and major road.
Using the University of Leeds Advanced Driving Simulator permitted the subjects to be exposed to carefully controlled conditions without personal risk. A subset of behaviours that were deemed to be important in the causality of accidents were selected for investigation. These were junction approach and negotiation, following behaviout and traffic light violations.
driving task may result in decreases in mental workload, thus inducing monotony and decreased vigilance. The pilot study allowed the evaluation of different types of subjective measurement (Anderson, 1996). It was decided that the NASA RTLX (adapted from Byers 1989) would be an appropriate tool to use. The NASA RTLX contains the same elements as the TLX but does not require the operator to complete the paired comparisons stage, which can often be a lengthy process, and difficult carry out inside a vehicle. Fairclough (1991) adapted the TLX to measure driver mental workload and reported that the RTLX is just as, if not more sensitive, than the TLX, yet is easier and quicker to administer. See Appendix B for a copy of the questionnaire used.
2. METHOD
2.1 Subjects -
The subjects who participated in the experiment were all members of an existing subject panel.
All
the subjects had driven the simulator at least twice in previous other research projects and were thus considered to be competent in its handling. In addition to reducing the amount of familiarisation and training needed, the use of experienced subjects considerably reduces drop-out rate due to simulatorsickness. (See Appendix C for drop-out rates).
30 subjects participated in the experiment. There were 15 males between the ages of 23 and 54 (mean 37 years) with a reported annual mileage of between 7000 and 40000 miles (mean 17600 miles); and 15 females between the ages of 24 and 49 (mean 37 years) with
a
reported annual mileage of between 6000 and 25000 miles (mean 15200 miles). Approximately half the males were under 35 and half were over 35 andthat
females were similarly distributed. Appendix D contains the cross-tabulations of sex by age group and annual mileage.The four experimental conditions were randomly ordered and subjects were assigned at their convenience. The total
time
for the experiment to take place was approximately 75 minutes for each subject including briefing, short breaks between experimental trials, debriefing and payment.2.2
Experimental DesignThe study allowed the investigation of two types of system implementation (general and secondary)
and
three
levels of system penetration (no vehicles equipped, 50% of vehicles equipped and allvehicles equipped). However, the combination of all these factors, including a control scenario, would result in 7 experimental conditions. To test the complete set of permutations using a within subjects design would require subjects to drive for approximately 2 hours on the simulator, and would likely result in a high incidence simulator sickness in the form of fatigue, discomfort and disorientation, (Kennedy and Frank 1986). Conversely, to conduct a between-subjects design also seemed inappropriate. Firstly, by asking subjects to return on a second occasion a higher drop-out rate is likely to be encountered. Secondly, according to the risk compensation literature (e.g. Streff
& Geller 1988), adjustments in risky behaviour are only observed in within subjects design, probably due to the fact
that the
occurrence of risk compensation is dependant on individuals beingThe high number of treatment conditions was reduced by selecting those which would be logically encountered in real world implementation. Subjects encountered the following four conditions. For ease the following condition names will now be referred to in this document. Each of the condition names appears in the format:
"X/r'
where the first half of the name (hereX)
refers to the speed limiter implementation in the subject's car (the simulator); the second half (here Y) refers to the speed limiter implementation in the other vehicles on the road. The four conditions were randomised to reduce practise effects.2.3 Apparatus and materials NSL/NSL
NSLISOSL
SLISL
SL+/SL+
2.3.1 The University of Leeds Driving Simulator
This is the control condition. Neither the simulator nor any of the other cars on the road are fitted with a speed limiter.
This condition represents the 'mixed-fleet' scenario. The simulator is not fitted with a speed limiter but approximately 50% of the other cars cz the road are.
Here the
full
implementation stage has been reached. Both the simulator and all the other cars on the road have been fitted with a speed limiter. Both the simulator and all the other cars on the road have been fitted with a speed limiter. The secondary speed limiter is also present in all cars.The experimental
trials
were conducted on the University of Leeds Advanced Driving Simulator. This facility is a sophisticated, static-base simulator built around a Silicon Graphics Reality Engine workstation. The "driver" sits in a complete car, with all the basic controls and dashboard indicators fully operational. The car is situated directly in front of a projection screen with the driver's seat aligned with a video projector. The workstation continuously receives information on driver activation of the vehicle controls and re-calculates the vehicle position using a complex vehicle handling model. The current position is continuously passed to the visualisation software, which calculates the resulting driver view and projects it onto the screen in front of the car. All this takes place in real time to provide smoothly flowing images. Shortly before the project began, there was a signiiicant upgrade in the main graphics workstation to provide fully textured images for increased realism and enhanced graphics performance. A detailed description can be found in Carsten and Gallimore (1993). The scenarios under investigation were incorporated into a continuous road network, allowing natural movement from one scenario to the next. Afull
description of the road network is contained in Appendix E.
2.3.2 NASA-RTLX
2.4 Independent Variables
The independent variables were the presence and type of speed limiter fitted on the simulator and other cars on the road. Between subjects factors of age (under 35 and over 35 years of age) and sex were also incorporated into the design.
2.5 Dependent Variables
The same road network was used for all the experimental conditions to produce exactly the same traffic scenarios in terms of the nature and order of junction types and the environment to reduce the effect of extraneous confounding variables. The following data was collected :
More details of data measurement and collection are contained in Appendix P.
2.6 Procedure
LejZ turns approach speed braking point turn speed
2.6.1 Subject briefing Rigkt tunas gap accepted
Subjects were told
that
they would first be allowed to drive the practise route, after which they would take part in four experimentaltrials.
Subjects were toldthat
in some of thetrials
they would be automatically speed limited and that before eachtrial
began they would be told whether they were limited in that particular condition. In addition they were remindedthat
some people experience simulator sickness and were advised of the symptoms. They were told that if they experienced any discomfort, however slight, they should immediately stop driving. They were asked to complete a form detailing their driving history and signthe
consent form agreeing to take part in the experiment. A complete set of subject instructions is provided in Appendix G.T r a m
lights violations Curvesspeed
speed variation
2.6.2 Practise session
Car following time headway
Subjects were informed that they would be given a 5-10 minute practise road in order to familiarise themselves with the controls of
the
car and to practise all the scenarios which were to follow in the experimental trials. When they had completed the practise session they were asked if they wanted to continue, and if they did the experimentaltrials
began.2.6.3 Experimental trials
The subjects were then read the instructions referring to the particular
trial
they were about to undertake. Subjects were then given the chance to ask questionsand
were toldthat
if they wanted to stop at any pointand
for any reason, they should do so immediately. The simulation was started and subjects were instructed to start driving when they were ready. At the end of each ofthe
3.
RESULTSAnalyses were carried out to establish differences between the four experimental conditions for all
the dependent variables. It was apparent that the 'mixed-fleet' scenario was not perceived by the subjects as different fromthe control condition, and that any additional effect of the secondary speed limiter would only be observed in areas around the junctions.
3.1 Approach to junctions
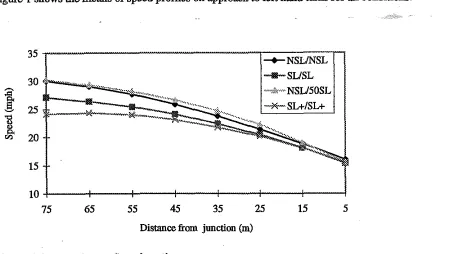
From the data that was collected, a mean value was obtained for each 10 metre section on approach. Figure 1 shows the means of speed profiles on approach to left hand turns for all conditions.
10
75 65 55 45 35 25 15 5
[image:14.602.79.542.218.472.2]Distance from junction (m)
Figure 1 Approach speeds to junctions
The data were analysed with multi-factorial analysis of variance to determine
the
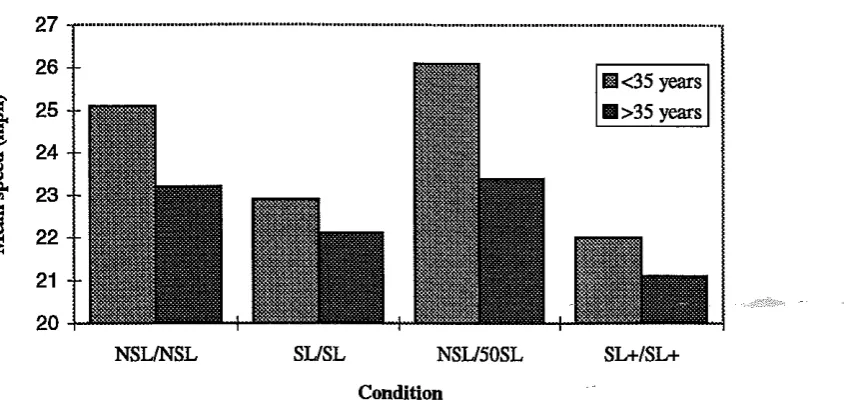
effect of two between subjects factors (Sex and Age) and two within subjects factors (Condition and Approach) on speed. There was a main effect of condition (F(3,87)=50. 87; p<.
001 indicating that both the speed limiter conditions produced lower average approach speeds than both the non-speed limited conditions. A sigdicant interaction between Condition and Approach, F(21,609)=2. 83; p<.
001 suggests that the effect of Condition type is not stable across the different approach distances. Post- hoc analyses subsequently revealed that the reduction in speed is statistically reliable in the approach sections between 80-31 metres only. As drivers neared the left handturn,
the difference in speed was no longer significant. So although speeds were lower on approach when drivers were speed limited, they were very similar for the main deceleration profile on the M a t e approach to the junction. No additional effects of the secondary speed limiter were observed.NSUNSL SUSL NSUSOSL SZAISZA
[image:15.595.85.510.82.286.2]Condition
Figure 2 Mean approach speeds by age
The point at which the subjects first began to brake was recorded (within 80 metres of
the
junction). The mean values are shown in Table 1.Table 1 Mean braking point in each condition
Condifion
I
NSUNSL1
S U LI
NSUSOSLI
SL+/SL+ Braking point (m)1
45.191
38.511
43.641
23.22An average braking point for all left tums was calculated for each subject. The data were analysed using analysis of variance. There was a significant main effect of Condition on braking point, P(3,29)=9. 892; p
<.
001. From Table 1 it can be seen that when the subjects were speed limited they tended to brake later.3.2 Traffic light violations
The number of red light violations that subjects committed in each condition was calculated and the numbers of violations in each condition are shown in Table 2.
Table 2 Red light violations
Condition
1
NSLJNSL1
SUSLI
NSUSOSLI
SL+/SL+ No. of violations1
7 1 2 19 1 5 [image:15.595.71.418.621.657.2]3.3 Following behaviour
Headway was recorded at 2 metre
intervals
along a 600 metre stretch of straight road where subjects were required to follow a lead vehicle. The presence of traffic on the approaching carriageway made it dii%cult for the subjects to overtake, however whenthis
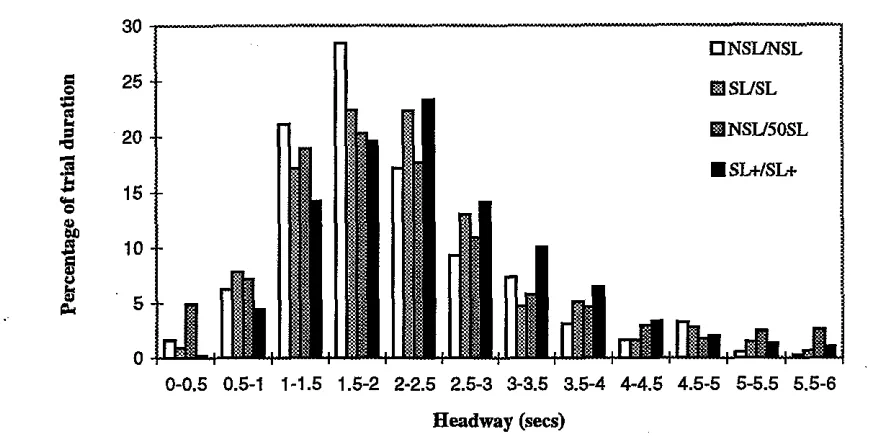
did occur, these instances were excluded from the analysis as the close approach to the lead vehicle during overtaking would skew the headway values. There were four occasions on which subjects were required to follow a lead vehicle; the following analyses refer only to one of those occasions. In this scenario, the lead car was travelling at a speed of 25 mph, and thus it was physically possible for subjects, even when speed limited, to adopt very short headways if they wished to.For each subject, the percentage of driving time occupied in each half second unit between 0-6 seconds was calculated. A mean percentage was then derived across subjects in each condition. The distribution of headways is shown in Figure 3.
0-0.5 0.5-1 1-1.5 1.5-2 2-2.5 2.5-3 3-3.5 3.5-4 4-4.5 4.5-5 5-5.5 5.5-6
[image:16.605.84.526.313.535.2]Headway (sees)
Figure 3 Mean headway exposure for each condition
The above distribution exhibits the following characteristics:
Table 3 Headway distribution characteristics
From the above it can be seen that as the speed limiter is gradually introduced there is a trend towards reduced positive skewness, i.e. following behaviour is becoming safer by there being less tendency to follow at short headways.
Condition Skew Kurtosis
NSWNSL 1.28 0. 68
SUSL 0.88 -0.81
NSWsOSL 0.92 -0.83
[image:16.605.73.506.624.673.2]3.4 Speed on curves
The data were analysed with multi-factorial analysis of variance to determine the effect of two between subjects factors (Sex and Age) and one within subjects factors (Condition) on speed. There were no effects of Condition on entry, apex or exit speeds on curves, however a main effect did exist for speed variance over the whole, F(3,87)=3. 29;p
<.
05, indicating that speed variance is lower when subjects are speed limited. The means are displayed below in Table 4.Table 4 Speed variance on curves
Condition S eed variance (m h) NSUNSL
NSWSOSL
SL+/SL+ 0.72
3.5 Gap acceptance
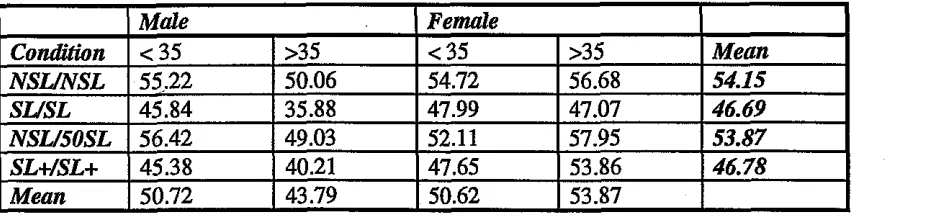
[image:17.602.74.541.415.524.2]A mean value was calculated for all right hand turns for each subject. The means are displayed in Table 5 and Figure 4 below.
Table 5 Mean gap accepted (metres)
The data were analysed with multi-factorial analysis of variance to determine the effect of two between subjects factors (Sex and Age) and one within subjects factor (Condition) on size of gap
accepted.
There was a main effect of Condition, F(3,87) = 6.23, p<O. 01. Post-hoc analyses revealed
that
subjects accepted smaller gaps when they were speed limited (both SUSL
and
SL+/SL+ conditions) than when they were not speed limited (both NSL/NSLand
NSUSOSL conditions). There were no differences in gap acceptance behaviour between the two speed limited conditions or between the two non-speed limited conditions. There was also a significant main effect of Sex on mean gap accepted, F(1,29) =6. 27, p<. 01. Males accepted smaller gapsthan
females andthat
there is a significant interaction between Age and Sex, F(1,29), p<
.
01, such that although there i s only a slight increase in the size of gap taken for older females compared to younger ones, it appears25
20
NSUNSL SUSL NSU5OSL SLclSLt
[image:18.595.89.513.89.288.2]Condition
Figure 4 Mean gap accepted
3.6 Mental workload
There were main effects of Condition on the following factors on the NASA-RTLX, the means are shownbelow in Table 6.
Table 6 Mean mental workload scores
Compared to the control condition, subjects reported they experienced less physical demand, and that their driving performance improved when the car was fitted with a general speed limiter. The scores also indicate that subjects thought physical demand rose when the secondary speed limiter was introduced and
that
subsequently their performance deteriorated. In addition they reported that their frustration level rose from the control condition to the general speed limiter condition and that the level rose again when the secondary speed lhniter was introduced. Finally they reported an increase in time pressure when the secondary limiter was implemented.ConGition
Physical Demand Pe$ormance
Time Pressure Frustration Level
NSWNSL 32.93 46.8 27.6 30.43
SUSL 27.77 37.97 35.97 43.57
NSWSOSL 37.33 48.57 32.5 34.73
[image:18.595.71.511.463.540.2]4. Significance of results
The results in general indicate that driver behaviour does change when speed limiters are in use. However it was noted that these changes were bi-directional, i.e. both safer driving and riskier driving were observed and these will be discussed separately.
4. f Safety benefits
The
results suggest that driver's behaviour was sometimes more safe when speed limited. In car following scenarios there appears to be a shift towards safer behaviour whereby less time was spentat short headways. This can not be attributed to a system effect, as the lead car was only travelling at 25 mph, and therefore subjects were capable of adopting short headways if they wished (as they were limited to 30 mph). It is more likely that being speed limited prevented subjects from pulling up close to the car in front and then dropping back in an attempt to overtake. Summala (1980), in a study where overtaking was prohibited along a stretch of road, found that when drivers passed the prohibitory sign, if they were close following another car they increased their following distance. Where subjects were not speed limited they could not overtake, due to oncoming traffic, but in the process of attempting to, drew close to the car in front and thus increased the incidence of short headways. The results suggest
that
if drivers are waiting for an oppomuity to overtake, accident riskincreases by inducing shorter following distances.In addition, the frequency of traffic light violations decreased when drivers were speed limited. The frequency is attributable to a system effect, as being speed limited meant drivers were travelling slower and thus had more time to make the decision as to whether to run the red light or not. The slower the driver is going, the more time they have from the onset of the amber light to make the decision, the more time they have to make the decision the more likely they
are
to stop.Finally, it was observed that driver's who were speed limited tended to exhibit less variation in speed on curves. Total homogeneity i.e. a flow without speed variance, would theoretically eliminate many accidents (especially rear end collisions). Garber and Gadirajn (1988) found that accident rate did not necessarily rise with an increase in mean speed, but did rise with an increase in speed variance.
It is likely that the drivers in this experiment were aware that the speed limiter was encouraging them to drive more safely as in their subjective mental workload scores they reported their driving performance
had
improved.4.2 Safety costs
The
results
of the mental workload index indicate that feelings of frustration and time pressure increased when drivers were speed limited. This increase in time pressure is reflected in the riskier gap acceptance behavim that was observed in the speed limited conditions. Drivers who were speed limited could be reducing their waiting time at junctions in order to make up for time lost elsewhere. This finding has important implications for safety at junctions.seem to be causing drivers to lose control of the car around the junction, it is impossible to predict how this system reliance may change as drivers become more used to the system. As familiarity with the system increased, drivers may become more reliant on the system, vigilance may decrease and accident propensity may increase.
5. PRINCIPAL CONCLUSIONS
This study examined the impact of automatic speed limiters on driving style, using the University of Leeds Advanced Driving Simulator. An urban environment was simulated using appropriate traffic and road variables to allow driver behaviour to be monitored. Various levels of system penetration were implemented and two types of speed limiter were evaluated. Behaviour, ten& of safety measures such as headway, gap acceptance and traffic light violations were measured, and mental workload was assessed using the NASA RTLX. It was hypothesised that although system effects would be observed in the form of speed reduction, drivers may undertake compensatory behavionr in order to attempt to regain lost time. The results in general indicate
that
driver behaviour does change when speed limiters are in use. However it was noted that these changes were bi- directiod, i.e., both safer driving and riskier driving were observed. The benefits were observed on both links and at signals, and the reduction in speeds for younger drivers are particularly encouraging. On the other hand, the acceptance of smaller gaps at junctions is paaicularly worrying, since junctions account for 70 percent of accidents on urban roads.The implementation of such a speed control measure requires careful prior consideration of issues such as practicality, acceptability and reliability. With regards to practicality the speed limiter could be installed in the car, using a mechanism similar to that of cruise control, and be operated by the driver. Alternatively the limiter could be controlled at the roadside. The first option is relatively simple and may be more acceptable to the driver as they still have some sense of personal control; but a system like this would be open to abuse. The second however, is dependant on a reliable and complete network of roadside technology.
Issues of acceptability apply to both car manufacturers and end-users. Car manufacturers market their products using speed and acceleration figures and it is likely that resistance to the introduction of speed limiters would be strong. Public opinion would have to be sought and incorporated into design and implementation. Over the years, the value of time for leisure and works trips has increased; it is therefore necessary to evaluate thoroughly any measures that might lengthen travel time. Typical reactions from subjects in
this
investigation included reference to the fact that sometimes it is necessary to accelerate above the speed limit to avoid dangerous situations. On urban roads this is unlikely, as probably the natural reaction is to brake rather than accelerate, however in faster moving traffic where overtaking is more common, this may be an issue, especially ina
mixed fleet scenario where the trafficis
relatively unpredictable.these effects be monitored, e.g. the feasibility study in preparation in the Netherlands ( Diepens and Okkema) which aims to establish the benefits and costs of implementing intelligent speed limitation in a new neighbourhood in Tilburg. Issues to be tackled include hardware availability and applicability, town planning and design, co-operation of inhabitants, legal issues and financial consequences.
Incorporated into this research should be the ability to study behaviour in the mixed fleet situation. Although no effects were discovered in the present study it is likely due to the diEcnlty in simulating
this
type of interaction in the simulator, rather than the absence on effects per se. The unpredictability of traffic in a mixed fleet scenario may not only result in problems for other drivers, but also for other road users, in particular pedestrians. Another area which was outside the capability ofthis
investigation due to limitations in the field of view on the simul^+~r, was the consideration of how drivers of vehicles on a minor road may adapt their behaviour on approach to the junction with a major road. As in the example of vulnerable road users above, drivers may exhibit riskier merging behavionr due to their expectancy that cars will be travelling at or below the speed limit.In conclusion, the results from this study indicate that automatic speed limiters may be both beneficial and detrimental to road safety. It is apparent that there is a need for a total integrated assessment of the effects of a speed limiter on safety, costs, the environmental and acceptability issues.
ACKNOWLEDGEMENTS
REFERENCES
Almqvist, S.
,
Hydkn, C. and Risser, R (1991). Use of speed limiters in cars for increased safety and a better environment. Transportation Research Record 1318, pp34-39.Anderson, M. E. (1996). Development of a questionnaire on workload for response to automatic speed control m urban areas project. ITS Technical Note 398, Institute for Transport Studies, University of Leeds, Leeds.
Andersson, J. W. (1978). The effecfiveness of traffic safety materials in influencing the driving performance of the general driving population. Accident Analysis and prevention 10, pp81-94.
Becker, S. and Sonntag, J. (1993). Autonomous Intelligent Cruise Control. Pilot study conducted by the Daimler Benz and Ope1 demonstrators. TUV Rheinland. Institute of Traffic Safety.
Byers, J. C.
,
Bittner, A. C. and Hill, S. G. (1989). Traditional and raw task load index (TLX) correlations: Are paired comparisons necessary? In: Advances in Industrial Ergonomics and Safety I Mital, A.,
(ed) pp 481-485.Carsten, O.M.J., Tight, M.R., Pyne, H.C. and Dougherty, M.S. (1995). Speed on Rural Arterial Roads. EPSRC Final Report GRlJ48870.
Casey, S. M, and Lund, A.
K
(1993). The effects of mobile roadside speedometers on traffic speeds. Accident Analysis and Prevention 25(5), pp 627-634.Department of Transport (1995). Vehicle speeds in Britain, 1994. Department of Transport Statistics Bulletin (95) 32.
Diepens and Okkema (study to commence in 1998). A feasibility study of Intelligent Speed Limitation On behalf of Ministry of Traffic, the Netherlands.
Downing, C. S and Spendlove, J. (1981). Effectiveness of a campaign to reduce accidents involving children crossing roads near parked cars. TRL Laboratory Report 986. Transport and Road Research Laboratory, Crowthome.
Elliot, B. (1993). A meta-analysis of road safety mass media campaigns, unpublished report.
Evans,
L.
and Wasielewski, P.,
(1983). Risky driving related to driver and vehicle characteristics. Accident Analysis and Prevention 15, pp121-136.Fildes, B. N. and Lee, S. J. The speed review: road environment, behaviour, speed limits, enforcement and crashes. Report CR 127, Monash University, Accident Research Unit. Prepared for Federal Office of Road Safety.
Fildes, B. N.
,
Rumbold, G. and Leening, A C. (1991). Speed behaviour and drivers' attitude to speeding. Report 16, Monash University, Accident Research Centre, Prepared forVIC
ROADS, Hawthorn, Victoria.Finch, D. J.
,
Kompfner, P.,
Lockwood, C. R.,
and Maycock, G. (1994). Speed, speed limits and accidents. TRL Project Report 58, Transport and Road Research Laboratory, Crowthome, UK.Fishbein, M and Ajzen, I. (1975). Belief, attitude, intention and behaviour: an introduction to theory and research. Addison-Wesley. Reading, MA.
Galizio, M.
,
Jackson, L. A,
and Steele, F. 0 (1979). Enforcement symbols and driving speed: the overreaction effect. Journal of Applied Psychology 64(3) pp311-315.Garber, N.J. and Gadiraju, R. (1988). Speed variance and its influence on accidents. AAA Foundation for Traffic Safety. 1988107 pp 63. Report No. HS-040559.
Garber, J. P. and Gadiraju, R. (1989). Factors affecting speed variance and its influence on accidents. Transportation Research Record, 1213, pp64-71.
Glad,
A
(1986). Aksjonen "Bedre bilist-85", Resultater av en evduering av aksjonen. Transportokonomisk institutt. Oslo.Hauer, E.
,
Ahlin, F.J. and Bowser, J.S. (1982). Speed enforcement and speed choice. Accident Analysis and Prevention. 14 (4)267-278.Hogema, J. H.
,
van de Horst, A R.A,
and Janssen, W. H (1994). A simulator evaluation of different forms of Intelligent Cruise Control. TNO Human Factors Research Institute. Report NO. TNO-TN 1994 C-30.Janssen, W. and Nilsson, L, (1993). Behaviourd effects of driver support. In: Parkes,
A
M. and Franzen, S. (Eds) Driving Future Vehicles, London : Taylor and Francis.Kennedy, R. S. and Frank, L. H. (19860. Review of motion sickness with special reference to simulator sickness. Transportation Research Record 1059, pp75-80.
Kimber, R. M. (1990). The relationship between speed, accidents and injury: Appropriate speeds for different roads and conditions. Proceedings of the PACTS conference on Speed, Accidents and Injury: Reducing the Risks pp17-28.
Mackie,
A.
M, Hodge, A. R. and Webster, D. C. (1993). Traffic Calming- design and effectiveness of 20mph zones. In Traffic Management and Road Safety, PTRC 21st Summer Annual Meting. Proceedings of Seminar C. London:PTRC.McDowell, M. R. C.
,
Darzentas, J. and Wenne11, J. (1981). Driver gap acceptance as a measure of accident risk. In: Road Safety: Research and Practice. Foot, H. C. , Chapman, A. J. and Wade, F. M. (eds). Praeger, UK.Munden, J. W. (1967). The relation between a driver's speed and his accident rate. TRL
Laboratory Report 88, Transport and Road Research Laboratory
,
Crowthorne,
UK.O'Neill, B. (1990). The relationship between speed, accidents and injury: Experience with speed limits in the USA Proceedings of the PACTS conference on Speed, Accidents and Injury: Reducing the Risks ppll-18.
Philips,
G.
E. and Maisey, N. G. (1989). The effects of posted feedback on speeding behaviour. Western Australia Police Department Research and Statistics Section, Perth.Plowden, S. and Hillman, M. (1996). Speed Control and Transport Policy. Policy Studies Institute, London.
Ragnarsson, R. S. and Bjorgvinsson, T (1991). Effects of public posting on driving speed in Icelandic traffic. Journal Applied Behaviour Analysis 24 pp 53-58.
Road Accidents Great Britain 1994. The Casualty Report. Department of Transport. London :HMSO.
Roqu6,G. M, and Roberts, M. C. (1989). A replication of the use of public posting in traffic speed control. Journal Applied Behaviour Analysis 22 pp 325-330.
Russam, K. (1979). Improving user behaviour by changing the road environment. The
Highway Engineer, AugustISeptember 1979,18-24.
Sabey and Taylor (1980). The known
risks
we run: the highway. TRRL Supplementary Report567. Transport and Roads Research Laboratory, Crowthorne.
Silcock, D. T. and Walker,
R
T. (1982). The evaluation of accident countermeasures for application in residential streets. Research Report No.44, Transport Operations Group, University of Newcastle upon Tyne, UK.Solomon, D. (1964). Accidents on main rural highways related to speed, driver and vehicle, US Department of Commerce, Bureau of Public roads, Washington, DC.
Summala, H. (1980). How does it change safety margins if overtaking is prohibited: a pilot study. AccidentAnalysis and Prevention 12(1) pp95-103.
Teed, Lund and Knoblaunch (1993). Reductions in speed attributable to radar detectors. Accident Analysis and Prevention 25(2) pp131-137.
Van Houten, R
and
Nau, P.A
(1981) A comparison of the effects of posted feedback and increased police surveillance on highway speeding. Journal Applied Behaviour Analysis 14 pp 261-271.Van Houten, R. and Nau, P.
k
(1983) Feedback interventions and driving speed. : A parametric and comparative analysis. Journal Applied Behaviour Analysis 16 pp 23-281.Van Houten, R.
,
Rolider, A.,
Nau, P.A.
,
Friedman, R.,
Becker, M.,
Chalodovsky, I, and Scherer, M. (1985). Large-scale reductions in speeding and accidents m Canadaand
Israel: A behavioural ecological perspective. Journal Applied Behaviour Analysis 18 pp 87-93.Winnett, M. A (1994). A review of speed camera operations m the UK. PTRC summer annual meeting 1994.
Appendix A : The speed limiter
1. Technical details
Using the logical road network, each individual section of road can be given a speed limit which the drone cars will, if required, adhere to. If the speed of the drone exceeds the speed limit, it is
decelerated by the formula:
where U = drone's acceleration (W)
Vl = speed limit of a particular road section ( d s ) V = current speed of the drone ( d s )
T,
=time constant of this first order system (1.5s).2. Driver experience
(a) general speed limiter
If the subject is driving the simulator at 30 mph or less then the speed limiter is inactive.
If the subject attempts to accelerate to above 30 mph the vehicle dynamics model automatically prevents any further increase in speed by closing the throttle and applying a small brake pressure to the hydraulic system of 10 bar.
Thus
even if the driver depresses the accelerator to itsfull
extent there results in no increase in speed.
(b)
secondary speed limiterIf the subject is driving the simulator when it also has the secondary speed limiter fitted, in addition to being limited to 30 mph, they are additionally speed limited around junctions. A junction is
defined as an area of road where a minor road ioins the maior road on which the subiect is "
..
.,travelling.
As
subjects approach the junction the secondary speed limiter comes into operation. At a distance of 50 metres before the junction the simulator is automatically slowed down to 25 moh (if the subject is currently exceeding that speed). They can only accelerateto 30 mph once they have.passed the junction.
When the dtiver enters the junction zone (i.e. 50 metres before the junction) :
If the subject is driving
the
simulator at 25 mph or less then the speed limiter is inactive.If the subject attempts to accelerate to above 25 mph the speed limiter automatically prevents any further increase in speed as before. It is referred to as a secondary device as it is only conceivable as a second stage implementation,see diagram below.
When the driver enters the junction zone (i.e. 50 metres before the junction) :
If the subject is driving the simulator at 25 mph or less then the speed limiter is inactive.
If the subject is travelling at more than 25 mph then the speed limiter is employed as described earlier by the vehicle dynamics model until the vehicle's speed has been reduced to 25mph.
Appendix B : NASA RTLX
The following questionnaire was administered after each condition; subjects were permitted to consult the definitions of the factors given below.
Please place a line through each scale that represents the magnitude of each factor on the task you just performed. The factors are explained in more detail on the following page.
Mental Demand LOW I I HIGH
1
Physical Demand LOW I
"""
I
Time Pressure LOW I
'"I
Performance POOR1
'
"""1
Effort LOW I
Frustration Level LOW I HIGH
DEFINITION OF 6 FACTORS WHICH DESCRIBE THE LOADS PLACED ON AN INDIVIDUAL DURING THE DRIVING TASK
I
MENTAL DEMAND1
This refers to the 'thinking' component of the driving task. For example, consciously making
decisions about the traffic environment or deciding how to respond to the scenarios. How much of
I
this type of thinking, deciding, calculating, remembering, looking, searching, etc. did you need todo? Was the task easy or demanding, simple or complex in this respect? PHYSICAL DEMAND
How much physical activity was required (e.g. operating brake, clutch and accelerator, steering the vehicle, using the indicator, etc.)? Was the task easy or demanding, slow or brisk, slack or
strenuous in this respect? TIME PRESSURE
Did you feel you had enough time to adequately perform the experimental task? PERFORMANCE
How satisfied were you
with
your performance in achieving the goals of the task i.e. safe driving? EFFORTHow hard did you have to work (mentally and physically) to achieve your level of performance? Did you feel stretched or comfortable during the task?
FRUSTRATION LEVEL
APPENDIX C : Drop-out rate due to simulator sickness by sex and age
I
Males d 5I
Males >351
Females d 51
Females >35Frequency
(
0 111 0
11Symptoms and onset
Male >35: ARer approximately 5 minutes of driving the simulator, subject was physically sick. Described as a very sudden reaction to possibly driving round a left hand bend. Recovery was
quick and the subject felt able to drive home after about an hour.
Female >35 : After approximately 30mins of driving the subject complained of feeling slightly
APPENDIX E : The road network
The road network consisted of T-junctions and cross-roads, both approached from the major road only, due to the limitations of the field of view on the simulator, i.e. it is not possible for
the
driver to emerge from a minor road. The junctions were either signalised or unsignalised.All
the junctions were at right angles and were separated by straight and curved lengths of road. In each experimental road subjects were required to manoeuvre round four right turns and six left turns. In addition they had to negotiate 4 circular c w e s and five sets of traffic lights. Speed limit signs were posted at the beginning of each network. Subjects found their way through the network by following signposts which directed them to Otley. Road markings and signs were as descn%ed in the Traffic Signs Manual (Department of Transport, 1985).The
road environment varied from being relatively built up with terraced houses, shops, fences, trees, pavements with keALa, and street lights, to a more open environment with detached houses and fields.The other traffic on the road served two purposes. First, although they may not be crucial to the data collection, they add a sense of realism to the simulator. Second, they create scenarios which allow the investigation of certain driver behaviour, such as gap acceptance and headway distance. The other cars engaged in pre-programmed rulebased behaviour allowing the repetition of certain scenarios. This allows replication of traffic scenarios within experimental
trials
(allowing more data to be collected), between experimentaltrials
(allowing manipulation of only one independent variable at a t h e ) and between subjects (reducing the amount of between subject variability).The following scenarios were simulated.
Left turn
manoeuvres
Data was collected at four left turns in each experimental condition. Where the driver had to make a left turn manoeuvre all the junctions were identical in layout. The junctions were unsignalised and did not require the driver to give way to any other traffic. Each leftturn
required the subject to turn 90 degrees from the major road to minor road on the left. The junctions were designed so that drivers had at least 300 metres of straight, unobstructed road before they had
to turn. Two directional sign-posts were displayed at the roadside, the first approximately 150
metres before the left hand turn, and another at 50 metres before the junction.
Right turn manoeuvres
Subjects were required to make a right hand crossing manoeuvre at four unsignalised T-junctions. Two directional sign-posts were displayed at the roadside, the first approximately 150 metres before the left hand turn, and another at 50 metres before the junction. On approach to these junctions it was clearly visible to subjects that there was oncoming traffic and that they would be required to undertake gsrp acceptance behaviour. There were 11 oncoming carsat each junction. These cars were programmed to maintain a constant speed and headway to the car in front, however the gaps between the cars varied. The oncoming traffic was deliberately designed to force the subject to come to a halt at the junction. This was achieved by the presence of four cars having gaps of three seconds between them. In a pilot study none of the subjects attempted to accept
a
gap of this size.This pattern was repeated for each right turn, the speed of the oncoming cars was 30 mph except in the condition where the secondary speed limiter was fitted (because the cars are within 50 metres of the junction and are
thus
slowed down to 25mph).Image 1 Driver waiting to turn right across oncoming traffic
Curve
negotiation In each condition subjects were required to negotiate four bends. The geometric design of the curves wereas
follows :Radius m
Len h(mBend 3
Bend4 300 200
Image 2 Approach to sharp bend
Car FoZbwing The network
was
designed to allow the subject to engage in car following behaviour four times in each experimentaltrial.
Each of these stretches of road were 700 metres in length, with a preceding section of 100 metres to allow the subject to alter their headway accordingly. In the Eust two situations there appears a curve in front of the subject and the car which they are required to follow is concealed round this bend. The cars movement is triggered by the subject's approach. Inthe
third situation, subjects are required to stop at a set of traffic lights. A car pulls out froma
side road and it is this car that the subject follows.Finally,
in the fourth situation, the subject manoeuvres round right comer and triggers a car waiting there, which they then proceed to follow.A When the subject first see the lights they are green As they approach the lights they are green
They remain green.
B When the subject first see the lights they are green As they approach the lights they are green
They change to red when the subject is approximately 30
metres
fromthe lights. C When the subject first see the lights they are redAs they approach the lights they are red They remain red. Subject is required to stop. D When the subject first see the lights they are red
They change to green when the subject is approximately 50 metres from the lights.
APPENDIX
F
: Data collectionLeft turn manoeuvres
The data collected in a pilot study indicated that on the whole subjects were beginning to brake within a 80 metre distance before the turn. It was therefore decided to record the following data on the 80 metre approach to the junction.
(i) Braking point (metres). The distance from the junction at which the driver first star&ed braking. (ii)Braking profile (bars). Once an initial braking point had been recorded, the subsequent braking
profile was measured.
(iii)Speed (metredsec). Recorded for 80 metres before the junction.
(iv)Longitudinal acceleration/decelerathn (metres/secZ). Recorded for 80 meues before the junction.
(v)Turn speed (metredsecond). An average value was obtained to indicate mean speed at the actual turning manoeuvre.
(vi)In addition the following data were collected over a distance of 30 metres after the junction. (vii)Speed (metredsecond).
(viii)Longitudinal acceleratioddeceleration (metreshec ').
The data was collected every metre.
As junction layout was identical in nature it was considered appropriate to cany out analyses on the
average measurements at the four junctions.
Right turn manoeuvres
At each right turn, the size of the gap that subjects accepted was recorded. This was calculated by measuring (in meues) the distance between the centre of gravity of the subject's
car
and the centre of gravity of the oncoming car as the subject manoeuvred the right hand comer.Curve negotiation
The following measurements were taken :
(i) Speed (mph) at entry, apex and exit to the curve (ii)Speed through the whole curve
(iii)Lateral position
Following behaviour
Once the subject had been following the lead car for 100 metres, the measurements taken were (i) speed (mph)
(ii)distance from front of subject's car to rear of lead car (metres)
(iii)fromthe above two a measure of time to collision was derived (speedlheadway)
Zkaffie lights
APPENDIX G : Instructions to subjects
B r i s ~ n g
Thank you for volunteering to take part in this study. The purpose of the experiment is to discover how you drive if a speed limiter is fixed to the simulator. The speed limiter works in a similar way to those which are fitted to some HGVs and coaches. It restricts the driver to a certain maximum speed. First of all today I will be asking you to refamiliarise yomelf with the controls of the simulator and get used to interacting with the types of traffic you are going to meet. This will take about 5-10 minutes. Once you feel comfortable with driving the simulator the experimental
trials
will begin. There will be four trials; sometimes you will be seed limited and sometimes you won't. Likewise sometimes the other cars on the road will be speed limited and sometimes they won't. I will tell you more details at the beginning of each trial. At the end of each trial you will have the opportunity to stretch your legs and have a drink of water if you wish to. Each
aial
lasts approximately 10 minutes, so we should be finished in just over an hour.As I have explained on your previous visits to the simulator, some people have the tendency to suffer from 'simulator sickness'. Some of the symptoms include feeling
warm,
sweating, headaches and nausea. If you experience any of these symptoms or indeed feel any other discomfort, please stop driving straight away. We prefer for you to tell as soon as possible as usually the symptoms do not go away if you continue driving. The only cure is to stop driving.If you still wish to proceed with the experiment please sigh the consent form and make yourself comfortable in the driver's seat.
Practise session
The purpose of this part of the experiment is to allow you to refanibrise yourself
with
the simulator. I am going to ask you to drive along the practise road, it is about 7 minutes long. If after you have come to the end you do not feel completely comfortable you may ask to drive the practise road again. The road is a 30 mph zone and you are not speed limited, i.e. you can exceed the speed limit if you wish to. We want you to drive as naturally as possible and interact with the other traffic on the road as you would in real life.I would like you to follow the signs to Otley. There are no other signs to wony about. By following the signs you will be taking left and right hand