analysis of the dynamics of drop formation
.
White Rose Research Online URL for this paper:
http://eprints.whiterose.ac.uk/1782/
Article:
Fawehinmi, O., Gaskell, P., Jimack, P.K. et al. (2 more authors) (2005) A combined
experimental and computational fluid dynamics analysis of the dynamics of drop formation.
Proceedings of the Institution of Mechanical Engineers. Part C, Journal of Mechanical
Engineering Science, 219 (9). 933-947(15). ISSN 0954-4062
https://doi.org/10.1243/095440605X31788
[email protected] https://eprints.whiterose.ac.uk/ Reuse
See Attached
Takedown
If you consider content in White Rose Research Online to be in breach of UK law, please notify us by
White Rose Consortium ePrints Repository
http://eprints.whiterose.ac.uk/
This is an author produced version of a paper published in Proceedings of the
Institution of Mechanical Engineers. Part C: Journal of Mechanical
Engineering Science.
White Rose Repository URL for this paper:
http://eprints.whiterose.ac.uk/1782/
Published paper
Fawehinmi, O., Gaskell, P., Jimack, P., Kapur, N. and Thompson, H. (2005) A
combined experimental and computational fluid dynamics analysis of the
dynamics of drop formation. Proceedings of the Institution of Mechanical
Engineers. Part C: Journal of Mechanical Engineering Science, 219 (9).
933-947(15).
A combined experimental and computational fluid
dynamics analysis of the dynamics of drop formation
O B Fawehinmi1, P H Gaskell1, P K Jimack2, N Kapur1,andH M Thompson11School of Mechanical Engineering, The University of Leeds, Leeds, UK 2
School of Computing, The University of Leeds, Leeds, UK
The manuscript was received on 12 August 2004 and was accepted after revision for publication on 31 May 2005.
DOI: 10.1243/095440605X31788
Abstract: This article presents a complementary experimental and computational investigation of the effect of viscosity and flowrate on the dynamics of drop formation in the dripping mode. In contrast to previous studies, numerical simulations are performed with two popular commer-cial computational fluid dynamics (CFD) packages, CFX and FLOW-3D, both of which employ the volume of fluid (VOF) method. Comparison with previously published experimental and computational data and new experimental results reported here highlight the capabilities and limitations of the aforementioned packages.
Results at high flowrates and higher viscosity show that the singlephase simulation technique (FLOW-3D) offers significant efficiency gains when compared with a multi-phase approach (CFX). Furthermore, comparison with experimental results reveals that for the same grid resol-ution, the single and multiphase solvers offer similar accuracy of prediction and both are able to capture the features of greatest practical engineering interest, such as primary drop volume as a function of flowrate. For low flowrates and viscosity, for example, which exhibit fine interfacial features such as thin liquid threads and the existence of satellite drops, the CFD predictions are found, in general, to be poorer with the issue of free surface smearing introduced by the VOF method and surface tension becoming dominant. In such cases, neither of the commercial packages is found to offer wholly reliable engineering design data.
Keywords: drop formation, experiments, computational fluid dynamics, VOF
1 INTRODUCTION
The dynamics of drop formation has long been a research topic of interest; see, for example, Basaran [1] and papers cited therein. This is not only due to its occurrence in everyday life but also, more recently, as an important component of diverse technological applications ranging from separation and extraction processes [2] to spraying and digital-jet printing tech-nologies [3,4]. A wide range of experimental, theor-etical, and computational studies have shown that drop formation from capillary tubes occurs in two different modes depending on the liquid flowrate [5]: dripping (at very slow efflux velocities) in which the liquid leaves the tube as a series of discrete peri-odic drops and jetting (at a high efflux velocity) in
which a coherent laminar jet emanates from the tube before breaking into a stream of discrete drops because of the Rayleigh instability [6]. During drip-ping, drop formation can be considered to occur in two stages. The first corresponds to the quasi-static growth of the drop which ends when surface tension is unable to counter the weight of the drop [7] and the second to necking (Fig. 1) and the eventual break-up of the drop. The necking stage is caused by the desta-bilizing effect of surface tension [8] and leads the drop to develop into a conical upper portion and an almost spherical lower portion. The liquid thread connecting these two portions simultaneously increases in length and decreases in diameter to a critical break-ing point at which the spherical portion is released to form the primary drop. The remaining liquid column recoils rapidly due to surface tension and may then break again at the top, leading to the for-mation of a satellite drop [9].
Corresponding author: School of Mechanical Engineering, The
Many experimental studies have visualized the drop formation process before, during, and after break-up; see, for example, the early studies of Hauser et al. [10] and Stone et al. [11]. However, it was the qualitative yet insightful study of Peregrine et al. [12] which identified the sequence of events that occur during break-up in terms of the four stages of necking, bifurcation, recoil, and secondary break-up, which has acted as a catalyst for much of the recent research into the dynamics of drop for-mation. Shi et al. [13], for example, demonstrated that increasing drop viscosity leads to the formation of long thin liquid threads, showing that a micro-thread or even a series of smaller necks can be spawned near break-up for concentrated solutions of glycerine in water; thread break-up was also con-sidered by Henderson et al. [14] and Brenneret al. [15], whereas Zhang and Stone [7] focussed on the formation of satellite drops. Although all these authors reported a range of interesting drop for-mation phenomena, it was the excellent experimen-tal study of Zhang and Basaran [9] which provided much-needed quantitative data of engineering significance on the effect of capillary radius and fluid properties on the formation of both primary and satellite drops for cases with and without surfactants. Their important study provides both a
detailed review of the drop formation literature up to that point as well as a wealth of information for the particular cases of the dripping of water and an 85 per cent glycerine solution in water at the low flowrate Q¼1 ml/min. Subsequent workers have often supplemented this with further experimental data to assess the accuracy of their computations. Wilkes et al. [16] and Zhang [5], for example, pro-vided specific experimental data to compare their computed drop shapes and times to break-up.
Drop formation presents a challenging free surface flow problem for which several theoretical models have been proposed. Early analytical models attempted to predict drop size as a function of fluid properties, nozzle geometry, and flowrate on the basis of simple macroscopic force balances where necking and break-up are preceded by pure static growth from the nozzle; however, such models were found to have unacceptable inaccuracies, typi-cally .20 per cent [5]. Building on the pioneering
work of Rayleigh [8], a more successful approach has been to analyse drop break-up via a range of one-dimensional axisymmetric models. For example, greater information on interface rupture during drop formation has been provided by solution of the rigorous equations for axial mass and momen-tum conservation, derived independently by Eggers and Dupont [17] and Papageorgiou [18]. These equations have been shown to predict accurately the time evolution of drop shape at low flowrates and were used to show how thin liquid threads above the primary drop can spawn a series of smaller necks with ever-thinner diameters prior to break-up [13]. Although the detailed comparison of one-dimensional and two-one-dimensional models for drop formation by Ambravaneswaran et al. [19] shows that the former can be useful for surface tension dominated flows, at the present time, no one-dimensional model is able to capture simultaneously both the macroscopic features of the flow, such as the primary drop volume and time to break-up, and the microscopic features of the thin liquid threads and satellite drops. The reader is referred to the comprehensive studies of Ambravaneswaran et al. [19] or Eggers [20] for a more detailed discus-sion of one-dimendiscus-sional models.
Fortunately, the advent of new numerical methods for free surface flows, allied to inexorable increases in computing power, has made the use of compu-tational fluid dynamics (CFD) a viable means of over-coming the inherent limitations of one-dimensional models. Schulkes [21] and Zhang and Stone [7], for example, have studied the formation of two-dimensional, axisymmetric droplets using the boundary element/boundary integral method in the limits of inviscid, irrotational, or Stokes flows, whereas Richards et al. [22] have studied liquid jet
[image:4.595.80.232.95.374.2]formation from a nozzle into a second liquid using a volume of fluid (VOF) approach. Wilkes et al. [16] were the first to solve the full, axisymmetric Navier – Stokes equations for the formation of a drop of Newtonian liquid at the finite Reynolds num-bers encountered in, for example, ink-jet printing. Although recognizing that VOF is a powerful tech-nique for simulating complex free surface flows with liquid break-up and coalescence, they preferred to use the finite element (FE) method because of its long and distinguished track record in simulating complex, steady free surface flows [23]. Their body-fitted FE mesh was designed specifically to account for the topology of forming drops, enabling the gross features of the flow, such as the drop volume, as well as the long, thin filaments just prior to break-up, to be simulated accurately. Using extre-mely fine FE meshes with up to 350 000 unknowns, an order of magnitude greater than that of Wilkes et al. [16], Chen et al. [24] were able to use this approach to predict accurately the extremely chal-lenging pinch-off of a low viscosity liquid where the surface overturns before pinch-off.
Although a range of different numerical methods are now being applied to the problem of drop for-mation (see, for example, Pan and Suga [25]), VOF is still perhaps the most commonly used method for simulating drop formation flows. It has been suc-cessfully used to capture fine flow detail such as sat-ellite drop formation [5,26]; Renardy and Renardy [27] have recently shown how numerical difficulties encountered at the free surface for surface tension-dominated flows may be avoided.
As practising engineers rarely have the time or expertise to develop their own numerical solvers for complex free surface flows, an important goal of the present study is to assess the capabilities and limitations of two popular CFD packages which use the VOF approach, CFX-4.4 and FLOW-3D (version 8.01), for drop formation flows in the dripping
mode. Their performance is assessed by comparison with previous experimental and computational studies and with a range of new drop formation experiments conducted with glycerine/water solutions. The experimental data and comparisons reported here fill the gaps in viscosity and flowrate not considered in previous studies [28]. Although the packages predict the dynamics of droplet for-mation reasonably well, provided the computational grid is sufficiently refined, the computations high-light important practical issues such as free surface resolution with VOF and the inevitable compromise between accuracy and CPU time.
2 EXPERIMENTAL METHOD
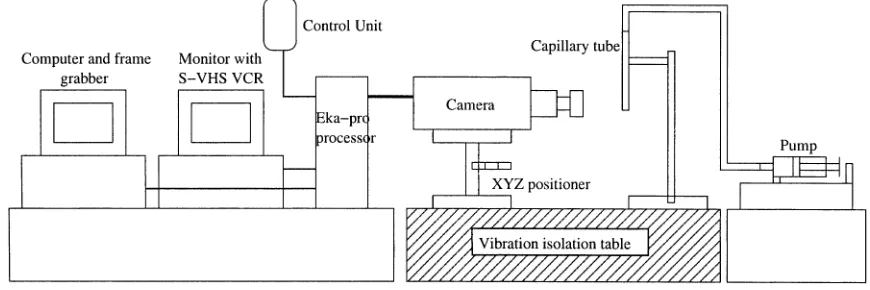
The experimental set-up is similar to that employed by Zhang and Basaran [9] and Wilkes et al. [16]. Drop formation is visualized using high-speed pho-tography with image analysis yielding quantitative information concerning the limiting length of the drop, the primary drop volume, and time to break-up.
2.1 Apparatus
Liquid is supplied at constant flowrate to a capillary tube using a syringe pump located on a vibration iso-lation table, see Fig. 2. The ambient temperature near the location of the forming drop is monitored using a thermometer. Three capillary tubes with external radii (Ro) 0.4, 0.8, and 1.375 mm and internal radii (Ri) 0.325, 0.525, and 1.225 mm, respectively, were used. The tubes are effectively of uniform cross-section (+0.025 mm) over their entire length and, at the drop forming end, thoroughly ground by lapping to ensure flatness and a square edge; this ensures that the liquid/gas/solid contact circle pins to the outer edge during experiments. For all the three capillaries, the ratio of their length to
[image:5.595.88.523.597.742.2]diameter is large (.10) to ensure a fully developed velocity profile inside the tubes prior to exit. Follow-ing reference [9], the ratios of the inner to outer radii are all substantially greater than 0.3, which guarantee that the effect of capillary wall thickness is negligible. The pump is capable of producing flowrates in the range of 0.01–25 ml/min for the capillaries employed. Images of the flow are obtained using an Eastman Kodak EktaPro High Speed Motion Analyser that can capture full frames (256 by 256 pixels) at speeds up to 4500 frames/s and partial frames (64 by 64) at up to 40 500 frames/s. The camera is used in conjunction with a Meijotech zoom lens with 0.7 – 4.5 magnifi-cation. The captured images are stored in digital form in a Kodak EktaPro Hi-Spec Processor with suf-ficient memory to store 81 920 full frames. Images of the forming drop are lit by a 250 W halogen light source reflected off white card to backlight the droplet. A video monitor is used for viewing images of the drops before, during, and after recording. Images can either be recorded onto S-VHS video cassettes using a video recorder at the desired rate or individual frames can be downloaded from the Ektapro processor onto a PC.
2.2 Materials and property measurements
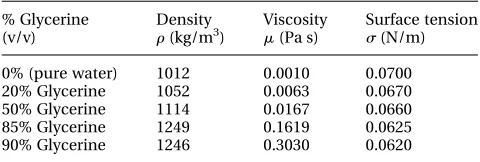
[image:6.595.36.276.688.769.2]Following previous experimental work, glycerine – water solutions are used to study the effects of vis-cosity on the drop-formation process. These are a popular choice for experiments in fluid mechanics because their viscosities increase by three orders of magnitude as glycerine concentration increases from 0 to 100 per cent, whereas their corresponding density and surface tension variations are only 20 and 10 per cent, respectively [16]. The glycerine was 99 per cent pure (Fisher Scientific Chemicals) and four concentrations were prepared by mixing the desired percentage by volume, v/v, in distilled water using a measuring cylinder at (nominally) 20, 50, 85, and 90 per cent glycerine. Their densities were measured using density bottles, viscosities using a rheometer (Bohlin CVO 120HR), and surface tensions using a DuNouy ring probe mounted on a torsion balance. Measured values are given in Table 1.
2.3 Procedure
In a typical experiment, the liquid lines are first cleared of any entrained air before a steady flowrate of between 1 and 20 ml/min is established. In this manner, a periodic flow condition is reached in which drops form, grow, and detach from the outlet of the capillary tube before visualizations are made. Successive experiments carried out under exactly the same conditions show that drop forma-tion at constant flowrates is extremely, repeatable – volumes of breakoff for the primary drops are uniform and agree to within 5 per cent. As droplet break-up typically evolves over a timescale of milli-seconds, the camera used a frame rate of 18 000, frames/s to facilitate detailed resolution of the flow dynamics. An image resolution of 256 by 64 pixels was found to produce clear images.
3 CFD ANALYSIS OF DROP FORMATION
3.1 Mathematical model and method of solution
The fluid is assumed to be incompressible and New-tonian with viscositymand densityrand the flow to be axisymmetric, for which a polar coordinate system (r, u, z) is chosen (Fig. 1), whose origin lies at the centre of the open end of the capillary tube while the zcoordinate increases in the direction of gravity. Scaling velocities byU;2Q/pRo2, the maxi-mum velocity for the fully developed flow in the tube, lengths by the outer radius Ro, stresses by mU/Ro, and the time byRo/U, enables the governing Navier – Stokes equations to be written in the follow-ing non-dimensional form Q1
Re @u
@t þu ru
¼ r tþStk (1)
r u¼0 (2)
whereu, t, and t¼ pIþ ½ruþ(ru)Tare the non-dimensional velocity vector, time, and Newtonian stress tensor, respectively, and k is the unit vector in the direction of gravity. Equation (1) shows that the flow is governed by the Reynolds number, Re;rUD/m, measuring the relative importance of inertia to viscous forces and the Stokes number, St¼rgRo2/mU, which measures the relative importance of gravitational and viscous forces. Sur-face tension is also important and is introduced via the free surface boundary condition (4) given subsequently.
The flow is solved subject to the following bound-ary conditions. Far upstream of the capillbound-ary tube’s exit, flow is assumed to be fully developed with
Table 1 Physical properties of liquids used in the exper-iments at 20.58C
% Glycerine (v/v)
Density
r(kg/m3) Viscositym(Pa s) Surface tensions(N/m)
a velocity profile [16]
~ Vz¼
2Q pR2
o
1 R~
Ro
!2 2
4
3
5, 0R~ Ro (3)
whereR˜andV˜zrepresent the radial coordinate and
fluid velocity, respectively, within the contact circle formed by the liquid pinning to the edge of the capil-lary tube exit. In the mathematical model, the inner and outer radii of the capillary tube coincide (i.e. Ri¼Ro). This is a valid simplification in terms of the fluid mechanics of the problem if Ri/Ro.0.3 [16] as is the case for all the experiments here. At the free surface formed between the droplet and the surrounding air, two boundary conditions apply
Q1
un¼0, tn¼n 1
Ca2H (4)
where the capillary number, Ca¼mU=s, measures the relative importance of viscous and surface tension stresses, andH is the curvature of the free surface. The first condition is, known as the kine-matic condition, that there should be no mass trans-fer across the free surface, whereas the second stipulates that viscous and surface tension stresses should be in balance.
In any numerical analysis of drop formation, it is the mathematical description of the free surface which presents the main challenge; this can be dealt with either from the Eulerian standpoint or from the Lagrangian standpoint. In the former, the mesh is fixed in space and the fluid moves through it, whereas in the latter, the mesh is convected with the flow. A major difficulty with the Lagrangian approach is dealing with the mesh distortion that arises in complex free surface flows [29]. Although Lagrangian FE meshes have been designed to cope with the distortion arising during drop formation and were able to predict the development of micro-threads and overturning [16,24], Lagrangian methods are as yet unable to predict drop dynamics past the point of necking and subsequent droplet pinch-off. Eulerian approaches on the other hand resolve such complex interface movements relatively easily. In the VOF method, for example, the interface is tracked using a fluid volume marker function con-vected by the flow [30] whose value is zero in the pure liquid and one in the gas. The crossover region with volume functions between zero and one repre-sents the free surface separating the liquid and gas phases. This technique enables complex free surface phenomena such as interfacial break-up or coales-cence to be simulated numerically, although at the expense of requiring a finer computational mesh
than would typically be the case with Lagrangian methods [16].
Here, the Navier – Stokes equations are solved sub-ject to the aforementioned boundary conditions using the popular commercial CFD packages, CFX-4.4 and FLOW-3D (version 8.0.1), both of which use the VOF method. The former enjoys widespread use in the chemical and process industries, whereas the latter has been developed by Flow Science Incor-porated,the originators of the VOF approach. In CFX Q2
4.4, a multiphase model is adopted in which the liquid and the air are considered to be a single fluid but with variable density, with the result that the flow equations have to be solved in both the liquid and gaseous regions. FLOW – 3D, however, treats the free surface as a discontinuity and imposes the necessary boundary conditions there whilst tracking its motion through the grid. This means that FLOW-3D, like Lagrangian methods, only needs to solve equations for the liquid phase, a feature that offers significant efficiency gains for large simulations.
4 RESULTS
The effect of flowrate and viscosity on the interface shape immediately prior to breakoff is illustrated by the experimental profiles presented in Fig. 3. The effect of flowrate for 85 per cent glycerine and water has been studied experimentally [19] and both experimentally and computationally by Bren-ner et al. and Wilkes et al. [15,16]; the agreement between the present experiments and previous results is excellent. The results for 20 and 50 per cent glycerine show that, in addition to the elongation of the liquid cone above the primary drop from increasing Q, viscous effects cause a sig-nificant lengthening of the liquid thread, or neck, between the liquid cone and primary drop at the higher flowrates when the glycerine concentration exceeds 50 per cent. This figure also highlights the rich dynamics of the process and the dramatic shape that the interface takes close to the point of break-up.
Fig. 4 The effect ofRoandQon the dripping process. Time to breakup,td, is plotted againstQon
a logarithmic scale forRo¼0:4, 0.8, and 1.375 mm and 1 ml/minQ18 ml/min for (a)
20 per cent and (b) 50 per cent glycerine solutions
[image:8.595.98.496.77.412.2] [image:8.595.125.457.480.732.2]the time between break-up, however, the time between break-up decays exponentially in all cases, except for the smallest tube diameter which approached the jetting mode at the higher flowrates. This data can also be replotted as droplet volume as a function of flowrate (Fig. 5). As the flowrate is increased, the droplet volume initially increases, before reaching a maximum droplet size, followed by a decrease in the volume of the droplet. This decrease is most apparent for the smallest tube dia-meter as the non-linear jetting region is approached. Figure 6 shows this vividly for the smallest tube with anRo¼0.8 mm. As the flow is increased, the inertia of the fluid results in more fluid being forced into the droplet before breakoff occurs. However, at larger flowrates, this inertia pushes the droplet further from the tube and ultimately a jet is formed. The dro-plet formation is now dominated by the Rayleigh instability occurring along a column of fluid [6] with a diameter similar to that of the (inner) tube diameter, as opposed to a diameter of the order of a pendant drop. Consequently, the resulting drop volume is much reduced.
Finally, the effect of reducing the tube diameter of the droplet volume for a constant flowrate can also be considered. Starting with the largest tube diam-eter (Ro¼1.375 mm) and reducing the diameter by 40 per cent gives a typical reduction of 50 per cent in drop size. A further reduction in tube size by 50 per cent only results in a reduction in the drop volume by 10 and 30 per cent for the 20 and 50
per cent glycerine solutions, respectively. Clearly, there is a diminishing return on the reduction of drop volume by reducing tube diameter. Other recent approaches that have been taken to decrease droplet radius are to carefully control the waveform used to drive a piezo element [31] or to use a non-circular cross-section of nozzle [32].
In VOF simulations, such as those reported here, a particularly important issue is the smearing of the free surface over a small number of cells at the
Fig. 5 The effect ofRoandQon the dripping process. Droplet volume,Vd, is plotted againstQon
a logarithmic scale forRo¼0:4, 0.8, and 1.375 mm and 1 ml/minQ18 ml/min for (a)
20 per cent and (b) 50 per cent glycerine solutions
Fig. 6 Effect of Q on interface shape at breakup for liquid flowing from a capillary tube withRo¼
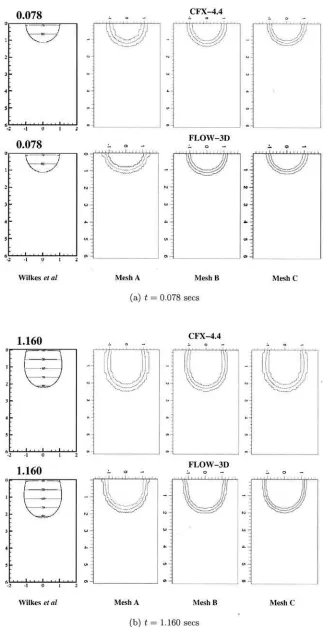
[image:9.595.321.558.539.678.2]interface of the liquid. Consequently, an appropriate value of the marker function needs to be chosen to represent the free surface. Free surface smearing is highlighted in Fig. 7, which compares predictions of CFX and FLOW-3D for the case ofQ¼1 ml/min, Ro¼1.6 mm for 85 per cent glycerine at the two time instantst ¼0.078 and 1.160 s from the previous droplet break-up. These conditions are chosen for comparison with Fig. 10 of reference [16]. Results are obtained on three successively finer meshes, A, B, and C, with 12020, 14424, and 19232 regular mesh volumes, respectively; contours of marker cell function levels of 0.01, 0.5, and 0.99 are shown, representing the inner, middle, and outer contours, respectively. Although the agreement with reference [16] is reasonably good at these particular instants, the free surfaces of the multi-phase solution method (CFX) are slightly more diffuse than those obtained with the singlephase FLOW-3D calculations. Note that using the 0.5 contours of marker cell function level to determine the interface, which is also the value recommended by the software vendors, gives the smoothest boundary in all cases. Unless stated otherwise, in all remaining results only those obtained on the finest grid, C, with the mid-level contour, 0.5, are plotted.
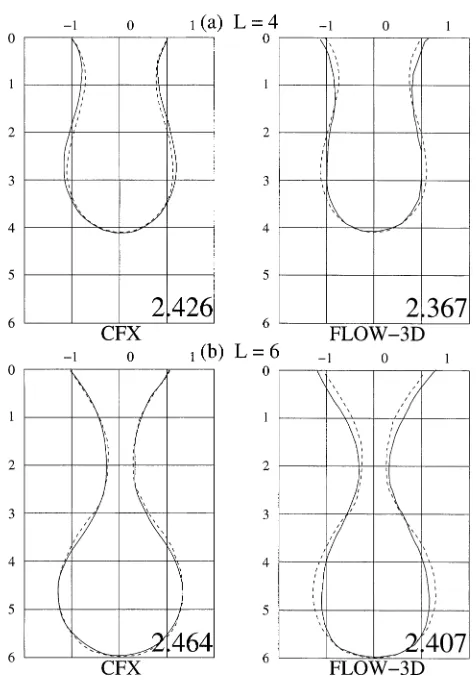
Figure 8 considers the later stages of drop for-mation when the dimensionless drop length, L, is equal to 4 and 6. The times from the previous droplet break-up taken for the simulations to reach these conditions for both CFX and FLOW-3D are shown above the corresponding figures. Although the agree-ment is reasonably good in all cases, with CFX show-ing the better qualitative agreement in terms of interface shape with reference [16], FLOW-3D shows slightly better quantitative agreement in the time taken to reach this point and is only 8 per cent greater than that of reference [16] compared with the 11 per cent overprediction by CFX. Also of interest, from the practical engineering viewpoint, is the computational resource needed to obtain the CFD results. Although there is little to choose between the predictions, the computational costs incurred in running simulations to droplet break-up are massively different: 2000 CPU seconds for FLOW-3D as opposed to 433 000 CPU seconds (over 5 days) for CFX on a R10 000, 195 MHz MIPS pro-cessor. Clearly for practical engineering compu-tations, where several simulations on fine meshes may be required, FLOW-3D is the more viable option. For this reason, the latter has been used to obtain all subsequent CFD results. A more detailed comparison between the capabilities of CFX and FLOW-3D is given by Fawehinmi [28].
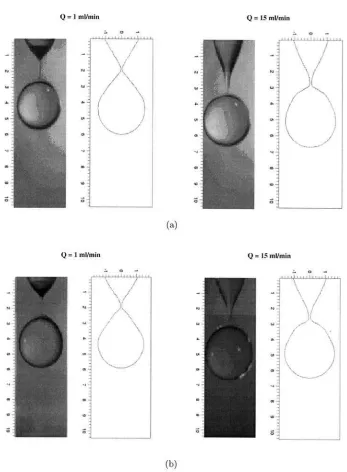
Figure 9 shows a comparison between experimen-tal visualizations and CFD predictions of interface
shape at later stages of drop formation with 20 per cent glycerine solutions for Q¼1 and 15 ml/min. The agreement between the experiments and CFD is reasonably good because the predicted times between subsequent droplet break-up (shown above the figures) are within 5 and 9 per cent of the experimental ones for Q¼1 and 15 ml/min, respectively. The predicted free surface shapes when L¼5 agree well with experiment, but it is clear that the agreement deteriorates as droplet breakoff approaches.
Figure 10 shows a comparison between flow visu-alizations and predicted free surface shapes at break-up for the 20 and 50 per cent glycerine solutions. The absence of a long liquid thread for the higher viscosity liquid at the higher flowrate enables FLOW-3D to resolve the free surface reasonably well. However, for the other cases, in which surface tension forces are dominant, FLOW-3D is unable
to resolve this feature. This failing may be due to the CSF algorithm [33] used by FLOW-3D, which represents surface tension stresses via a body force and which is known to have limitations for
surface tension-dominated flows [27]. This long Q3
neck latter feature has been captured accurately using FES by both Wilkeset al. [16] and Chenet al. [24].
[image:12.595.72.506.84.661.2]Figure 11 shows the effect of viscosity on the limiting drop length before break-up, Ld, and drop volume, Vd, for a fixed flowrate Q¼1 ml/min out of a capillary withRo¼1.375 mm. These conditions are chosen to be comparable with those (Q¼1 ml/ min,Ro¼1.6 mm) simulated numerically by Wilkes et al. [16]; note also that following them, for both the experimental and CFD data reported here, Ld andVdare scaled with respect toRoandRo3, respecti-vely. The experimental data obtained and presented in Fig. 5(a) agrees very well with that of reference [16], which show that Ld is effectively constant for low viscosities before increasing rapidly for higher
[image:13.595.133.480.83.555.2]viscosities. The agreement with the FLOW-3D simulations, however, are far more variable. Although they agree well at intermediate viscosities, they are 25 per cent in error at the higher viscosities. More-over, FLOW-3D was unable to obtain converged solutions for the case of pure water, a typical example of the general finding that both CFX4.4 and FLOW-3D perform poorly for low viscosity liquids [28]. This possible feature of VOF simulations has been discussed in greater detail [27]. Corresponding data for drop volume is shown in Fig. 11(b). Agreement between theory and experiment is good with the greatest discrepancy being only 6 per cent for the
85 per cent glycerine case. Although the effect of vis-cosity is small in the cases presented, the finding that increasing glycerine concentration leads to a quasi-linear reduction in Vd is consistent with previous simulations [16,19].
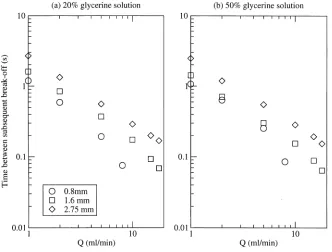
[image:14.595.46.498.71.517.2]The effects of flowrate,Q, on the time to break-up, td, for flow of 20 and 50 per cent glycerine solutions with 1 ml/minQ18 ml/min are shown in Fig. 12. The agreement between experimental and CFD data is excellent in all cases and plotting the data on logarithmic scales shows clearly that td is inversely proportional to Q, i.e. the gradients in both cases are21.
Figure 13 shows an instance in which the liquid thread breaks to form a secondary, satellite drop. This feature is often undesired in practical
applications because it can degrade print resolution. The figure shows two levels of grid refinement, first with a regular 16832 grid and then with a 23144 grid where the grid density has been increased by 40 per cent. This is another example for which FLOW-3D fails to predict the existence of a long thin liquid thread. The use of the finer grid enables FLOW-3D to predict both the existence of the satellite drop and the time at which it forms to within 8 per cent. Note, however, that the accurate prediction of its speed and size would require the use of much finer grids and, probably, local grid refinement in the relevant region [24].
Fig. 11 Effect of viscosity (glycerine concentration) on the limiting length,Ld, and drop volume,Vd,
for flow with Ro¼1.375 mm and Q¼1 ml/
min Fig. 12 Comparison between experimental and CFD (FLOW-3D) results of the effect of flowrate on the time to break-up, td, for (a) 50 per
[image:14.595.281.534.76.536.2] [image:14.595.38.276.94.504.2]5 CONCLUSIONS
The dynamics of drop formation is of great engineer-ing and scientific interest due to its importance in a
[image:15.595.157.460.83.647.2]wide range of industrial applications and the com-plex, dynamic nature of its associated free surface flow. Although previous studies have developed accurate numerical methods for simulating drop
formation, their specialized nature precludes their use by most engineers who need reliable results as quickly as possible. The present experimental and numerical study has assessed the capabilities and limitations of two popular commercial CFD packages, CFX and FLOW-3D, for solving drop for-mation flows; both packages use the VOF method, a popular choice for simulating complex free-surface problems.
Experimentally, the interface shape at the start of break-up has been shown for a wide range of viscosities. Increasing viscosity has little effect on drop length for low viscosities, but there is a dramatic increase at high viscosities; the drop volumes are less sensitive to viscosity. It has also been shown that there is a complex dependence of drop volume on the flowrate, and as jetting mode is approached, the droplet volume decreases rapidly. The experiments also highlight the difficulty of pro-ducing smaller drops as there is a diminishing reduction in drop volume as the tube diameter is decreased.
The CFD packages considered, generally, perform well for drop formation at higher flowrates and higher glycerine concentrations/viscosities and are able to predict quantities of practical engineering interest such as the time to break-up and, conse-quently, primary drop volume. The accuracy of the prediction of interfacial shapes, however, is limited by a certain degree of unavoidable smear-ing at free surface boundaries. This means that VOF-based methods have difficulty in resolving fine interfacial features, such as the long, thin threads between the liquid cone and primary drop that exist at low flowrates, as well as the size and shape of secondary, satellite drops that may form by subsequent break-up of the liquid thread. More generally, the CFD packages perform poorly for drop formation at low flowrates and viscosities where surface tension forces are dominant.
In general, the accuracy of the CFX and FLOW-3D packages is found to be similar for a given grid resolution. However, the former’s multiphase model, in which the flow equations are solved in both the liquid and gaseous regions, is found to be much less efficient than the latter’s single phase approach, which treats the free surface as a discontinuity. Consequently, of the two packages considered, FLOW-3D (version 8.01) is the most viable for practical engineering design of drop formation processes in the dripping mode. Note, however, that continual improvements in the accuracy and efficiency of CFD technologies will make the CFD approach an increasingly attractive tool for the design and analysis of such systems.
REFERENCES
1 Basaran, O. A. Small-scale free surface flows with breakup: drop formation and emerging applications.
AIChEJ, 2002,48(9), 1842 – 1848.
2 Heidiger, W. J. and Wright, M. W. Liquid extraction during drop formation: effect of formation time.
AIChEJ, 1986,32, 1372.
3 Shield, T. W., Bogy, D. B.,andTalke, F. E.A numerical comparison of one-dimensional fluid jet models applied to drop-on-demand printing. J. Comput. Phys., 1986,67, 324 – 347.
4 Shield, T. W., Bogy, D. B., and Talke, F. E. Drop formation by DOD ink-jet nozzles: a comparison of experiment and numerical simulation. IBM J. Res. Dev., 1987,31(1), 97 – 110.
5 Zhang, X.Dynamics of growth and breakup of viscous pendant drops into air.J. Colloid Inter. Sci., 1999,212, 107 – 122.
6 Eggers, J.Theory of drop formation.Phys. Fluids, 1994,
7(5), 941 –953.
7 Zhang, D. F. and Stone, H. A. Drop formation in viscous flows at a vertical capillary tube.Phys. Fluids, 1997,9(8), 2234 – 2242.
8 Rayleigh, L.On the stability of liquid jets.Proc. Lond. Math. Soc., 1878,10, 4.
9 Zhang, X.andBasaran, O. A.An experimental study of the dynamics of drop formation. Phys. Fluids, 1995,
A(7), 1184 – 1203.
10 Hauser, E. A., Edgerton, H. E., Holt, B. M.,andCox, J. T. The application of high-speed motion picture camera to research the surface tension of liquids. J. Phys. Chem., 1936,40, 973.
11 Stone, H. A., Bentley, B. J.,andLeal, L. G.An experi-mental study of the transient effects in the breakup of viscous drops.J. Fluid Mech., 1986,173, 131.
12 Peregrine, D. H., Shoker, G.,andSymon, A.The bifur-cation of liquid bridges.J. Fluid Mech., 1990,212, 25.
13 Shi, X. D., Brenner, M. P.,andNagel, S. R.A cascade of structure in a drop falling from a faucet.Science, 1994,
265, 219.
14 Henderson, D. M., Pritchard, W. G.,andSmolka, L. B.
On the pinch-off of a pendant drop of viscous liquid.
Phys. Fluids, 1997,11, 3188 – 3200.
15 Brenner, M. P., Eggers, J., Joseph, K., Nagel, S. R.,and
Shi, X. D. Breakdown of scaling in droplet fission at high reynolds numbers.Phys. Fluids, 1997,9, 1573.
16 Wilkes, E. D., Phillips, S. D.,andBasaran, O. A. Com-putational and experimental analysis of dynamics of drop formation.Phys. Fluids, 1999,11(12), 3577 – 3598.
17 Eggers, J.andDupont, T. F.Drop formation in a one-dimensional approximation of the Navier – Stokes equations.J. Fluid Mech., 1994,262, 205 – 221.
18 Papageorgiou, D. T.On the breakup of viscous liquid threads.Phys. Fluids, 1995,7(7), 1529 – 1544.
19 Ambravaneswaran, B., Wilkes, E. D., and Basaran, O. A.Drop formation from a capillary tube: comparison of one-dimensional and two-dimensional analyses and occurrence of satellite drops.Phys. Fluids, 2002,14(8), 2606 – 2621.
21 Schulkes, R. M. The evolution and bifurcation of a pendant drop.J. Fluid Mech., 1994,278, 83 – 100.
22 Richards, J. R., Beris, A. N.,andLenhoff, A. M.Drop formation in liquid – liquid systems before and after jetting.Phys. Fluids, 1995,7(11), 2617– 2630.
23 Summers, J. L., Thompson, H. M.,andGaskell, P. H.
Flow structure and transfer jets in a contra-rotating rigid roll coating system. Theor. Comput. Fluid Dyn., 2004,17(3), 189 – 212.
24 Chen, A. U., Notz, P. K.,andBasaran, O. A. Compu-tational and experimental analysis of pinch-off and scaling.Phys. Rev. Lett., 2002,88(17), 174501.
25 Pan, Y.andSuga, K.Capturing the pinch-off of liquid jets by the level set method. Trans. ASME, J. Fluids Eng., 2003,125, 922 – 927.
26 Zhang, X.Dynamics of drop formation in viscous flows.
Chem. Eng. Sci., 1999,54, 1759 – 1774.
27 Renardy, Y. and Renardy, M. PROST: a parabolic reconstruction of surface tension for the volume-of-fluid method.J. Comput. Phys., 2002,183, 400 – 421.
28 Fawehinmi, O. B.PhD
Q4 Thesis, University of Leeds, 2003.
29 Ramaswamy, B. J. Numerical simulation of unsteady viscous free surface flow.J. Comput. Phys.,90, 396.
Q5
30 Hirt, C. W.andNichols, B. D.Volume of fluid (VOF) method for the dynamics of free boundaries. J. Comput. Phys., 1981,39, 201.
31 Chen, A. U.andBasaran, O. A.A new method for sig-nificantly reducing drop radius without reducing nozzle radius in drop-on-demand drop production.
Phys. Fluids,14(1), L1– L4.
Q5
32 Chen, H. H. and Brenner, M. P. The optimal faucet.
Phys. Rev. Lett., 2004,92(6), 166106-1 – 166106 – 4.
33 Brackbill, J. U., Kothe, D. B.,andZemach, C.A conti-nuum method for modeling surface tension.J. Comput. Phys., 1992,100, 335 –354.
APPENDIX
Notation
H free surface curvature n free surface normal
p dimensionless fluid pressure Q flowrate
r,u,z dimensionless polar coordinates R˜ radial coordinate in contact circle Ro,Ri external and internal radii
Re Reynolds number St Stokes number
u dimensionless fluidvelocity Q1
U maximum velocity in capillary tube V˜z vertical velocity in contact circle