Article
Alternative Software for Evaluating Preliminary Rock
Stability of Tunnel using Rock Mass Rating (RMR)
and Rock Mass Quality (Q) on Android Smartphone
Pantawee Pantaweesak
1,2,a, Phongpat Sontamino
1,2,b,*, and Danupon Tonnayopas
1,2,c1 Department of Mining and Materials Engineering, Prince of Songkla University, Thailand 2 Center of Excellence in Materials Engineering (CEME), Prince of Songkla University, Thailand
E-mail: a[email protected], b[email protected] (Corresponding author), c[email protected]
Abstract. Nowadays, tunneling is applied to a variety of constructions such as subway
station, water supply tunnel and underground mine. Tunnel safety is one of the most important factors of construction. Most tunneling is operated in remote area that is difficult to reach. This research aims to develop an alternative software for Android smartphone, which use for estimating preliminary rock mass stability and suggesting support method for the early state tunnel. Suitable rock mass classifications for tunnel are rock mass rating (RMR) and rock mass quality (Q system). They are applied to the application. Android operating system is chosen because it is the most popular operating system in the world. The application is programmed by the official programming software from Google, the Android Studio. PSU-RQ is the name of this application. PSU-RQ is easy to use because it reduced the complexity of the theories by numerical logic. The application results are verified by comparing with Excel standard worksheet. PSU-RQ is reliable and accurate. The application is tested in a tunneling case study as an example. Whenever a smartphone is available, the user can estimate preliminary rock mass stability and support method of tunnel instantly. However, long-term stability investigation is necessary.
Keywords: Android application, rock mass rating, rock mass quality, tunnel stability.
ENGINEERING JOURNAL Volume 23 Issue 1
1.
Introduction
The rock mass rating (RMR) was initiated at the South African Council of Scientific and Industrial Research [1]. This principle has been developing by adjusting the parameters and equations for applying a variety of purposes such as rock slope stability estimation by slope mass rating (SMR) [2], hard rock TBM performance prediction [3] and strong-weak interbedding rock layers stability estimation [4]. RMR system is a simple geomechanics classification for estimating preliminary rock mass stability in mining and civil engineering. This geological rating is suitable for tunneling and foundation construction. The rock mass rating is popular not only with geological study on the Earth [5-7], but also with tunnel construction on the Mars [8].
Another suitable rock mass classification for estimating the rock mass stability of tunnel is the rock mass quality [9]. This principle is otherwise known as the Q system. This classification is used for evaluating ultimate support pressure and reinforcement method for tunnel. Q system was chosen in many studies such as cement grouted rock mass evaluation [10] and blast induced rock mass investigation [11]. Sometimes, the rock mass rating and the rock mass quality were studied together [12-14]. As mentioned above, the RMR and Q system have been using by many researchers. These two principles are chosen for this research.
Nowadays, technology is widespread in most areas of the world. The smartphone is one of the most popular digital devices. It makes our life easier to manage a lot of tasks by reducing the steps of many processes, especially communication and calculation. The Android is the most popular operating system in the world [15]. It is easy to use, diverse, affordable and compatible with a variety of devices. Non-official developer can develop the Android application free of charge. Smartphone unlocking is not required to install the non-official Android package. However, the android smartphone should meet the minimum requirements to run the application without bugs and errors.
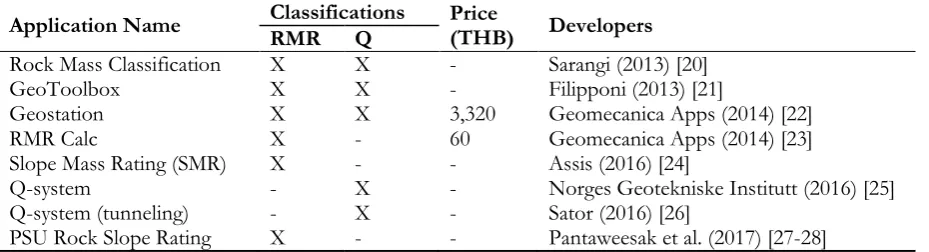
The objective of this research is to develop an alternative Android application for estimating preliminary rock mass stability and suggesting support method for tunnel using rock mass rating and rock mass quality. Many researchers have been interesting in the geological application on smartphone for a decade. The application for investigating geological site were developed on both operating systems, Android [16] and iOS [17]. However, some errors may occur when discontinuity orientation is gathered by the smartphone [18-19]. The user must be careful with this function. In 2013, the first commercial rock mass classification application appeared on Google Play Store then it was followed by other applications as shown in Table 1. Some applications only have the rock mass rating or the rock mass quality function while some applications have both. However, the Rock Mass Classification [20] and the Geotoolbox [21] cannot reveal the detail of estimated results. The Geostation [22] is the only application that can reveal detailed results, although the price is quite expensive. Very few of the applications are suitable for use in remote areas like tunnels. An application that can save the result for future use makes the estimation easier, but most applications do not support this function. This application is an option for the user to assess preliminary rock mass stability. However, long-term stability investigation is important, the user should use this application with other studies such as stereographic projection analysis and safety factor calculation.
Table 1. List of the rock mass rating and rock mass quality applications which operate on the Android smartphone, this list grouped main application, extension parts and free version of each application together.
Application Name Classifications RMR Q Price (THB) Developers
Rock Mass Classification X X - Sarangi (2013) [20]
GeoToolbox X X - Filipponi (2013) [21]
Geostation X X 3,320 Geomecanica Apps (2014) [22]
RMR Calc X - 60 Geomecanica Apps (2014) [23]
Slope Mass Rating (SMR) X - - Assis (2016) [24]
Q-system - X - Norges Geotekniske Institutt (2016) [25]
Q-system (tunneling) - X - Sator (2016) [26]
[image:2.595.69.534.589.715.2]2.
Background Theories
2.1. Rock Mass Rating (RMR)
The rock mass rating (RMR) is one of the effective rock mass classifications which based on practical knowledge of shallow tunneling [29]. The six parameters of RMR (R1-R6) were defined to determine rock
conditions. These parameters can be simplified for using in the tunnel by applying to other theories. The sum of rating values is the RMR value which can be calculated by Eq. (1):
RMR=R1+R2+R3+R4+R5+R6 (1)
where R1=rating of strength of intact rock, R2=rating of rock quality designation, R3=rating of spacing of
discontinuities, R4=rating of discontinuity conditions, R5=rating of groundwater condition and R6=rating of
discontinuity orientation. Each rating is compared from Bieniawski’s charts. The RMR value relates to rock mass stability. Estimated results from RMR charts consist of average stand-up time of the tunnel, cohesion of rock masses, internal friction angle of rock masses, allowable bearing pressure [1] and safe cut slope angle [30]. Each RMR parameter is described in the following sections.
2.1.1. Strength of intact rock (R1)
This parameter can be obtained from the uniaxial compressive strength or unconfined compressive strength test (UCS). Rock sample is compressed according to natural conditions. The compressive strength is the compression force per compressed area of rock sample. Another method to obtain the strength is point load strength index test (PLSI) [31-32]. In general, the strength has been tested during the exploration, rock mass in the same area is similar. However, the new test will estimate the most accurate results. In some cases, the user cannot test the rock sample at that moment, but need to know preliminary tunnel stability, the user can use the average uniaxial compressive strength of Palmstrom [33]. In the worst case, the experienced geologist can roughly recognize the strength of rock by striking the geological hammer to the rock surface [8]. The reaction force of the hammer and experience is the strength indicator.
2.1.2. Rock quality designation (R2)
The rock quality designation (RQD) is the percentage of core recovery along coring axis. It is the sum of length of core pieces that are greater or equal to 100 mm per meter [34]. Normally, core logging is operated before tunneling, most tunnels already have this value. At the earliest stage that core is not available, RQD value can be calculated from the volumetric joint count (Jv). Assessors must identify and count the appeared
discontinuities along the tunnel to find the number and type of them. The sum of number of horizontal discontinuities (such as beddings) divided by the tunnel height and number of vertical discontinuities (such as normal joints and faults) divided by the tunnel length is the volumetric joint count. If the tunnel is very long or discover the structural change of rock formation, engineers should zone the tunnel into smaller areas. Rock quality designation value can be calculated from Jv using Eq. (2) [35].
RQD=110-2.5Jv (2)
2.1.3. Spacing of discontinuities (R3)
2.1.4. Discontinuity conditions (R4)
Discontinuity conditions include roughness, separation (aperture), persistence, weathering and infilling materials (gouge) that exposed on the surface. Discontinuity evaluation requires a lot of judgment and experience because some conditions are not numerical values. Descriptive conditions (roughness and weathering) make the different interpretation of each person, the user must carefully evaluate these conditions. The roughness of discontinuity surface is divided into five levels from slickensided to very rough. The weathering is the degree of decay of discontinuity surface that is divided into five levels from unweathered to decomposed. The aperture is the width of discontinuity that stretched out and the persistence is the continuous of discontinuity length. Infilling materials are the substance in the discontinuity gap, normally it is clay or soil. These conditions can be individually evaluated before combined to create the condition value. The simplest way to obtain this value is the series estimation, which discontinuity conditions are grouped into the series [36].
2.1.5. Groundwater condition (R5)
Groundwater condition is very important parameter of the tunnel. Water pressure affects the strength of the rock mass. Generally, this condition is divided into five levels: completely dry, damp, wet, dripping and flowing. This parameter can be numerically measured by measuring the flow rate of groundwater in liters per ten meters (length of the tunnel) or the ratio of seepage water pressure per major principle stress [37]. Based on our experience, water flow measurement is difficult in the field and not required. Any areas that can measure the flow rate indicate that the groundwater condition is flowing.
2.1.6. Discontinuity orientation (R6)
The relation between discontinuity orientation and tunnel axis is a very influential factor in stability of the tunnel. The orientation is dip direction and dip angle of discontinuity plane. Dip direction is the direction that water on the discontinuity plane directly flows to the ground. Strike is another value instead of dip direction. The strike is the discontinuity alignment refer to the magnetic north (azimuth), perpendicular to dip direction. Dip angle is the angle between horizontal level and discontinuity plane, it can be measured in the same direction as the dip direction. This angle is between 0 and 90 degrees. The relation between tunnel axis and discontinuity orientation indicates the suitability of drive direction of the tunnel. Unfavorable drive caused unstable tunnel. This parameter can be used to assess the rock mass stability for other constructions such as dam foundation and slope. However, this principle is not suitable for estimating rock slope stability.
2.2. Rock Mass Quality (Q System)
Rock mass quality was introduced at the Norwegian Geotechnical Institute. This classification based on the knowledge of 200 case studies of tunnel and cavern [9]. Over the last 3 decades, 1,260 case studies have been proven that the Q system is the effective design of tunnel support assessment [38]. The Q parameters are like RMR parameters, but they are compared from Barton’s charts. Q value is calculated from six parameters using Eq. (3):
Q=(RQD/Jn)(Jr/Ja)(Jw/SRF) (3)
where RQD=rock quality designation, Jn=joint set number, Jr=joint roughness number, Ja=joint alteration
number, Jw=joint water reduction factor and SRF=stress reduction factor. The estimated results of Q system
are internal friction angle of rock mass [39], ultimate roof support pressure and ultimate wall support pressure [40]. The equivalent dimension (De) is calculated from tunnel span or height and the excavation support ratio
(ESR) of Q system. The excavation support ratio is the indicator of tunnel construction purpose. Type of utilization affects the stability requirement and tunnel size. The Q value and De value can plot on the
Fig. 1. Design chart of reinforcement conditions and supports [41]. 2.2.1. Joint set number (Jn)
Joints are usually formed in sets which can be identified by its orientation (strike or dip direction and dip angle). Rock mass without joints is called “massive rock mass”, this is the strongest rock mass in the same conditions as other rock masses. Some joints that individually appeared are called “random joint”, which commonly found with joint sets. The worst condition is heavily jointed rock mass or “sugar cube rock mass” and earth-like rock mass, if this condition is found, the engineer must proceed with extreme caution. 2.2.2. Joint roughness number (Jr)
Roughness of joint surface is mainly classified into three levels: rough, smooth and slickensided. This factor indicates the remaining friction force between joint surfaces in small-scale. Formation pattern of the rock mass face is the large-scale roughness indicator, it is mainly classified into two levels: undulating and planar. The Q roughness factor can be estimated from both roughness and formation pattern of the rock mass. Internal friction angle of rock mass can be calculated from this value and joint alteration number.
2.2.3. Joint alteration number (Ja)
[image:5.595.103.491.77.423.2]2.2.4. Joint water reduction factor (Jw)
Water pressure influence on shear strength of joints. When water flows through the joints, it will wash out infilling materials and soften clay gouge. Sometimes, the clay minerals can swell in joints and cause the decrease of shear strength of joints. In long run, groundwater may change the rock mass structure and discontinuity conditions.
2.2.5. Stress reduction factor (SRF)
Stress reduction factor can be determined from rock mass pressure loosening when excavated through shear zones or weakness zones. This factor can be calculated from the uniaxial compressive strength per major principle stress (the ratio of strength and stress). Another way to estimate this value is appeared tunnel conditions such as depth of the tunnel and rock mass structure.
3.
Android Application Development
3.1. Device
The application is programmed and complied on a laptop computer with processor AMD A8-4500AM 1.9 GHz, installed memory (RAM) 4 GB, operated on Windows 10 Pro. The first run proceeded on Android 6.0 (Marshmallow) smartphone with processor Quad core 1.3 GHz Cortex-A7, 512 MB installed memory, resolution 480x800 pixels on 4 inches screen.
3.2. Methodology
This Android application is developed by the official integrated development environment program, Android Studio version 2.2.2 and the Java development kit [42]. The application is suitable for Android smartphone, which operating system later than Android 4.1 (Jelly Beans) while the target operating system is Android 6.0 (Marshmallow). The calculation is verified by comparing the calculated results from this application with Microsoft Excel worksheet case by case. Finally, the application is tested with geological data from previous tunneling research to confirm the application results.
4.
Results
4.1. PSU-RQ Application
PSU-RQ is the name of this application. The application consists of three main modules (1) rock mass rating module for estimating preliminary rock mass stability of the tunnel which can use with other construction, (2) rock mass quality module for estimating support pressure of roof and wall of the tunnel and finding a suitable reinforcement method and (3) data manager module for saving the calculation results. The user-friendly interface is designed for beginners, instant module switch is allowed. Rock mass investigation guideline for the newcomer is contained in the application.
4.1.1. Rock mass rating module
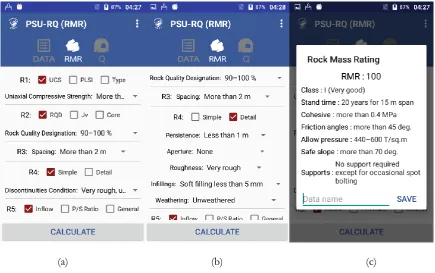
Rock mass rating module consists of six geological parameters as mentioned above. The user interface of this module is simplified by separating each parameter individually to eliminate data input sequence. The rock mass parameters are aligned in order, this way is suitable for the new user that need to follow the guideline of this application. For professional users, Non-sequential input is allowed. Only-a-choice check box is applied to prevent the recount error. Each parameter has several ways to input the raw data. For example, the user can input uniaxial compressive strength, point load strength index, or rock type as the strength of intact rock parameter (R1). For discontinuity conditions parameter (R4), user can enter a simple condition set
(a) (b) (c)
Fig. 2. (a) The user interface of the rock mass rating module which designed user friendly. (b) Several ways to input data set to the fourth parameter of rock mass rating (discontinuity conditions). (c) The results of rock mass stability estimation from rock mass rating module.
4.1.2. Rock mass quality module
Rock mass quality is complicated principle that has many ways of calculating. Each geological condition has their own way to calculate and estimate the Q value and other result. PSU-RQ solved this problem by numerical logic that simplified rock mass quality estimation. The user does not need to worry about many conditions of the rock mass quality system, just input a simple data set then the application report the results. The user interface of this module like the rock mass rating module for the unity of application as shown in Fig. 3(a). The module results reveal the ultimate roof and wall support pressure of tunnel, internal friction angle, rock mass quality value (Q) and equivalent dimension (De). The support methods of tunnel (length of
rock bolts, shotcrete thickness and liner specification) can be estimated by plotting the Q value against De
value on the reinforcement chart as shown in Fig. 3(b). The user can apply this suggestion with the tunnel to improve the safety of the early phase tunnel. In this research, the application does not plot the Q and De
value automatically, so the user can decide the support methods according to the opinion. For example, when the user increases the support level from estimated results user will receive more safety factor of the tunnel. If the user decreases the support level, it may lead to less tunnel stability, but receive more economic value. 4.1.3. Data manager module
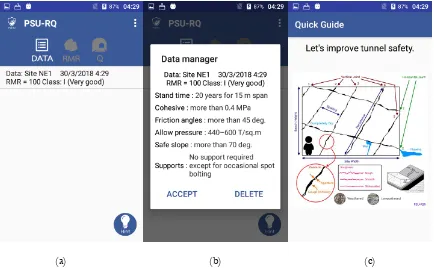
[image:7.595.80.516.78.351.2](a) (b)
Fig. 3. (a) The rock mass quality user interface for the unity of the application and reducing the complexity. (b) The results of suggested support methods and comparison chart.
(a) (b) (c)
Fig. 4. (a) The data list page which allows user to save estimated results. (b) The saved results include data name and rock mass stability from the rock mass rating module. (c) Rock mass study guideline for new user and who unfamiliar with geological field.
4.2. Application Verification
[image:8.595.155.443.78.347.2] [image:8.595.82.516.394.665.2]from Microsoft Excel worksheet. MS Excel is a calculation program that is recognized around the world. The rock mass standard worksheet is created and reviewed several times to ensure accurate calculations.
The comparison results are significant. Estimated results of PSU-RQ perfectly match the standard worksheet. Non-sequential input, double check box selection and other uncommon usages are tested to eliminate bugs and errors. PSU-RQ application for estimating rock mass stability and suggesting support methods is accurate and reliable refer to the theories. Some random conditions that are used to compare the rock mass rating results are shown in Table 2. The rock mass quality conditions are shown in Table 3 and Table 4 is the results of the rock mass quality module. However, these theories are only preliminary stability estimation, other precise principles should be used in long-term study. In very unusual cases, evaluation results may be faulty.
Table 2. Comparison list of rock mass rating module with random rock mass conditions.
Random Rock Mass Conditions Excel
RMR PSURQ
UCS
(MPa) RQD (%) Spacing (m) Conditions Ground water Orientation
75 80 0.4 Soft gouge, continuous Dripping V.unfavorable 26 26
15 60 3 Slightly rough, weathered Flowing Fair 50 50
0.5 35 0.1 Rough, slightly weathered Dry Unfavorable 46 46
175 20 1 Unweathered, no aperture Wet Fair 62 62
40 95 3 Slightly rough, weathered Dripping Favorable 66 66
251 60 0.05 Rough, slightly weathered Flowing Fair 53 53
40 35 1 Slightly rough, weathered Dry Fair 50 50
3 80 0.4 Soft gouge, wide
continuous discontinuities Damp V.favorable 38 38
251 95 0.05 Slickensided, gouge,
continuous joints Damp Fair 55 55
0.5 20 0.1 Very rough, unweathered,
no separation Wet Fair 36 36
Table 3. Random rock mass conditions for verifying the calculation of the rock mass quality module.
Random Rock Mass Conditions RQD
(%) Joints Roughness Alteration Water Stress Purpose Span (m)
1 Massive Clay zone Strongly
consolidated Filling outwash Multiple weakness zone Temporary opening 5 10 Few joints Slickensided,
planar Medium consolidated Inflow, decaying Single weakness zone Water tunnels 10 20 One set Smooth, planar Swelling clay
filling Inflow Single zone shear Storage caverns 15 30 One set,
random Rough, planar Crushed rock zone Dry Open joints Power stations 20 40 Two sets Slickensided,
undulation Sandy clay fraction Medium inflow Medium stress Railway stations 25 50 Two sets,
random Smooth, undulation Thick zone clay Large inflow Moderate slabbing Temporary opening 30 60 Three sets Rough,
undulation Tightly healed Filling outwash Heavy burst rock Water tunnels 35 70 Three sets,
random Discontinuous Unaltered joints Inflow, decaying Heavy squeezing Storage caverns 40 80 Four sets Clay zone Slightly
altered Inflow Heavy swelling Power stations 60 90 Crushed
[image:9.595.67.529.237.444.2] [image:9.595.70.527.480.770.2]Table 4. Comparison results between the standard worksheet and the PSU-RQ.
Standard Worksheet (MS Excel) PSU-RQ Application
Q Roof
Pressure (kPa)
Wall Pressure (MPa)
Friction Angle (degree)
De Q Roof
Pressure (kPa)
Wall Pressure (MPa)
Friction Angle (degree)
De
0.011 899.29 0.21 9.46 1 0.011 899.29 0.21 9.46 1
0.038 2390.08 0.40 3.58 5 0.038 2390.08 0.40 3.58 5
0.030 1930.98 0.30 5.71 12 0.030 1930.98 0.30 5.71 12
0.600 632.34 0.12 8.53 20 0.600 632.34 0.12 8.53 20
1.980 530.91 0.08 16.70 38 1.980 530.91 0.08 16.70 38
0.018 2274.14 0.38 6.91 8 0.018 2274.14 0.38 6.91 8
0.029 1513.17 0.22 75.96 19 0.029 1513.17 0.22 75.96 19
0.233 649.73 0.06 75.96 32 0.233 649.73 0.06 75.96 32
0.016 9524.41 0.79 26.57 60 0.016 9524.41 0.79 26.57 60
0.600 7588.04 0.35 9.46 123 0.600 7588.04 0.35 9.46 123
5.
Application in Tunneling Case
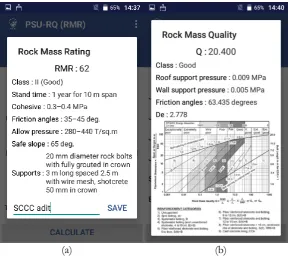
The application is applied with a tunneling case of limestone quarry as an example. The horseshoe adit with 5 meters span of Siam City Cement Public Company Limited (SCCC) was designed to reduce haulages cost in the limestone quarry, Saraburi province of Thailand [43]. The rock mass in this area is divided into three zones: bedded limestone, thrust fault, and spatic limestone. The adit entrance was designed in bedding layer of dark-gray micritic limestone, chert layers, calcareous siltstone, and siltstone. The average strength of rock samples is 93.6 MPa. The rock quality designation is 51%. Tunnel axis was driven to 8 degrees (azimuth). Main joint set strike/dip is 130/60 degrees. Some rock layers are silicified and very hard. The aperture of joints is between 2.5 and 10 millimeters without infilling materials. The spacing is between 30 and 50 centimeters with tight surfaces. Estimated results from the application shown that this rock mass has RMR value equal to 62 classified in class II (Good) and Q value is 20.4 classified in good class as shown in Fig. 5. The results are slightly different from previous research because it may have more detail than this re-estimation. The estimated results both rock mass class and support as shown in Table 5 are consistent. This comparison proves that the PSU-RQ is a reliable application and suitable for actual use in the field.
(a) (b)
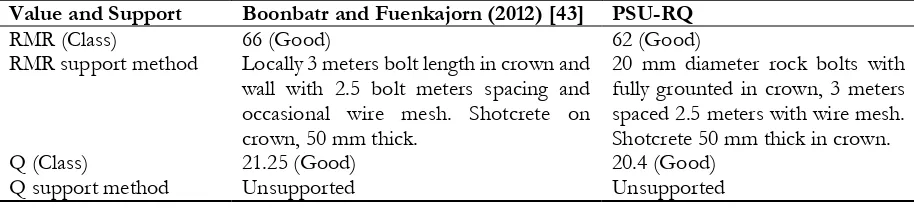
[image:10.595.153.442.490.747.2]Table 5. Estimated results from PSU-RQ application and the previous research of SCCC bedded limestone.
Value and Support Boonbatr and Fuenkajorn (2012) [43] PSU-RQ
RMR (Class) 66 (Good) 62 (Good)
RMR support method Locally 3 meters bolt length in crown and wall with 2.5 bolt meters spacing and occasional wire mesh. Shotcrete on crown, 50 mm thick.
20 mm diameter rock bolts with fully grounted in crown, 3 meters spaced 2.5 meters with wire mesh. Shotcrete 50 mm thick in crown.
Q (Class) 21.25 (Good) 20.4 (Good)
Q support method Unsupported Unsupported
6.
Conclusion
PSU-RQ is an accurate and reliable Android application for evaluating preliminary rock mass stability and tunnel support methods using rock mass rating and rock mass quality. This application is designed to use in remote areas. It is an effective tool that assists geologist to assess preliminary rock mass stability faster than ever. The case study re-estimation proves that the results are credible. It saves a lot of working hours whenever the Android smartphone is available. The data manager module is an important part of this application. This module can reduce human error from hand writing and traditional calculation. A lot of data is organized systematically. PSU-RQ is the first rock mass rating and rock mass quality application that has the data manager module. This application will make the operators more interested in safety.
The application needs the effective input for estimating the significant results. If the raw data is biased or inaccurate, it will cause incorrect estimation. The simple input routes in this application (such as the average uniaxial compressive strength of rock type and the volumetric joint count) are only for the restricted cases. Different rock type has different properties. The same rock in different areas may have different properties. If possible, the user should test new rock samples every time to apply with the rock mass stability evaluation. Always test the rock samples at least 5 samples to find the average value. The average makes the data more reliable. If the user found that the samples in nearby area are equally strength, the user may set this strength as a standard. Other parameters must be gathered from estimating area as mentioned in the background theories. Do not use the parameters of the case study in this research with other rock masses, each area is unique.
In addition to rock testing, joint analysis is another method that should be done together. It helps to group joints data and indicate the significant joints. Stereographic projection is the key. Contour diagram is the plotting of joint orientation data on the equal-area stereonet. If the orientation poles on diagram are very dense, then this data set is the important discontinuity. This major discontinuity makes the assessment more relevant. Random discontinuities are low density on the diagram. Sometimes, the minor discontinuity may have dangerous conditions (for example: the persistence is extremely long, and the aperture is extremely large) that make it a major discontinuity. If the geological structure is folded, the user should use the beta diagram (-diagram). Folded structure makes it difficult to assess the real orientation of discontinuity. Beta diagram is a simple method for defining the orientation of cylindrical fold axis.
However, the geologist and the engineer need to assess the stability and support method in detail. These theories are not suitable to use as the main stability estimation. Monitoring of long-term stability is still needed to improve tunnel safety. Stereographic projection is used to evaluate the suitability of direction and angle that may cause failures. The main failure modes of rock mass are plane failure, wedge failure and toppling failure. Steep rock face has a greater chance of collapse. Factor of safety calculation is another method for evaluating the stability. Limit equilibrium analysis is one of the safety factor calculation theories. It is a volumetric calculation that takes into account the dimensions and properties of the rock mass. The probability analysis is a method should be used with a conventional limit equilibrium method [44]. It confirms the results of the stability assessment and can be applied to many types of work.
[image:11.595.69.526.117.221.2]estimate the preliminary rock mass stability and improve the safety. In the long-run, it will save time and reduces redundancy. Downloadable content of PSU-RQ is shown in Fig. 6.
Fig. 6. QR code to access the Android package of PSU-RQ.
Acknowledgements
This research is funded by 5-Year Bachelor’s-Master’s Degree Program Scholarship 2017 from Department of Mining and Materials Engineering, Faculty of Engineering, and PSU.GS. Financial Support for Thesis 2018 from Graduate School, Prince of Songkla University, Thailand. We would like to acknowledge Center of Excellence in Materials Engineering (CEME), Faculty of Engineering, Prince of Songkla University, for supporting this research.
References
[1] Z. T. Bieniawski, “Engineering classification of jointed rock masses,” The Civil Engineer in South Africa, vol. 15, no. 12, pp. 335-343, 1973.
[2] M. Romana, “New adjustment ratings for application of Bieniawski classification to slopes,” in Proc.
International Symposium on the Role of Rock Mechanics, Zacatecas, 1985, pp. 49-53.
[3] J. K. Hamidi, K. Shahriar, B. Rezai, and J. Rostami, “Performance prediction of hard rock TBM using Rock Mass Rating (RMR) system,” Tunnelling and Underground Space Technology, vol. 25, no. 4, pp. 333-345, Jul. 2010.
[4] M. Mohammadi and M. F. Hossaini, “Modification of rock mass rating system: Interbedding of strong and weak rock layers,” Journal of Rock Mechanics and Geotechnical Engineering, vol. 9, no. 6, pp. 1165-1170, Dec. 2017.
[5] D. Tonnayopas, “Rock slope assessment of carbonate rock quarries using stereo-net projection method and rock mass classification,” (in Thai), University of the Thai Chamber of Commerce Journal Science and
Technology, vol. 1, no. 2, pp. 1-17, Jul. 2014.
[6] H. Basahel and H. Mitri, “Application of rock mass classification systems to rock slope stability assessment: A case study,” Journal of Rock Mechanics and Geotechnical Engineering, vol. 9, no. 6, pp. 993-1009, Dec. 2017.
[7] F. Ferrari, T. Apuani, and G. P. Giani, “Rock Mass Rating spatial estimation by geostatistical analysis,”
International Journal of Rock Mechanics and Mining Sciences, vol. 70, pp. 162-176, Sep. 2014.
[8] H. D. Beemer and D. S. Worrells, “Conducting Rock Mass Rating for tunnel construction on Mars,”
Acta Astronautica, vol. 139, pp. 176-180, Oct. 2017.
[9] N. Barton, R. Lien, and J. Lunde, “Engineering classification of rock masses for the design of tunnel support,” Rock Mechanics and Rock Engineering, vol. 6, no. 4, pp. 189-236, Dec. 1974.
[10] A. Zolfaghari, A. S. Bidar, M. R. M. Javan, M. Haftani, and A. Mehinrad, “Evaluation of rock mass improvement due to cement grouting by Q-system at Bakhtiary dam site,” International Journal of Rock
[image:12.595.210.385.112.294.2][11] H. K. Verma, N. K. Samadhiya, M. Singh, R. K. Goel, and P. K. Singh, “Blast induced rock mass damage around tunnels,” Tunnelling and Underground Space Technology, vol. 71, pp. 149-158, Jan. 2018.
[12] V. M. Khatik and A. K. Nandi, “A generic method for rock mass classification,” Journal of Rock Mechanics
and Geotechnical Engineering, vol. 10, no. 1, pp. 102-116, Feb. 2018.
[13] A. Palmstrom and E. Broch, “Use and misuse of rock mass classification systems with particular reference to the Q-system,” Tunnelling and Underground Space Technology, vol. 21, no. 6, pp. 575-593, Nov. 2006.
[14] S. Y. Choi and H. D. Park, “Comparison among different criteria of RMR and Q-system for rock mass classification for tunnelling in Korea,” Tunnelling and Underground Space Technology, vol. 17, no. 4, pp. 391-401, Oct. 2002.
[15] International Data Corporation. (2017). Smartphone OS Market Share 2017 Q1 [Online]. Available: https://www.idc.com/promo/smartphone-market-share/os [Accessed: 25 February 2018]
[16] Y. H. Weng, F. S. Sun, and J. D. Grigsby, “GeoTools: An android phone application in geology,”
Computers and Geosciences, vol. 44, pp. 24-30, Jul. 2012.
[17] S. Lee, J. Suh, and H. Park, “Smart Compass-Clinometer: A smartphone application for easy and rapid geological site investigation,” Computers and Geosciences, vol. 61, pp. 32-42, Dec. 2013.
[18] L. Novakova and T. L. Pavlis, “Assessment of the precision of smart phones and tablets for measurement of planar orientations: A case study,” Journal of Structural Geology, vol. 97, pp. 93-103, Apr. 2017.
[19] R. W. Allmendinger, C. R. Siron, and C. P. Scott, “Structural data collection with mobile devices: Accuracy, redundancy, and best practices,” Journal of Structural Geology, vol. 102, pp. 98-112, Sep. 2017. [20] R. Sarangi. (2013). Rock Mass Classification [Online]. Available: https://play.google.com/store/apps/
details?id=com.rakeshsarangi.rockmassclassification [Accessed: 27 February 2018]
[21] Filipponi. (2013). GeoToolbox [Online]. Available: https://play.google.com/store/apps/details?id= appinventor.ai_marco_filipponi.GeoToolbox [Accessed: 27 February 2018]
[22] Geomecanica Apps. (2014). Geostation [Online]. Available: https://play.google.com/store/apps/ details?id=es.terrasolum.geostation [Accessed: 27 February 2018]
[23] Geomecanica Apps. (2014). RMR Calc [Online]. Available: https://play.google.com/store/apps/ details?id=es.terrasolum.rockmassratingcalc2 [Accessed: 27 February 2018]
[24] D. Assis. (2016). Slope Mass Rating (SMR) [Online]. Available: https://play.google.com/store/apps/ details?id=com.projecto.diogoassis.smr [Accessed: 27 February 2018]
[25] Norges Geotekniske Institutt. (2016). Q-system [Online]. Available: https://play.google.com/store/ apps/details?id=Jacob.ngi.q.system [Accessed: 27 February 2018]
[26] Sator. (2016). Q-System (tunneling) [Online]. Available: https://play.google.com/store/apps/details?id= com.geckogeotech.Q_System [Accessed: 27 February 2018]
[27] P. Pantaweesak, P. Sontamino, and D. Tonnayopas, “Android application development for estimating rock slope stability using slope mass rating (SMR),” (in Thai), in Proc. The 6th Science, Engineering and
Resources Undergraduate Conference, Songkhla, Thailand, 2017, p. 55.
[28] P. Pantaweesak, P. Sontamino, D. Tonnayopas, and H. Vattanasak, “PSU-RSR v.1: An initial android application for estimating rock mass stability,” in Proc. Coal Mining and Utilization for Sustainable
Development International Conference, Lampang, Thailand, 2017, pp. 155-162.
[29] B. Singh and R. K. Goel, Engineering Rock Mass Classification: Tunneling, Foundations, and Landslides. New York: Elsevier, 2011.
[30] T. Waltham, Foundations of Engineering Geology, 2nd ed. Abingdon: Taylor & Francis, 2002.
[31] Z. T. Bieniawski, “Determining rock mass deformability: experience from case histories,” International
Journal of Rock Mechanics and Mining Sciences & Geomechanics Abstracts, vol. 15, no. 5, pp. 237-247, Oct.
1978.
[32] Z. T. Bieniawski, Rock Mechanics Design in Mining and Tunneling. Rotterdam: A. A. Balkema, 1984. [33] A. Palmstrom, “Recent developments in rock support estimates by the RMi,” Journal of Rock Mechanics
and Tunnelling Technology, vol. 6, no. 1, pp. 1-19, May 2000.
[34] D. U. Deere and D. W. Deere, “Rock quality designation (RQD) after twenty years,” Department of the Army, US Army Corps of Engineers, Gainesville, FL, Rep. GL-89-1, 1989.
[35] A. Palmstrom, “Measurements of and correlations between block size and rock quality designation (RQD),” Tunnelling and Underground Space Technology, vol. 20, no. 4, pp. 362-377, Jul. 2005.
[37] Z. T. Bieniawski, “The geomechanics classification in rock engineering applications,” in Proc. The 4th
Congress of the International Society for Rock Mechanics, Montreux, Switzerland, 1979, pp. 41-48.
[38] N. Kumur, “Rock mass characterization and evaluation of supports for tunnels in Himalaya,” Ph.D. thesis, WRDM, IIT, Roorkee, India, 2002.
[39] N. Barton, “Some new Q-value correlations to assist in site characterisation and tunnel design,”
International Journal of Rock Mechanics and Mining Sciences, vol. 39, no. 2, pp. 185-216, Feb. 2002.
[40] R. Bhasin and E. Grimstad, “The use of stress-strength relationship in the assessment of tunnel stability,” in Proc. The Recent Advances in Tunnelling Technology, New Delhi, India, 1996, pp. 183-196.
[41] E. Grimstad and N. Barton, “Updating of the Q-system for NMT,” in Proc. The International Symposium
on Sprayed Concrete-Modern Use of Wet Mix Sprayed Concrete for Underground Support, Oslo, Norway, 1993.
[42] International Business Machine. (2017). Android Studio [Online]. Available: https://developer.android. com/studio/index.html [Accessed: 20 October 2016]
[43] A. Boonbatr and K. Fuenkajorn, “Design and analysis of adit for limestone quarry of Siam City Cement Public Company Limited,” in Proc. Thailand Rock Mechanics Symposium, Phetchaburi, Thailand, 2012, pp. 229-238.
![Fig. 1. Design chart of reinforcement conditions and supports [41].](https://thumb-us.123doks.com/thumbv2/123dok_us/8106635.235285/5.595.103.491.77.423/fig-design-chart-reinforcement-conditions-supports.webp)