This is a repository copy of Analysis of the flowability of cohesive powders using Distinct Element Method.
White Rose Research Online URL for this paper: http://eprints.whiterose.ac.uk/1103/
Article:
Moreno-Atanasio, R, Antony, SJ and Ghadiri, M (2005) Analysis of the flowability of
cohesive powders using Distinct Element Method. Powder Technology, 158 (1-3). 51 - 57. ISSN 0032-5910
https://doi.org/10.1016/j.powtec.2005.04.029
Reuse
Unless indicated otherwise, fulltext items are protected by copyright with all rights reserved. The copyright exception in section 29 of the Copyright, Designs and Patents Act 1988 allows the making of a single copy solely for the purpose of non-commercial research or private study within the limits of fair dealing. The publisher or other rights-holder may allow further reproduction and re-use of this version - refer to the White Rose Research Online record for this item. Where records identify the publisher as the copyright holder, users can verify any specific terms of use on the publisher’s website.
Takedown
If you consider content in White Rose Research Online to be in breach of UK law, please notify us by
White Rose Consortium ePrints Repository
http://eprints.whiterose.ac.uk/
This is an author produced version of a paper published in Powder Technology. This paper has been peer-reviewed but does not include final publisher proof-corrections or journal pagination.
White Rose Repository URL for this paper: http://eprints.whiterose.ac.uk/archive/00001103/
Citation for the published paper
Moreno-Atanasio, R. and Antony, S.J. and Ghadiri, M. (2005) Analysis of flowability of cohesive powders using Distinct Element Method. Powder Technology, 158 (1-3). pp. 51-57.
Citation for this paper
To refer to the repository paper, the following format may be used:
Moreno-Atanasio, R. and Antony, S.J. and Ghadiri, M. (2005) Analysis of flowability of cohesive powders using Distinct Element Method.
Author manuscript available at: http://eprints.whiterose.ac.uk/archive/00001103/ [Accessed: date].
Published in final edited form as:
Analysis of flowability of cohesive powders using Distinct Element Method
R. Moreno-Atanasio, S. J. Antony, M. Ghadiri
Institute for Particle Science and Engineering, University of Leeds, Leeds, LS2 9JT, U.K.
ABSTRACT
Computer simulations using Distinct Element Method (DEM) have been carried out to
investigate the effect of cohesion on the flowability of polydisperse particulate systems. For this
purpose, two assemblies with different values of surface energy and made of 3000 spheres with
the mechanical properties of glass beads were considered. The analysis of the flowability of the
powders is presented in terms of the unconfined yield stress as a function of strain rate for
different pre-consolidation loads. For values of the surface energy of 1.0 J/m2 and strain rates
lower than 6 s-1, the unconfined yield stress does not change significantly indicating a
quasi-static behaviour of the particulate assemblies during the compression process. For larger strain
rates, the unconfined yield stress varies with the power index of 1.2 of the strain rate. The
influence of the pre-consolidating stress on the powder behaviour has also been investigated and
a flow factor was obtained from the linear relationship between the unconfined yield stress and
pre-consolidation stress. The computer simulations show qualitatively a good agreement with
the experimental trends on highly cohesive powder flow behaviour.
Keywords: flowability, cohesive powders, unconfined, yield stress, polydisperse, glass beads,
1. Introduction
The processing of many particulate materials may involves unit operations such as fluidisation,
pneumatic conveying and storage in bins and hoppers. During processing, the behaviour of
powders is strongly influenced by particle properties as well as the design and operating
conditions of these units. The flowability of powders in such unit operations is an important
issue as it can strongly influence the efficiency and reliable operation of these processes.
The flowability of powders is commonly analysed using the concept of Coulomb failure [1],
which describes the existence of a limiting shear stress under which solids do not undergo plastic
deformation. However, if the shear stresses are equal to the limiting shear stress, failure or
plastic flow is observed in the material. The concept of Coulomb failure for solids was applied
to granular materials [1] and was later used to optimise the design of hoppers by establishing a
criterion for the flow of powders through the outlet of silos [2].
The flowability of powders is commonly characterised by using shear testers. These devices
provide an indication of the shear strength of powders under a compressive load and can be used
for the design of different operational units such as silos. Schwedes [3] has recently presented a
comprehensive review on shear testing and has provided a comparison between different shear
test devices and an analysis of the properties that influence the flowability of powders such as
pre-consolidation, anisotropy [3, 4] and the influence of the stress history on the flow behaviour
Most published work in the field of flowability and shear behaviour of powders is experimental.
However, in experiments the measurements are usually made only from the boundaries of the
assemblies as any effort to probe the internal state of the assembly might interfere with the
behaviour of the particles. In contrast, the use of computer simulation allows the probing of the
internal behaviour of particulate assemblies under mechanical loading. Therefore, the analysis
of the flowability and shear behaviour of powders using computer simulation is attracting
increasing attention recently [5-9].
Thornton and co-workers [5-7] have analysed the influence of friction and bulk density on the
quasi-static shear deformation of powders. Thornton and Antony [5-6] showed that the strong
force chains developing within the assembly contributed much more to the deviator stress than
the weak force networks. In addition, they reported that no large increase in dissipation of
energy occurred when the interparticle friction was increased.
Recently, Thornton and Zhang [7] have simulated the development of shear bands in a
two-dimensional box type shear cell using DEM. They showed that the shear stresses measured on
the platens of the shear cell follows the same tendency as the stress tensor in the shear bands.
They conclude that the behaviour of bulk particles is mainly controlled by the stresses developed
in the shear bands. They also analysed the bed expansion during shearing in dense granular
materials for normal applied loads between 10 and 20 MPa. Although the variation in the
normal applied stress was very small, an increase in the bed expansion was clearly observed
when the normal stress was increased.
Gröger et al. [8] have also investigated the shear strength of powders using DEM. In their
liquid bridges between particles. They simulated the shear deformation of powders between two
platens moving in opposite directions under a normal load. The particles were subjected to
periodic boundary conditions. They provided a visual analysis of the behaviour of the powders
during shearing at the peak shear stress. For this condition, the direction of the contacts carrying
small forces coincided with the direction of the relative movement of the platen. However, the
contacts carrying large forces were inclined in the direction perpendicular to the contacts with
weakest forces. The orientation distribution of contacts is not affected by the relative movement
of the platens, although the strong and weak networks of forces changed orientation producing a
rotation of the principal stresses. However, the most important point is that the orientation
distribution of contacts remains constant as if the sample would not have been sheared. These
results are in contrast to the findings of other authors [5,6] who found that the anisotropy of
orientation of contacts reaches a maximum at the peak of shear stress. Furthermore, Gröger et
al. [8] compared the shear stress-shear strain profile obtained by DEM with that obtained
experimentally by a Schulze shear tester. This comparison showed an outstanding agreement
between simulation and experiments [8] indicating the reliability of DEM as a tool to predict the
shear behaviour of powders.
In this paper, results of DEM simulations analysing the flowability of cohesive powders are
reported. The flow factor as suggested by Jenike [1] for cohesive materials is also presented.
The unconfined yield stress (UYS) of the powders has been obtained from simulating the
uniaxial compression of particulate assemblies subjected to different values of pre-consolidating
2. Simulation details
Two polydisperse systems made of 3000 spherical particles with properties corresponding to
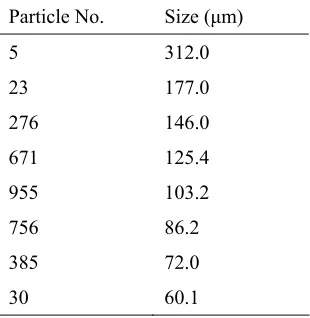
glass beads (Table 1) are considered. In order to perform the simulations a particle size
distribution of the powders corresponding to a typical manufactured supply was chosen. This
particle size distribution is nearly symmetric around its maximum at 125 m with the range of
the particle diameters being between 56 and 212 m. The probability density of size distribution
is given in Table 2.
The two systems were formed by generating two random assemblies of spheres and further
allowing the deposition of particles by the action of gravity. The surface energies of the particles
of the two systems were 1.0 and 0.1 J/m2, respectively. In order to minimise the differences
between the two systems the initial particles positions were exactly the same for both cases.
The simulation program used here is based on the work of Thornton and coworkers [10,11]. The
interparticle adhesion is according to the model of Johnson et al. [12]. According to this model
the force to break a contact under normal tension, FOFF, depends on the surface energy and the
radii of the two particles in contact as given by
R 3
FOFF = πγ (1)
where R-1 = (R1-1+R2-1) is the reduced radius of two particles in contact, is the surface energy
and R1 and R2the radii of the two particles in contact. The contact deformation in this work is
When tangential forces act on the contact between particles the change in the radius of the
contact area, a, is provided by the model of Savkoor and Briggs [13] according to Eq. 2:
⎪⎭ ⎪ ⎬ ⎫ ⎪⎩ ⎪ ⎨ ⎧ ⎥ ⎦ ⎤ ⎢ ⎣ ⎡ + − + + = G 4 E T F 4 NF 4 F 2 N E 4 R 3 a 2 2 OFF OFF OFF 3 (2)
where T and N are the applied tangential and normal forces and E and G are the reduced elastic
and shear modulii, respectively. These are defined as functions of the elastic modulus, E1and E2
and shear modulii, G1 and G2, of the two particles in contact:
2 2 2 1 2 1 E 1 E 1 E
1 ν −ν
+ −
= (3)
2 2 1 1 G ) 2 ( G ) 2 ( G
1 = −ν + −ν
(4)
The above model treats the interparticle contact as an annular crack and defines the condition for
crack extension due to shear stress, leading to Eq. 2.
The behaviour of the system has been analysed by monitoring the number of interparticle
contacts, the pressure on the top platen and the stress tensor in the bulk.
The definition of stress tensor used here is due to Satake [14], where he considers a volume V,
and defines a macroscopic stress acting on the volume based on the interparticle contact forces.
∑ + ∑
= M
1 i j
j i M
1
ij RTnt
V 2 n Nn R V 2
σ (5)
where Rni is the i component of the radius vector from the centre of the particle to the contact,
Nni, Ttj are the i and j components of the normal and tangential contact forces, respectively, and
M the number of interparticle contacts. The sum of the forces in every contact of the assembly is
divided by the volume of the assembly and therefore the information is given on the whole state
of the stress of the system.
3. Simulation results
3.1. Formation of the assemblies
The particles were initially created within a cubic space. An elastic platen whose elastic
modulus corresponds to steel was placed along the bottom side of the cube. The platen was
frictionless and cohesionless. The side walls of the cube were taken as rigid boundaries in which
the particles rebound without energy dissipation.
Initially, the particles were allowed to settle down within the cubic space by the action of
gravity. In Table 3 the packing fraction, number of interparticle contacts and normal
components of the stress tensor after the deposition of the particles are given. The components
of the stress tensor were close for both assemblies, although they have different values of surface
energy. This suggests that the surface energy does not produce a significant increase in the stress
components when the packing of the assemblies is loose. This is in contrast to previous results
[9] where the introduction of surface energy in a denser packed system (packing fraction 0.65)
cohesion on the bulk behaviour of particles. However, in the case analysed here the system is
more loosely packed and the particles were cohesive from the beginning of the simulation.
3.2. Effect of surface energy on the flowability of powders
The flow properties of particles are usually measured by using direct or indirect shear testers [3].
In the study carried out here, as commonly performed in the industry, the flowability of powders
is analysed by determining the unconfined yield stress in uniaxial compression tests. The
simulations are carried out in a similar way to the experimental procedure [3] and it is
schematically shown in Fig. 1. The particulate assembly was placed in between elastic platens
(steel) at the top and bottom surfaces. The side boundaries were removed and later the top platen
was moved downwards with a specific strain rate. The unconfined yield stress is therefore the
normal stress required to cause the failure of the assembly.
The number of interparticle contacts as well as the force acting on the top platen was monitored
during the compression. The sample was considered to have failed when a sharp peak on the
platen force accompanied by a significant drop in the number of contacts was observed. The
force at this point divided by the platen area was taken as the unconfined yield stress (UYS).
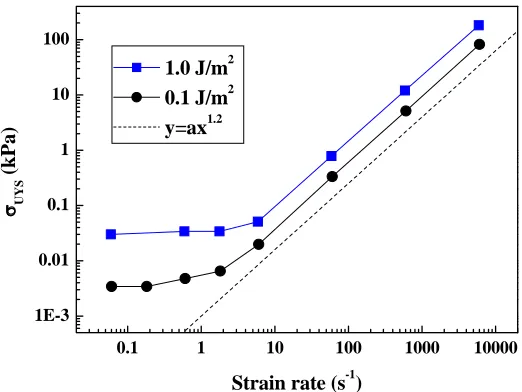
Figure 2 shows on a log-log scale the UYS as a function of the strain rate for the cases of
particles with surface energy values of 1.0 J/m2 and 0.1 J/m2. The UYS does not depend on
strain rate for values of strain rate lower than 2 s-1 for the system with 0.1 J/m2 and lower than
6 s-1 for the case of system with surface energy 1.0 J/m2. This is qualitatively in agreement with
experimental observations for the quasi-static regime [15] in which the UYS is independent of
surface energy produces a similar increase in the UYS for the quasi-static regime. These results
are in agreement with previous simulations of a highly polydispersed system [9].
For values of strain rate larger than corresponding to the quasi-static regime (see Fig. 2), an
almost linear relationship between UYS and strain rate, is observed. Fitting a power law to the
simulation data, a power index of 1.2 is obtained. A power index of less than two suggests that
the pressure originated in the system is not exclusively due to a kinetic contribution as observed
in the case of rapid granular flows, but due to the influence of the interparticle friction. This
behaviour is typical of systems with high values of packing fraction and corresponds to an
intermediate regime between quasi-static and rapid granular flow as suggested by Tardos et al.
[15]. This is discussed further below.
3.3. Compression of the assembly
It is well known that the flowability of powders depends on the pre-consolidating load [3]. In
order to study the effect of the pre-consolidating stress on the unconfined yield stress, the system
with the value of surface energy of 1.0 J/m2 was compressed to higher levels of stress than tested
above. The top platen was moved at a constant velocity of 0.01 m/s until a pre-specified value of
pressure was reached. At this stage of compression, the material might accumulates large
residual stresses. Therefore, before measuring the unconfined yield stress for different values of
pre-consolidation stress it is necessary to allow the system to relax before carrying out further
test using the assemblies.
Figure 3 shows the top platen stress and the number of interparticle contacts in the assembly as a
a sharp increase in the platen stress is observed without a significant change in the strain. With
the increase in compression, the number of interparticle contacts decreases very slightly.
However, the increase in strain produces a gradual increase in the platen stress albeit
accompanied by stress fluctuations. Furthermore, as the assembly is compressed sudden drops in
the platen force are observed. This is accompanied simultaneously by drops in the number of
contacts. In some cases, the number of interparticle contacts is reduced by nearly 50%. These
sharp drops might be due to the reorganisation of the force networks during the compression [6].
For different values of compression forces, the assembly was subjected to a relaxation process,
with the objective of decreasing residual stresses and obtaining an equilibrium force network.
This relaxation process was carried out by keeping the distance between the platens and the side
boundary conditions constant and continuing cycling the simulation. This process produces a
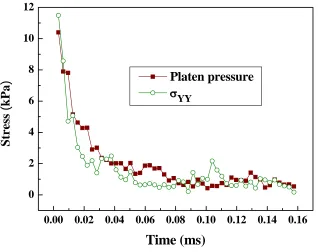
relaxation of the internal stresses by rearrangement of particles. As an example
Fig. 4 shows a typical relaxation curve of the stresses. The stresses correspond to the platen
pressure and the yy component of the stress tensor of the assembly. The similarity between the
yy component of the stress tensor and the platen pressure suggests that both can be used
indistinctively in order to measure the state of stress of the system. However, this may not be
true in all cases since the stress tensor is a measure of the stress in the whole assembly and the
platen stress is the stress on the surface of the material. In cases of high compressive strain rate,
the stress in the boundary might not have enough time to propagate inside the assembly and both
parameters could give significantly different values.
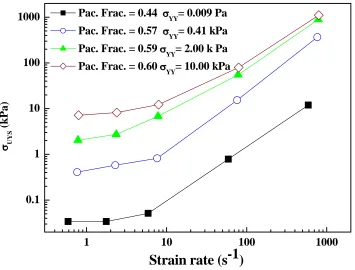
Several assemblies at different values of pre-consolidating stress have been obtained and
analysed to investigate the effect of the pre-consolidating stress on the unconfined yield stress.
stress σYY as a function of the strain rate. The larger the pre-consolidating stress the larger the
unconfined yield stress as intuitively expected. The quasi-static regime is observable at all
pre-consolidating stresses. In the intermediate regime, the strain rate sensitivity (i.e. the slope of the
lines) seems to decrease as the pre-consolidating stress is increased.
In Fig. 6 the UYS for the quasi-static regime is plotted as a function of the pre-consolidating
stress for the assembly with = 1.0 J/m2. This curve is known as the flow function as initially
introduced by Jenike and measured using the Jenike shear cell [1]. The relationship between
UYS and pre-consolidating stress seems to follow a linear relationship with a slope of
approximately 0.8. The flow factor, ff, as defined by Jenike[2] is the inverse of the slope of this
line according to the expression:
1 YY UYS ff − ⎟⎟ ⎠ ⎞ ⎜⎜ ⎝ ⎛ = σ σ (6)
The above approach in obtaining the flow factor differs from the method based on using the
major principle stress at the steady state flow measure by a shear cell. The differences have been
highlighted by Schwedes [3].
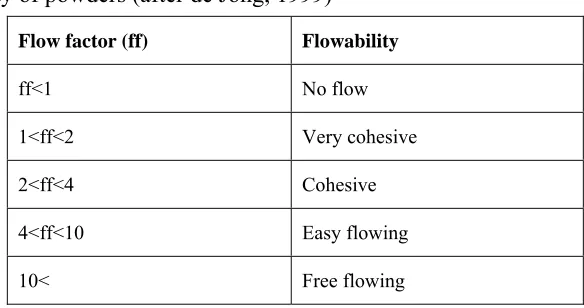
The flow factor in this case is 1.25. This number was compared with published data by de Jong
[16] who classified the flowability of powders according to their cohesivity as given in Table 4.
For flow factors between 1 and 2 the powders are very cohesive. This comparison shows a
4. DISCUSSION
The determination of the unconfined yield stress in the uniaxial test is more straightforward than
using Jenike or Schulze shear testers. Furthermore, the direction of the principal stresses does
not change if the confining walls are frictionless and therefore the major consolidation stress is
easily known. However, the unconfined yield stress as determined by the uniaxial test should be
lower than the unconfined yield stress as provided by a direct shear tester when the sample is
subjected to pre-shearing. The reason for this, as explained by Schwedes [3], is that during
uniaxial consolidation because the bulk density for the same pre-consolidation stress is smaller
the sample does not reach the steady state flow.
The flow factor obtained from the simulation data has been compared in Table 4 with the
literature data provided by de Jong [16] in which a relationship between the flowability of
powders and flow factor is given. The comparison suggests that the Distinct Element Method
provides a qualitatively reasonable agreement with the flow behaviour of real powders.
Tardos et al. [15] recently presented trends of variations of shear stress as a function of strain
rate obtained in a Couette type device for glass beads. They observed three regimes, slow
(corresponding to quasi-static regime), fast (corresponding to rapid granular flow) for which the
power index is 2 and an intermediate regime in which the power index varies from 0 to 2. The
simulations reported here and the experimental work of Tardos et al. [15] are obviously different
in the way they were carried out. Nevertheless, the power index of 1.2 obtained in this work
falls within the intermediate range of Tardos’s correlation. The highest value of strain rate used
in the simulations is 1000 s-1. This is larger than the upper limit of the intermediate regime.
However, there are a number of other factors which strongly influence the simulation and an
are discussed below and clearly show the need for further investigations of shearing flows in
which the effects of interparticle adhesion and interstitial drag are important.
In the present study the effect of plastic deformation and air drag have not been considered.
These factors might impose a limit on the interpretation of the curve of unconfined yield stress
versus strain rate for large values of strain rate. For the case of pre-consolidation stress of
10 kPa and strain rate of 100 s-1, the largest interparticle contact stress is 80 MPa. Since the yield
strength of glass beads is in the order of 0.1-1 GPa the influence of yield strength on the UYS is
only significant for the largest values of strain rate and pre-consolidation stress shown in Fig. 5.
The influence of air drag on the behaviour of the particles is expected to be appreciable at high
strain rates. There is, however, little work in the literature on this topic. The simulations here
are not expected to be significantly affected in the lower end of the transition between
quasi-static and intermediate regimes because of the relatively low particle velocity relative to
surrounding air. However, further work at high strain rate is needed to clarify the boundaries
where air drag becomes important.
It is also important to highlight the influence of the surface energy on the unconfined yield stress.
An increase of one order of magnitude of the surface energy leads to a similar increase in the
UYS. We also observe that the variation of the UYS with strain rate for the intermediate regime
follows the same relationship for both values of surface energy for which a power law index of
1.2 is obtained. This trend requires a more in-depth analysis especially on the dissipative
5. CONCLUSIONS
The procedure for the determination of the unconfined yield stress from a uniaxial compression
test has been simulated using Distinct Element Method. The effects of strain rate and surface
energy have been quantified. An increase of one order of magnitude of the surface energy
produced a similar increase in the unconfined yield stress.
The unconfined yield stress increases linearly with stress in agreement with the behaviour of
some typical materials. However, the increase in the pre-consolidating stress has also produced
a change of the slope of UYS versus strain rate. The exact reasons for this trend are unclear at
present and further investigations are needed to address the various mechanisms of energy
dissipation.
The flowability of the particles has been determined by using the flow factor, which has been
obtained from the relationship between the unconfined yield stress and pre-consolidated stress.
There is a qualitative agreement in the trend for the flow factor obtained in this work and the
literature data. Further investigations are required to elucidate the role of plastic deformation
characteristics and air effects on the UYS of particulate assemblies.
NOMENCLATURE
a Contact area radius m
E Particle elastic modulus N/m2
FOFF Pull-off force N
G Shear modulus N/m2
M Number of particles in the system -
N Normal load in a contact N
n Unitary normal vector in a contact -
R Particle radius m
T Tangential contact force N
V Volume of the assembly m3
t Unitary tangential vector in a contact -
γ Surface energy J/m2
ν Poisson’s ratio -
σij Components of the stress tensor N/m 2
σUYS Unconfined yield stress N/m
2
ACKNOWLEDGMENTS
The work reported here is part of an ongoing project supported by British Nuclear Fuels Ltd.
The authors would like to thank Mr A. Milliken, and Drs D. Rhodes and D. Goddard for their
helpful comments and co-ordination of the project.
6 REFERENCES
[1] A. W. Jenike, P. J. Elsey, R. H. Woolley, American Society for testing materials, 60 (1960)
[3] J. Schwedes, Granular Matter, 5 (2003) 1-43.
[4] H. J. Feise, Powder Technology, 98 (1998) 191-200.
[5] C. Thornton, and S. J. Antony, Phil. Trans. R. Soc. London. A. 356 (1998) 2763-2782.
[6] S. J. Antony, 109, Physical Review E, 63, 1 (2001) 011302.
[7] C. Thornton, and L. Zhang, Chemical Engineering and Technology, 26 (2003) 153-156.
[8] T. Gröger, U. Tüzün, and D. M. Heyes, Powder Technology, 133 (2003) 203-215.
[9] R. Moreno, S. J. Antony and M. Ghadiri, PARTEC, Nuremberg 2004, 29.5.
[10] C. Thornton and C. W. Randall, in M. Satake and J.T. Jenkins (eds), Micromechanics of
Granular Materials, Elsevier, Amsterdam, 1988, 133-142.
[11] C. Thornton and K. K. Yin, Powder Technology, 65 (1991) 153-166.
[12] K. L. Johnson, K. Kendall, and A. D. Roberts, Proceedings of the Royal Society of London
A., 324 (1971) 301-313.
[13] A. R. Savkoor, G. A. D. Briggs, Proceedings of the Royal Society of London, A., 356
[14] M. Satake, IUTAM Conference in Deformation and Failure of granular Materials, Delft,
Netherlands. 31 August- 3 Sept. (1982).
[15] G. I. Tardos, S. McNamara, I. Talu, Powder Technology, 131 (2003) 23-39.
Table 1. Particle properties (corresponding to glass beads) used in the simulations.
Elastic modulus (GPa) 70
Poisson ratio 0.3
Friction coefficient 0.3
Table 2. Particle size distribution
Particle No. Size ( m)
5 312.0
23 177.0
276 146.0
671 125.4
955 103.2
756 86.2
385 72.0
Table 3. Properties of the agglomerates
Surface Energy (J/m2) Packing Fraction Contacts σxx (Pa) σyy (Pa) σzz (Pa)
1.0 0.44 6640 3.88 9.06 11.7
Table 4. Flowability of powders (after de Jong, 1999)
Flow factor (ff) Flowability
ff<1 No flow
1<ff<2 Very cohesive
2<ff<4 Cohesive
4<ff<10 Easy flowing
Elastic boundary Compression
Free boundary
Elastic boundary
y
x
z
[image:24.595.71.489.209.413.2]0.1 1 10 100 1000 10000 1E-3
0.01 0.1 1 10 100
σ UYS
(kPa)
Strain rate (s-1) 1.0 J/m2
0.1 J/m2 y=ax1.2
[image:25.595.162.423.169.365.2]ig. 3. Evolution of the platen pressure and contact number during confined compression
0.00 0.05 0.10 0.15 0.20 0.25
0.00 0.02 0.04 0.06 0.08 0.10 0.12 0.14 0.16 0
2 4 6 8 10 12
Stress
(
kPa
)
Time (ms)
Platen pressure σ
YY
[image:27.595.130.448.117.369.2]1 10 100 1000 0.1
1 10 100 1000
σ UY
S
(k
Pa)
Strain rate (s-1)
Pac. Frac. = 0.44 YY= 0.009 Pa
Pac. Frac. = 0.57 σ
YY= 0.41 kPa
Pac. Frac. = 0.59 σYY= 2.00 k Pa
[image:28.595.97.452.237.507.2]Pac. Frac. = 0.60 σYY= 10.00 kPa
0 2 4 6 8 10 0
2 4 6 8 10
Simulation
0.8
σyyσ UYS
(kPa
)
[image:29.595.138.438.214.458.2]Preconsolidated stress (kPa)