Puppis
.
White Rose Research Online URL for this paper:
http://eprints.whiterose.ac.uk/144866/
Version: Published Version
Article:
Thoroughgood, T.D., Dhillon, V.S. orcid.org/0000-0003-4236-9642, Steeghs, D. et al. (7
more authors) (2005) The component masses of the cataclysmic variable V347 Puppis.
Monthly Notices of the Royal Astronomical Society, 357 (3). pp. 881-894. ISSN 0035-8711
https://doi.org/10.1111/j.1365-2966.2004.08613.x
This article has been accepted for publication in Monthly Notices of the Royal Astronomical
Society ©2005 RAS. Published by Oxford University Press on behalf of the Royal
Astronomical Society. All rights reserved.
[email protected]
https://eprints.whiterose.ac.uk/
Reuse
Items deposited in White Rose Research Online are protected by copyright, with all rights reserved unless
indicated otherwise. They may be downloaded and/or printed for private study, or other acts as permitted by
national copyright laws. The publisher or other rights holders may allow further reproduction and re-use of
the full text version. This is indicated by the licence information on the White Rose Research Online record
for the item.
Takedown
If you consider content in White Rose Research Online to be in breach of UK law, please notify us by
The component masses of the cataclysmic variable V347 Puppis
T. D. Thoroughgood,
1⋆
V. S. Dhillon,
1D. Steeghs,
2C. A. Watson,
1D. A. H. Buckley,
3S. P. Littlefair,
4D. A. Smith,
1,5M. Still,
6†
K. J. van der Heyden
3and B. Warner
71Department of Physics and Astronomy, University of Sheffield, Sheffield S3 7RH
2Harvard-Smithsonian Center for Astrophysics, 60 Garden Street, MS-67, Cambridge, MA 02138, USA
3South African Astronomical Observatory, PO Box 9, Observatory 7935, Cape Town, South Africa
4School of Physics, University of Exeter, Stocker Road, Exeter EX4 4QL
5Winchester College, College Street, Winchester SO23 9LX
6NASA /Goddard Space Flight Center, Code 662, Greenbelt, MD 20771, USA
7Department of Astronomy, University of Cape Town, Private Bag, Rondebosch 7700, South Africa
Accepted 2004 November 5. Received 2004 September 17; in original form 2004 June 19
A B S T R A C T
We present time-resolved spectroscopy and photometry of the double-lined eclipsing cata-clysmic variable V347 Pup (=LB 1800). There is evidence of irradiation on the inner hemi-sphere of the secondary star, which we correct for using a model to give a secondary-star radial velocity ofKR=198±5 km s−1. The rotational velocity of the secondary star in V347 Pup is found to bevsin i=131±5 km s−1and the system inclination isi =84◦.0±2◦.3. From these parameters we obtain masses ofM1=0.63±0.04 M⊙for the white dwarf primary and M2=0.52±0.06 M⊙for the M0.5V secondary star, giving a mass ratio ofq=0.83±0.05. On the basis of the component masses, and the spectral type and radius of the secondary star in V347 Pup, we find tentative evidence for an evolved companion. V347 Pup shows many of the characteristics of the SW Sex stars, exhibiting single-peaked emission lines, high-velocity S-wave components and phase-offsets in the radial velocity curve. We find spiral arms in the accretion disc of V347 Pup and measure the disc radius to be close to the maximum allowed in a pressureless disc.
Key words:accretion, accretion discs – binaries: eclipsing – binaries: spectroscopic – stars:
individual: V347 Pup – novae, cataclysmic variables.
1 I N T R O D U C T I O N
Cataclysmic variables (CVs) are close binary stars consisting of a red dwarf secondary transferring material on to a white dwarf primary via an accretion disc or magnetic accretion stream. V347 Pup is an example of a nova-like variable (NL), a class of CV with high mass transfer rates and no recorded nova or dwarf-nova type outbursts; see Warner (1995a) for a comprehensive review of CVs. A knowledge of the masses of the component stars in CVs is fundamental to our understanding of the origin, evolution and be-haviour of these systems. Population synthesis models (e.g. Kolb, King & Baraffe 2001) and the disrupted magnetic braking model of CV evolution (e.g. Rappaport, Verbunt & Joss 1983; Spruit & Ritter 1983) can be observationally tested only if the number of re-liably known CV masses increases. One of the most reliable ways to measure the masses of CVs is to use the radial velocity and the rotational broadening of the secondary star in eclipsing systems. The radial velocity of the disc emission lines is often an unreliable
⋆E-mail: [email protected] †Also Universities Space Research Association.
indicator of the white dwarf motion because of contamination from, for example, the bright spot. At present, reliable masses are known
for only∼20 CVs, partly due to the difficulties in measurement (see
Smith & Dhillon 1998, for a review).
V347 Pup was identified spectroscopically as a NL by Buckley et al. (1990) from the presence of high-excitation emission lines.
Even though V347 Pup emits at X-ray wavelengths (as theUhuru
X-ray source 4U 0608–49), the NL classification was favoured over a magnetic CV class on account of the negligible polarization present. The study by Buckley et al. (1990) revealed a bright and deeply eclipsing system, with a spectroscopic and photometric orbital pe-riod of 5.57 h. Their measured system inclination and emission-line radial velocity curve, together with an empirical secondary-star mass estimated from the orbital period, suggested a high primary mass close to the Chandrasekhar limit.
A multiwavelength study by Mauche et al. (1994) revealed an X-ray spectral energy distribution similar to many dwarf novae in outburst, with a likely origin in an extended emission region rather than the boundary layer. The UV emission lines appear to have a similar origin and, in a later paper by Shlosman, Vitello & Mauche (1996), their behaviour in eclipse was successfully modelled as disc
D
o
w
n
lo
a
d
e
d
fro
m
h
ttp
s:
//a
ca
d
e
mi
c.
o
u
p
.co
m/
mn
ra
s/
a
rt
icl
e
-a
b
st
ra
ct
/3
5
7
/3
/8
8
1
/1
0
7
7
8
2
5
b
y
U
n
ive
rsi
ty
o
f S
h
e
ffi
e
ld
u
se
r
o
n
1
1
A
p
ri
l 2
0
1
light scattered in a rotating wind. The presence of an accretion disc in V347 Pup was confirmed by a rotational disturbance of the op-tical emission lines through primary eclipse (Mauche et al. 1994; Still, Buckley & Garlick 1998). The latter authors found evidence for spiral arms and disc overflow accretion, and identified the low-excitation optical emission profiles as a composite of emission from the accretion disc and secondary star.
Secondary-star absorption lines were found by Diaz & Hubeny (1999), who measured the system parameters of V347 Pup using the radial velocity semi-amplitudes of the primary and secondary stars. The radial velocity of the optical emission lines in V347 Pup varies
widely in the literature, with published values of 134±9 km s−1
(Buckley et al. 1990), 122±19 km s−1(Mauche et al. 1994), 156±
10 km s−1, 125±13 km s−1(Still et al. 1998) and 193±16 km s−1
(Diaz & Hubeny 1999). The radial velocities of the UV emission lines published by Mauche et al. (1994) ranged between 220 and
370 km s−1with large phase shifts between spectroscopic
conjunc-tion and photometric mid-eclipse. This wide range in values, and the known unreliability of using disc emission lines in NLs to determine the motion of the white dwarf (e.g. Dhillon, Marsh & Jones 1997), makes the determination of system parameters from the secondary-star features alone highly desirable. In this paper, we derive the system parameters from the radial and rotational velocities of the secondary star in V347 Pup.
2 O B S E RVAT I O N S A N D R E D U C T I O N
During 1998 January and December and 1999 January, we obtained
optical spectra of V347 Pup using the Cassegrain spectrograph+
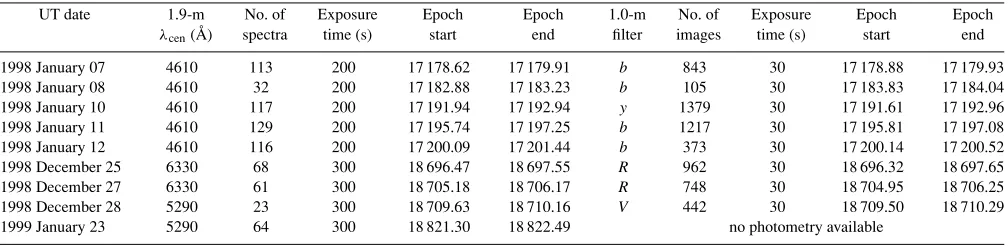
SITe1 CCD chip on the South African Astronomical Observatory (SAAO) 1.9-m telescope. Simultaneous photometry was available for most of the spectra using the SAAO 1.0-m telescope with the TEK8 CCD chip. See Table 1 and its caption for full details.
On the 1998 December run, we observed 17 spectral type tem-plates ranging from G7V to M5.5V and telluric stars to remove atmospheric features. We observed flux standards on both the 1.9-m and 1.0-m telescopes on all nights.
The spectra and images were reduced using standard proce-dures (e.g. Dhillon, Jones & Marsh 1994; Thoroughgood et al. 2001). The photometry data were corrected for the effects of atmo-spheric extinction by subtracting the magnitude of a nearby com-parison star. The absolute photometry is accurate to approximately
[image:3.612.53.557.618.741.2]±0.5 mJy; the relative photometry to ±0.01 mag. Comparison
Table 1. Journal of observations. During 1998 January, we used Grating No. 4 to give a wavelength range of∼4200–5060 Å (λcen =4610) at 0.99-Å (64 km s−1) resolution. Grating No. 4 was again used on 1998 December 28 and 1999 January 23 to give a wavelength range of∼4900–5720 Å (λcen=5290) at 0.95-Å (54 km s−1) resolution. On 1998 December 25 and 27, we used Grating No. 5 to give a wavelength range of∼5960–6725 Å (λcen=6330) at 0.88-Å (42 km s−1) resolution. Simultaneous photometry for the 1998 December spectra was recorded in the Johnson–CousinsV- andR-bands. Photometry was also available during the 1998 January run in the Str¨omgrenbandyfilters. The seeing measured around 1.0 arcsec with photometric conditions on 1998 December 25 and 27 and 1999 January 23. On 1998 December 28, however, the seeing was poor and patchy high cloud was present. The seeing varied between 1.0 and 1.5 arcsec over the 1998 January run. The epochs are calculated using the new ephemeris presented in this paper (equation 1).
UT date 1.9-m No. of Exposure Epoch Epoch 1.0-m No. of Exposure Epoch Epoch
λcen(Å) spectra time (s) start end filter images time (s) start end
1998 January 07 4610 113 200 17 178.62 17 179.91 b 843 30 17 178.88 17 179.93
1998 January 08 4610 32 200 17 182.88 17 183.23 b 105 30 17 183.83 17 184.04
1998 January 10 4610 117 200 17 191.94 17 192.94 y 1379 30 17 191.61 17 192.96
1998 January 11 4610 129 200 17 195.74 17 197.25 b 1217 30 17 195.81 17 197.08
1998 January 12 4610 116 200 17 200.09 17 201.44 b 373 30 17 200.14 17 200.52
1998 December 25 6330 68 300 18 696.47 18 697.55 R 962 30 18 696.32 18 697.65
1998 December 27 6330 61 300 18 705.18 18 706.17 R 748 30 18 704.95 18 706.25
1998 December 28 5290 23 300 18 709.63 18 710.16 V 442 30 18 709.50 18 710.29
1999 January 23 5290 64 300 18 821.30 18 822.49 no photometry available
arc spectra were taken every∼40 min in order to calibrate the
wavelength scale and instrumental flexure. The arcs were fitted with fourth-order polynomials with an rms scatter of better than 0.04 Å. Where possible, slit losses were then corrected for by mul-tiplying each V347 Pup spectrum by the ratio of the flux in the spectrum (over the whole spectral range) to the corresponding pho-tometric flux.
3 R E S U LT S
3.1 Ephemeris
The times of mid-eclipse for V347 Pup were determined by fitting a parabola to the eclipse minima in the photometry data. A least-squares fit to the 21 eclipse timings listed in Table 2 yields the ephemeris:
Tmid-eclipse=HJD 244 6836.961 76+0.231 936 060E
± 0.000 09±0.000 000 006 (1)
Our new ephemeris is exactly the same as that given by Baptista & Cieslinski (1991), except we have reduced the errors on both the zero point and orbital period. We find no evidence for any systematic variation in the O–C values listed in Table 2.
3.2 Average spectrum
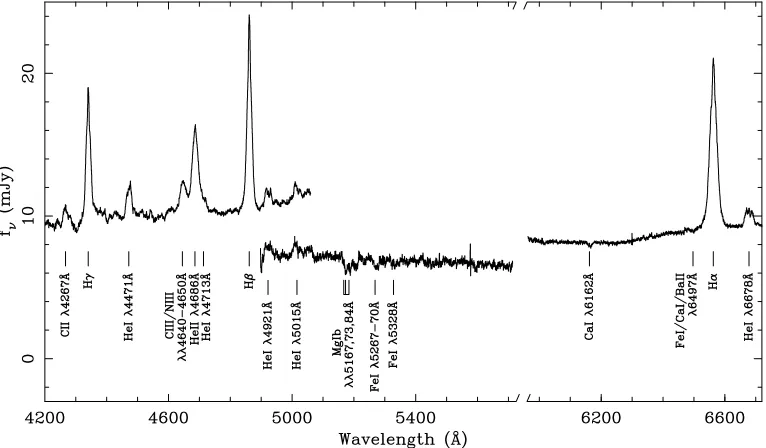
The average spectra of V347 Pup, uncorrected for orbital motion, are shown in Fig. 1. In Table 3, we list fluxes, equivalent widths (EWs) and velocity widths of the most prominent lines measured from the average spectra.
The Balmer emission lines are broad, symmetric and single-peaked, instead of the double-peaked profile one would expect from a high-inclination accretion disc (e.g. Horne & Marsh 1986). This behaviour is characteristic of the SW Sex stars (e.g. Dhillon et al. 1997). Previous studies of V347 Pup by Buckley et al. (1990) and Diaz & Hubeny (1999) agree with this single-peaked observa-tion; however, the study by Still et al. (1998) shows double-peaked low-excitation lines (although this could be due to the presence of
absorption cores). The HeI λ6678 line appears to be composed
of a narrow single-peaked component superimposed upon a broad
double-peaked component. The other HeIemission lines can clearly
be seen in the wavelength region centred onλ4610 as double peaked
in nature, with the possible exception of HeIλ4471. High-excitation
D
o
w
n
lo
a
d
e
d
fro
m
h
ttp
s:
//a
ca
d
e
mi
c.
o
u
p
.co
m/
mn
ra
s/
a
rt
icl
e
-a
b
st
ra
ct
/3
5
7
/3
/8
8
1
/1
0
7
7
8
2
5
b
y
U
n
ive
rsi
ty
o
f S
h
e
ffi
e
ld
u
se
r
o
n
1
1
A
p
ri
l 2
0
1
Table 2. Times of mid-eclipse for V347 Pup according to Buckley et al. (1990; B90), Baptista & Cieslinski (1991; BC91) and this paper.
Cycle HJD Uncertainty O–C Reference
(E) at mid-eclipse on HJD (s) (2400 000+)
−4 46 836.0379 5×10⁻⁴ 335.96 B90 0 46 836.9621 5×10⁻⁴ 29.74 B90 39 46 846.0059 5×10⁻⁴ −117.69 B90 43 46 846.9333 5×10⁻⁴ −147.43 B90 48 46 848.0930 5×10⁻⁴ −145.73 B90 56 46 849.9500 5×10⁻⁴ −15.13 B90 65 46 852.0373 5×10⁻⁴ −25.89 B90 69 46 852.9651 5×10⁻⁴ −21.08 B90 78 46 855.0533 5×10⁻⁴ 45.92 B90 6177 48 269.631 36 1.5×10⁻⁴ 48.28 BC91 7583 48 595.733 25 1.1×10⁻⁴ 30.04 BC91 7587 48 596.660 22 9×10⁻⁵ −36.85 BC91 17 179 50 821.391 99 5×10⁻⁴ 56.29 This paper 17 184 50 822.551 27 5×10⁻⁴ 21.70 This paper 17 192 50 824.406 76 5×10⁻⁴ 21.83 This paper 17 196 50 825.334 28 5×10⁻⁴ 2.46 This paper 17 197 50 825.566 11 5×10⁻⁴ −6.70 This paper 18 697 51 173.470 35 1×10⁻⁴ 6.20 This paper 18 705 51 175.325 62 1×10⁻⁴ −12.68 This paper 18 706 51 175.558 02 1×10⁻⁴ 26.54 This paper 18 710 51 176.485 19 1×10⁻⁴ −22.21 This paper
emission is present through HeIλ4686 and the CIII/NIIIλλ4640–
4650 Bowen fluorescence complex.
The secondary star is clearly visible in the average spectra as
absorption lines of the neutral metals CaI, FeIand MgI, as seen in
[image:4.612.117.500.460.684.2]Diaz & Hubeny (1999). Secondary-star features in the SW Sex stars are not unusual in the longer period systems, such as BT Mon (Smith, Dhillon & Marsh 1998), AC Cnc and V363 Aur (Thoroughgood et al. 2004).
Figure 1. The average spectra for the three wavelength regions; the spectrum centred onλ4610 is an average of all spectra recorded on the 1998 January run, and has not been corrected for slit-losses. The spectrum centred onλ5290 is an average of all data recorded on 1998 December 28 and 1999 January 23, placed on an absolute flux scale (as determined from the 1998 December 28 photometry and flux standards). The spectrum centred onλ6330 is composed of all data from 1998 December 25 and 27 and has been placed on an absolute flux scale. All average spectra are uncorrected for orbital motion, resulting in smeared spectral features.
3.3 Light curves
Fig. 2 shows the broad-band and emission-line light curves of V347 Pup. The emission-line light curves were produced by subtracting a polynomial fit to the continuum and summing the residual flux. All light curves are plotted as a function of phase following the ephemeris derived in Section 3.1.
Theb-,y-,V- andR-band light curves show deep, asymmetrical
primary eclipses with the egress lasting longer than ingress. Flicker-ing is present in all light curves, as well as an increase in brightness
approaching eclipse in theb-,y- andV-bands. Theb- andy-band
data recorded in 1998 January show no significant brightness
vari-ations during the run, with out-of-eclipse magnitudes of 13.3±0.1
in both filters. The eclipse depths are 3.2 and 2.6 mag, respectively.
We measureR-band out-of-eclipse magnitudes of 14.00±0.05 mag
on December 25, increasing in brightness to 13.45±0.10 mag on
December 27. The eclipse depth remains roughly the same at 2.1
mag and 2.0 mag, respectively. In theV-band, the out-of-eclipse
magnitude is 14.10±0.10 mag, with an eclipse depth of 2.6 mag.
Photometric out-of-eclipse magnitudes in the literature range
be-tween 13.05 and 13.28 inR, and 13.2 and 13.58 inV (Buckley
et al. 1990; Mauche et al. 1994), suggesting that our observations in 1998 December find V347 Pup around 0.5–1 mag fainter. Long-term variations in the magnitudes of NLs are not uncommon (e.g. Honeycutt 2001) and have been observed in other SW Sex stars (e.g. BH Lyn, Dhillon et al. 1992; DW UMa, Dhillon et al. 1994; PX And, Still, Dhillon & Jones 1995). Low states are often accom-panied by the weakening or disappearance of the high-excitation
HeIIand CIII/NIIIlines, which were unfortunately not observed
in 1998 December. There is, however, a change in the HeIλ6678
Doppler maps between the observations on the two nights, which is considered in Section 3.4. Further evidence that V347 Pup exhibits changes of state is seen in the equivalent widths of the emission lines
between the observed epochs. For example, the EW of Hβvaries
between 17.0± 0.6 Å (1986 July, Buckley et al. 1990), 62.6±
1.9 Å (1991 April, Mauche et al. 1994), 9.8±0.1 Å (1995 January,
D
o
w
n
lo
a
d
e
d
fro
m
h
ttp
s:
//a
ca
d
e
mi
c.
o
u
p
.co
m/
mn
ra
s/
a
rt
icl
e
-a
b
st
ra
ct
/3
5
7
/3
/8
8
1
/1
0
7
7
8
2
5
b
y
U
n
ive
rsi
ty
o
f S
h
e
ffi
e
ld
u
se
r
o
n
1
1
A
p
ri
l 2
0
1
Table 3. Fluxes and widths of prominent lines in V347 Pup, measured from the data from the two nights centred onλ6330 Å and the night of 1998 January 11 centred onλ4610 Å. The full-width half-maximum (FWHM) velocities were determined from Gaussian fits, whereas the full-width zero-intensity (FWZI) velocities and their errors have been estimated by eye. HeIIλ4686, CIII/NIIIλλ4640–4650 and HeIλ4713 are blended, so separate values of the flux and EW are given (determined from a triple-Gaussian fit) as well as the combined flux of the three.
Line Date Flux EW FWHM FWZI
(×10−14 (Å) (km s−1) (km s−1) (ergs cm−2 s−1)
Hα 1998 December 25 16.80±0.04 35.1±0.1 1100±100 3500±300
Hα 1998 December 27 27.98±0.05 36.4±0.1 1100±100 3600±300
Hβ 1998 January 11 42.2±0.1 24.6±0.2 1000±100 2800±300
Hγ 1998 January 11 34.6±0.2 16.9±0.3 1100±100 2600±800
HeIλ4471 1998 January 11 8.0±0.1 3.8±0.2 1150±100 1850±200
HeIλ4921 1998 January 11 4.23±0.08 2.6±0.1 1300±100 2000±200
HeIλ5015 1998 January 11 3.3±0.1 2.2±0.2 1250±100 2000±200
HeIλ6678 1998 December 25 1.49±0.02 2.92±0.08 1250±100 1900±200 HeIλ6678 1998 December 27 2.40±0.04 3.00±0.08 1300±100 1900±200
CIIλ4267 1998 January 11 3.8±0.1 1.7±0.4 900±200 1800±600
HeIIλ4686 1998 January 11 26.9±0.3 13.1±0.3 1450±150 CIII/NIIIλλ4640–4650 1998 January 11 11.7±0.1 6.4±0.2 1700±150
HeIλ4713 1998 January 11 4.8±0.3 2.3±0.3 1500±300
HeII+CIII/NIII+ 1998 January 11 45.5±0.2 22.4±0.2 HeIλ4713
Still et al. 1998) and 24.6±0.2 Å (1998 January, this paper),
al-though the high-excitation CIII/NIIIcomplex has a constant EW
between epochs.
We measured the phase half-width of eclipse at the out-of-eclipse
level (φ) by timing the first and last contacts of the eclipse and
dividing by 2. Our average value ofφ=0.110±0.005 is
con-sistent with the values of 0.120±0.011 quoted by Harrop-Allin
& Warner (1996) and 0.105±0.005 measured by Buckley et al.
(1990). We then computed the radius of the accretion disc in V347 Pup using the geometric method outlined in Dhillon, Marsh & Jones
(1991). Combiningφwith the system mass ratio and inclination
derived in Section 3.10 gives an accretion disc radius (RD) of 0.72±
0.09R1, whereR1is the volume radius of the Roche lobe of the
pri-mary. This value is in agreement with the value ofRD/R10.82
quoted by Harrop-Allin & Warner (1996) at the 2σlevel.
The Hαeclipses are similar in shape to the continuum light curves,
but do not appear to be as deeply eclipsed. The Hβand Hγ lines
exhibit asymmetric eclipses, with ingress longer than egress. This behaviour is expected from asymmetric disc emission, consistent with the spiral arms identified in the Doppler maps (Section 3.4).
The high-excitation HeII+CIII/NIIIcomplex has a deep and
U-shaped eclipse, suggesting an origin close to the white dwarf. The
HeIeclipses are wide with V-shaped minima, similar to the SW Sex
stars (e.g. Knigge et al. 2000). Note that the HeIflux is completely
eclipsed, indicating an origin in the central portion of the disc, and not in an extended emission region which is larger than the secondary
star. The HeIλ4471 emission line shows a broad dip in flux around
phase 0.4, before climbing to reach a maximum around phase 0.75, which could be a further signature of the disc asymmetry.
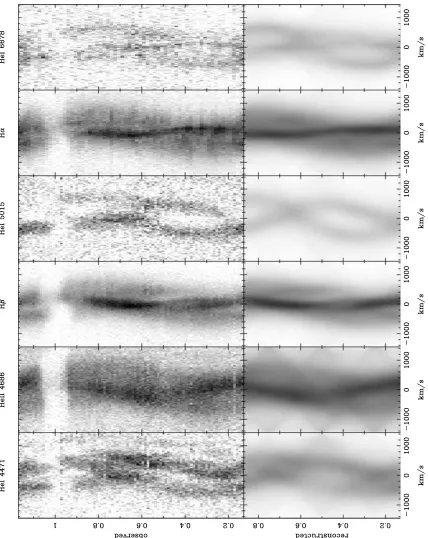
3.4 Trailed spectrum and Doppler tomography
We subtracted polynomial fits to the continuum and then rebinned the spectra on to a constant velocity-interval scale centred on the rest wavelength of the principal emission lines. For the data obtained in 1998 January, we phase-binned all the spectra in order to boost
the signal-to-noise ratio (S/N). Individual spectra were weighted
according to their S/N in order to combine the spectra optimally.
The trailed spectra of Hα, Hβ, HeIIλ4686 and HeIλλ4471, 5015,
6678 are shown in Fig. 3. Doppler maps were calculated for the principal emission lines using the modulation Doppler tomography code of Steeghs (2003). This method is an extension to the con-ventional Doppler tomography technique (e.g. Marsh 2001), and maps both the constant and variable part of the line emission using a maximum-entropy regularized fitting procedure (Skilling & Bryan 1984). We found that the modulated contribution to the line
emis-sion was weak (<1 per cent), and thus our S/N was not sufficient
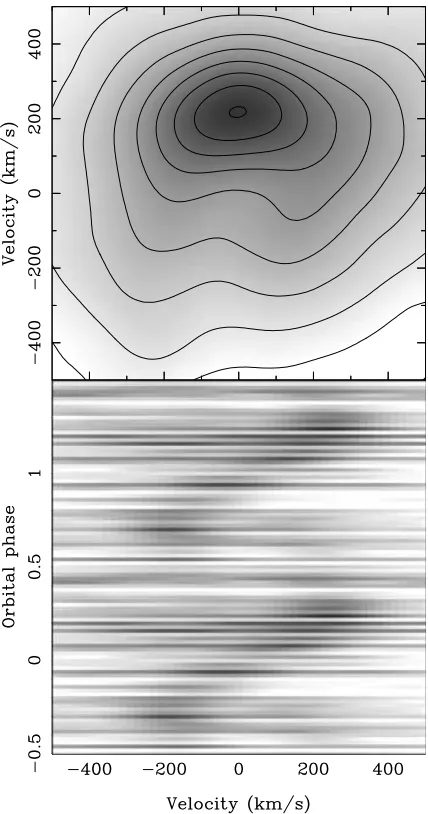
to detect significant modulation in the accretion disc emission. We therefore plot in Fig. 4 the corresponding average Doppler maps only. The reconstructed line profiles are plotted next to the observed ones in Fig. 3 for comparison. Good fits to the data were achieved
in all cases (reducedχ2=1–1.4)
The Balmer-line trailed spectra are dominated by a low-velocity
component with a semi-amplitude of∼150 km s−1, moving from
blue to red across primary eclipse. This is consistent with emission from the irradiated inner face of the secondary star, which is clearly
seen in the corresponding Doppler maps. In the Hβmap, a
sec-ond low-velocity emission source is present, seemingly coincident
with the gas stream at a distance of 0.9L1, whereL1is the distance
from the white dwarf to the inner Lagrangian point. There is also a
weak two-armed disc asymmetry visible in the Hβemission, which
is much more prominent in the double-peaked HeIemission lines.
Doppler maps of V347 Pup have been produced by Still et al. (1998) for data sets recorded in 1987, 1988 and 1995. The two components described above from the secondary star and the disc are clearly
visible in their maps. The summed Hβand Hγ maps of Still et al.
(1998) show a stronger disc emission and spiral structure than our Balmer-line maps. The disc asymmetry is significant and is remi-niscent of the two-armed spiral structures that have been observed in the discs of dwarf novae during outburst (e.g. Steeghs 2001). We
return to these in Section 4.1. The high-excitation HeIIλ4686 line
is dominated by emission from the gas stream and bright spot
over-layed on a weak accretion disc with radiusRD∼0.3–0.4L1. Note
that the HeIIλ4686 Doppler map shows emission at higher
veloc-ities than the low-excitation lines, demonstrating that the material originates from closer to the white dwarf.
D
o
w
n
lo
a
d
e
d
fro
m
h
ttp
s:
//a
ca
d
e
mi
c.
o
u
p
.co
m/
mn
ra
s/
a
rt
icl
e
-a
b
st
ra
ct
/3
5
7
/3
/8
8
1
/1
0
7
7
8
2
5
b
y
U
n
ive
rsi
ty
o
f S
h
e
ffi
e
ld
u
se
r
o
n
1
1
A
p
ri
l 2
0
1
(a)
[image:6.612.104.515.64.612.2](b)
Figure 2. Broad-band and emission-line light curves of V347 Pup recorded in 1998 December and 1999 January (a), and 1998 January (b); see the panel labels for details. Note the increase in continuum and emission-line flux between 1998 December 25 and 27.
The blue and red HeIemission lines were recorded almost a year
apart and exhibit clear differences in structure. The secondary-star
emission is clearly evident in HeIλ6678 (1998 December), although
no strong HeIλ4471 orλ5015 emission can be seen in the 1998
January data. There is also a difference in the HeIλ6678 Doppler
maps between 1998 December 25 and 27, which is probably
re-lated to the change in brightness of the system; the 1998 Decem-ber 25 Doppler map has more enhanced spiral features and weaker secondary-star emission than the December 27 (note that the aver-age map of these two nights is shown in Fig. 4). During all these epochs, however, the spiral structures were observed, demonstrating that they are a persistent feature.
D
o
w
n
lo
a
d
e
d
fro
m
h
ttp
s:
//a
ca
d
e
mi
c.
o
u
p
.co
m/
mn
ra
s/
a
rt
icl
e
-a
b
st
ra
ct
/3
5
7
/3
/8
8
1
/1
0
7
7
8
2
5
b
y
U
n
ive
rsi
ty
o
f S
h
e
ffi
e
ld
u
se
r
o
n
1
1
A
p
ri
l 2
0
1
Figure 3. Trailed spectra and data computed from the Doppler maps (Fig. 4). The blue data recorded in 1998 January have been phase binned into 200-s bins, the red data recorded in 1998 December into 300-s bins. Hγhas not been shown, as it is very similar in nature to Hβ.
3.5 Radial velocity of the white dwarf
We measured the radial velocities of the emission lines in V347 Pup by applying the double-Gaussian method of Schneider & Young (1980), since this technique is sensitive mainly to the line wings and should therefore reflect the motion of the white dwarf with the highest reliability. We tried Gaussians of widths 200, 300 and
400 km s−1and we varied their separation from 200 to 3200 km s−1.
We then fitted
V =γ−Ksin[2π(φ−φ0)] (2)
to each set of measurements, whereVis the radial velocity,Kthe
semi-amplitude,φthe orbital phase, andφ0 is the phase at which
the radial velocity curve crosses from red to blue. Examples of
the radial velocity curves measured for the Hα, Hβ, HeIIλ4686
and HeIλ4471 emission lines are shown in Fig. 5. There is clear
D
o
w
n
lo
a
d
e
d
fro
m
h
ttp
s:
//a
ca
d
e
mi
c.
o
u
p
.co
m/
mn
ra
s/
a
rt
icl
e
-a
b
st
ra
ct
/3
5
7
/3
/8
8
1
/1
0
7
7
8
2
5
b
y
U
n
ive
rsi
ty
o
f S
h
e
ffi
e
ld
u
se
r
o
n
1
1
A
p
ri
l 2
0
1
Figure 4. Doppler maps of the principal emission lines (Hγ is not shown, as it is very similar in nature to Hβ). The cross marked on each Doppler map represents the centre of mass of the system and the open circle represents the white dwarf. These symbols, the Roche lobe of the secondary star and the predicted trajectory of the gas stream, have been plotted using theKR-corrected system parameters summarized in Table 5. The series of points along the gas stream mark the distance from the white dwarf at intervals of 0.1L1, ranging from 1.0L1at the red star to 0.2L1. Doppler tomography cannot properly account for variable line flux, so spectra around primary eclipse were omitted from the fits.
Figure 5. Radial velocity curves of Hα, Hβ, HeIIλ4686 and HeIλ4471 using Gaussian widths of 300 km s−1and a separation of 1400 km s−1. We omitted the points around primary eclipse during the fitting procedure (open circles) as these measurements are affected by the rotational disturbance. The emission lines recorded in 1998 January have been phase-binned into 100 bins for clarity.
evidence of rotational disturbance in the emission lines, where the radial velocities measured just prior to eclipse are skewed to the red, and those measured after eclipse are skewed to the blue. This confirms the detection of a similar feature in the trailed spectra, and indicates that at least some of the emission must originate in
the disc. There is also evidence of a phase shift in Hαand HeII
λ4686, where the spectroscopic conjunction of each line occurs after
photometric mid-eclipse. This phase shift implies an emission-line source trailing the accretion disc, such as a bright spot, and is a common feature of SW Sex stars (e.g. DW UMa, Shafter, Hessman & Zhang 1988; V1315 Aql, Dhillon et al. 1991; SW Sex, Dhillon et al. 1997). There appear to be no significant phase shifts, however, in the other emission lines. Buckley et al. (1990), Mauche et al. (1994) and Diaz & Hubeny (1999) find no evidence of phase shift
in any of their emission lines, although their errors onφ0were much
larger.
We tried to measure white dwarf radial velocity (KW) values us-ing a diagnostic diagram (Shafter, Szkody & Thorstensen 1986), but with no success. We therefore attempted to make use of the light-centres method, as described by Marsh (1988). In the
corotat-ing coordinate system, the white dwarf has velocity (0,−KW), and
symmetric emission, say from a disc, would be centred at that point.
By plottingKx= −Ksinφ0versusKy= −Kcosφ0for the different
radial velocity fits (Fig. 6), one finds that the points move closer to
theKyaxis with increasing Gaussian separation. A simple distortion
which only affects low velocities, such as a bright spot, would result in this pattern, equivalent to a decrease in distortion as one measures emission further into the line wings and therefore more closely rep-resenting the velocity of the primary star. By linearly extrapolating
D
o
w
n
lo
a
d
e
d
fro
m
h
ttp
s:
//a
ca
d
e
mi
c.
o
u
p
.co
m/
mn
ra
s/
a
rt
icl
e
-a
b
st
ra
ct
/3
5
7
/3
/8
8
1
/1
0
7
7
8
2
5
b
y
U
n
ive
rsi
ty
o
f S
h
e
ffi
e
ld
u
se
r
o
n
1
1
A
p
ri
l 2
0
1
[image:8.612.56.298.448.668.2]Figure 6. Light-centres diagram for Hα. Points are plotted for radial ve-locity fits using Gaussians of FWHM=300 km s−1, with separations from 900 km s−1to 2900 km s−1at 100 km s−1intervals. The points move anti-clockwise, towards theKx=0 axis with increasing Gaussian separation.
the largest Gaussian separation on the Hαlight-centre diagram to
theKyaxis, we measure the radial velocity semi-amplitude of the
white dwarf to be∼180 km s−1. The large uncertainty in this value
(∼40 km s−1), however, and the unsuccessful application of the
tech-nique to the other emission lines, prompted us to proceed with the mass determination using the secondary-star features alone.
3.6 Radial velocity of the secondary star
The secondary star in V347 Pup is clearly visible in Fig. 1 through
absorption lines of MgI, FeIand CaI. We compared regions of the
spectra rich in absorption lines with a number of templates with spectral types G7V–M3.5V. A technique known as skew mapping was used to enhance the secondary features and obtain a measure-ment of the radial velocity semi-amplitude of the secondary star (KR). See Vande Putte et al. (2003) for a detailed critique of skew mapping and Thoroughgood et al. (2004) for a successful applica-tion to AC Cnc and V363 Aur.
The data centred onλ5290 were recorded specifically to exploit
the secondary-star features found between the Hβand Hαlines.
Un-fortunately, the presence of weak emission lines (e.g. FeIImultiplet
42 atλλ4924, 5018 and 5169, Mason & Howell 2003) hampered
all efforts to determine aKRvalue from these data. The dominance
of the emission lines in the spectra centred onλ4610 also prevented
aKRdetermination from these data. The red spectra of V347 Pup
centred onλ6330, however, allowed us to study the secondary star
through absorption features blueward of Hα, such as the CaIλ6162
line. Exactly the same conclusion was reached by Diaz & Hubeny (1999).
The first step was to shift the spectral type template stars to correct for their radial velocities. We then normalized each spectrum by dividing by a constant and then subtracting a polynomial fit to the continuum. This ensures that line strength is preserved along the spectrum. The V347 Pup spectra were normalized in the same way. The template spectra were artificially broadened to account for both the orbital smearing of the V347 Pup spectra due to their exposure times (texp), using the formula
V = texp2πKR
P (3)
(e.g. Watson & Dhillon 2001), and the rotational velocity of the
sec-ondary (vsini). Estimated values ofKRandvsiniwere used in the
Figure 7. Skew maps (top) and trailed CCFs (bottom) of V347 Pup cross-correlated with a M0.5V dwarf template.
first instance, before iterating to find the best-fitting values given in Section 3.10. Regions of the spectrum devoid of emission lines were then cross-correlated with each of the templates, yielding a time se-ries of cross-correlation functions (CCFs) for each template star. To produce the skew maps, these CCFs were then back-projected in the same way as time-resolved spectra in standard Doppler tomography (Marsh & Horne 1988). If there is a detectable secondary star, we expect a peak at (0,KR) in the skew map. This can be repeated for each of the templates, and the final skew map is the one that gives the strongest peak.
The skew maps show well-defined peaks atKy≈216 km s−1– the
skew map of the M0.5V template is shown in Fig. 7 together with
the trailed CCFs. A systemic velocity ofγ=15 km s−1was applied
in order to shift the skew map peaks on to theKx= 0 axis (see Smith
et al. 1998 for details). We therefore adoptγ =15±5 km s−1as
the systemic velocity of V347 Pup, in excellent agreement with the
values of 16±10 km s−1and 15±12 km s−1measured by Still
et al. (1998) from the Balmer and HeIIλ4686 emission lines. Theγ
velocities from the emission lines shown in Fig. 5 ranged between
13 km s−1 and 44 km s−1. Otherγ values measured from optical
D
o
w
n
lo
a
d
e
d
fro
m
h
ttp
s:
//a
ca
d
e
mi
c.
o
u
p
.co
m/
mn
ra
s/
a
rt
icl
e
-a
b
st
ra
ct
/3
5
7
/3
/8
8
1
/1
0
7
7
8
2
5
b
y
U
n
ive
rsi
ty
o
f S
h
e
ffi
e
ld
u
se
r
o
n
1
1
A
p
ri
l 2
0
1
[image:9.612.65.281.64.221.2]Table 4. vsinivalues for V347 Pup cross-correlated with the rotationally broadened profiles of G7–M3.5V templates. Also shown is the factor used to multiply the template star features during optimal extraction, and the position of the strongest peak in the skew maps derived from each template using γ-velocities of 0 km s−1and 15 km s−1.
Templates vsini Optimal (Kx,Ky) (Kx,Ky)
at minχ2 factor γ=0 γ=15
(km s−1) (km s−1) (km s−1) G7V 134 0.32±0.05 (−26,212) (10,220) G9V 133 0.28±0.04 (−13,215) (13,220) K0V 133 0.23±0.03 (−2,217) (14,219) K1V 134 0.24±0.03 (−15,215) (8,220) K2V 133 0.20±0.03 (−22,212) (6,219) K3V 136 0.19±0.03 (−28,212) (0,217) K4V 135 0.14±0.02 (−17,211) (3,217) K5V 134 0.13±0.02 (−17,213) (1,218) K7V 133 0.12±0.02 (−24,210) (−3,216) M0.5V 130 0.13±0.02 (−18,213) (0,216) M1.5V 125 0.12±0.02 (−17,213) (−2,216) M2.5V 126 0.13±0.02 (−21,213) (−7,216) M3.5V 127 0.12±0.02 (−33,213) (−23,217)
emission lines vary widely in the literature (−3 to 60 km s−1, Diaz
& Hubeny 1999; –9 to 159 km s−1, Mauche et al. 1994).
Our adoptedKRof 216±5 km s−1 was derived from the skew
map peak of the best-fitting template found in Section 3.10. This
result actually covers theKRvalues derived fromallof the template
stars to within the errors, demonstrating that the result is robust to the choice of template (see Table 4).
3.7 Rotational velocity and spectral type of the secondary star
The spectral-type templates were broadened for smearing due to orbital motion, as before, and rotationally broadened by a range
of velocities (50–240 km s−1). We then ran an optimal subtraction
Figure 8. Orbitally corrected average spectrum of V347 Pup (top) with the broadened M0.5V template (middle) and the residuals after optimal sub-traction (bottom). The template spectrum has been multiplied by the scaling factor found from the optimal subtraction. All of the spectra are normalized and offset on the plot by an arbitrary amount for clarity. The wavelength limits shown are those used for the cross-correlation and optimal subtrac-tion procedures, except for the region between the dashed lines owing to few secondary-star features.
routine, which subtracts a constant times the normalized template spectrum from the normalized average V347 Pup spectrum, adjust-ing the constant to minimize the scatter in the residual. (Normal-ization was carried out in the same way as Section 3.6, except that this time, the spectra were set to unity.) The scatter is measured by
carrying out the subtraction and then computing theχ2between the
residual spectrum and a smoothed version of itself. By finding the
value of rotational broadening that minimizes theχ2, we obtain an
estimate of bothvsiniand the spectral type of the secondary star.
Note that thevsini values of the template stars are much lower
than the instrumental resolution, so do not affect our measurements
ofvsinifor the secondary star.
The value ofvsiniobtained using this method varies depending
on the spectral type template, the wavelength region for optimal subtraction, the amount of smoothing of the residual spectrum in
the calculation ofχ2and the value of the limb-darkening coefficient
used in the broadening procedure. The values ofvsinifor all of the
templates calculated using values for the limb-darkening coefficient
of 0.5 and smoothed using a Gaussian of FWHM=15 km s−1, are
listed in Table 4.
A plot ofχ2versusvsinifor each spectral-type template is shown
in Fig. 9. The spectral type with the lowestχ2value is M0.5V, which
agrees with a visual identification of the best-fitting template. Diaz & Hubeny (1999), however, estimate a secondary-star spectral type between K0V and K5V, with the possibility of a later-type subgiant. A plot of the V347 Pup average spectrum, a broadened M0.5V template spectrum and the residual of the optimal subtraction is
shown in Fig. 8. Theχ2for the M0.5V template has a minimum at
130 km s−1, so we adoptvsini=130±5 km s−1, with the error
accounting for the measurement accuracy and the other variables noted in the previous paragraph. The error quoted on our adopted
value encompasses the measuredvsinifor all of the templates used
[image:10.612.332.544.452.715.2]in the analysis (except for K3V withvsini=136 km s−1).
Figure 9. Determination ofvsinifor V347 Pup using different spectral-type templates. Degrees of freedom=699.
D
o
w
n
lo
a
d
e
d
fro
m
h
ttp
s:
//a
ca
d
e
mi
c.
o
u
p
.co
m/
mn
ra
s/
a
rt
icl
e
-a
b
st
ra
ct
/3
5
7
/3
/8
8
1
/1
0
7
7
8
2
5
b
y
U
n
ive
rsi
ty
o
f S
h
e
ffi
e
ld
u
se
r
o
n
1
1
A
p
ri
l 2
0
1
[image:10.612.57.296.473.653.2]3.8 TheKRcorrection
The irradiation of the secondary stars in CVs by the emission re-gions around the white dwarf and the bright spot has been shown
to influence the measuredKR(e.g. Wade & Horne 1988; Watson &
Dhillon 2001). For example, if absorption lines are quenched on the irradiated side of the secondary, the centre of light will be shifted
towards the back of the star. The measuredKRwill then be larger
than the true (dynamical) value.
Diaz & Hubeny (1999) found evidence for irradiation of the sec-ondary star in V347 Pup, leading them to apply a correction to
their measured KR value. This fact, and the presence of Balmer
and HeIemission from the inner face of the secondary star seen
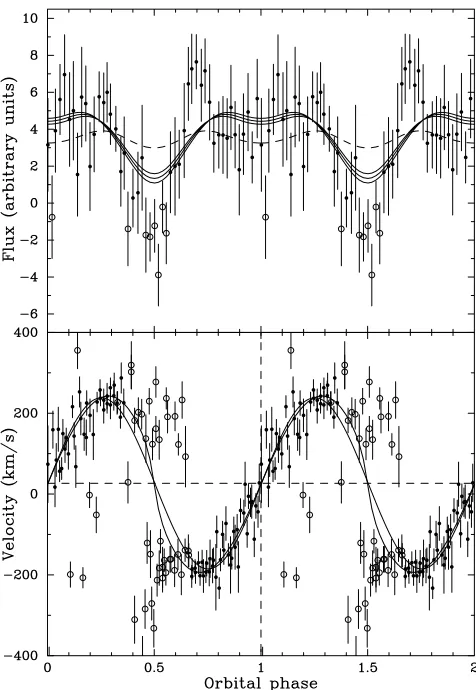
in the Doppler maps and trailed spectra (Section 3.4), prompted us to look for similar irradiation effects in the absorption lines of our data. We applied the following two observational tests. First, the rotationally broadened line profile would be distorted if there was a non-uniform absorption distribution across the surface of the secondary star (Davey & Smith 1992). This would result in a non-sinusoidal radial velocity curve. Second, one would expect a deple-tion of secondary-star absorpdeple-tion-line flux at phase 0.5, where the quenched inner hemisphere is pointed towards the observer (e.g. Friend et al. 1990).
The secondary-star radial velocity curves were produced by cross-correlating the V347 Pup spectra with the best-fitting smeared and broadened template spectra, as described in Section 3.6. The cross-correlation peaks were plotted against phase to produce the radial velocity curves shown in the lower panel of Fig. 10. There is evi-dence for an eccentricity in the radial velocity curve compared with the sinusoidal fit represented by the thin solid line, although the data are noisy.
The variation of secondary-star absorption-line flux with phase for V347 Pup is shown in the top panel of Fig. 10. These light curves were produced by optimally subtracting the smeared and rotationally broadened best-fitting template from the individual CV spectra (with the secondary radial velocity shifted out) as described in Section 3.7. This time, however, the spectra were continuum subtracted rather than normalized to ensure that the measurements were not affected by a fluctuating disc brightness. The constants produced by the optimal subtraction are secondary-star absorption-line fluxes, correct relative to each other, but not in an absolute sense. The dashed lines superimposed on the light curves represent the variation of flux with phase for a Roche lobe with a uniform absorption distribution. The sinusoidal nature is the result of the changing projected area of the Roche lobe through the orbit. The V347 Pup light curve is clearly not represented by a uniform Roche lobe distribution as the secondary-star absorption-line flux vanishes between phases 0.4 and 0.6.
These three pieces of evidence, as well as the disappearance of the CCFs between phases 0.4 and 0.6 seen in Fig. 7, suggest that the secondary star in V347 Pup is irradiated and we must correct
theKRvalues accordingly.
It is possible to correctKRfor the effects of irradiation by
mod-elling the secondary-star flux distribution. In our simple model, we divided the secondary Roche lobe into 40 vertical slices of equal
width from theL1point to the back of the star. We then produced a
series of model light curves (using the system parameters derived in Section 3.10), varying the numbers of slices omitted from the inner hemisphere of the secondary which contribute to the total flux. The model light curves were then scaled to match the observed data, and
the best-fitting model found by measuring theχ2between the two.
[image:11.612.316.554.61.406.2]In all models, we used a gravity-darkening parameterβ=0.08 and
Figure 10. Upper panel: secondary-star absorption line light curve with model fits (solid lines). Model fits are shown for Roche lobes with 11, 12 and 13 slices removed (see text for details). The lower the line, the more slices removed. The dashed line represents a model where no slices have been removed. The data have been phase-binned into 50 bins to increase S/N. Lower panel: measured secondary-star radial velocity curve with a sinusoidal fit (thin solid line) and the best-fitting model fit (thick solid line). In both panels, the open circles indicate points that have been omitted from the fits and the data have been folded to show two orbital phases.
limb-darkening coefficientu=0.5 (e.g. Watson & Dhillon 2001).
The negative data points around phase 0.5 were set to zero, as the secondary-star absorption line flux disappears at this point. Once the best-fitting light curve was found, we produced fake V347 Pup spec-tra from the model, which were cross-correlated with a fake template star to produce a synthetic radial velocity curve. In the first instance, the synthetic curve mimicked the non-sinusoidal nature of the ob-served data, but with a larger semi-amplitude. This was expected,
as the model input parameters used the uncorrectedKRderived in
Section 3.10. We then loweredKRand repeated the process, until
the semi-amplitude of the model and observed radial velocity curves were in agreement, each time checking the light-curve models for
goodness of fit. The resultingKRwas then adopted as the real (or
dynamical)KRvalue.
The best-fitting model light curve was produced by omitting
12 slices when fitting the data (reducedχ2between model and data
=1.03). The model light curves omitting 11, 12 and 13 slices are
shown by the solid lines in Fig. 10. Our final model, which has an
inputKRof 198 km s−1, produces the radial velocity curve shown
as the thick solid line in the lower panel of Fig. 10. There is good
D
o
w
n
lo
a
d
e
d
fro
m
h
ttp
s:
//a
ca
d
e
mi
c.
o
u
p
.co
m/
mn
ra
s/
a
rt
icl
e
-a
b
st
ra
ct
/3
5
7
/3
/8
8
1
/1
0
7
7
8
2
5
b
y
U
n
ive
rsi
ty
o
f S
h
e
ffi
e
ld
u
se
r
o
n
1
1
A
p
ri
l 2
0
1
agreement between this and the observed data. If gravity-darkening and limb-darkening are neglected, the best-fitting light curve
re-mains the same, but produce aKRvalue which is∼6 km s−1lower.
In summary, we correct theKR of V347 Pup from 216 km s−1
to 198 km s−1. This correction of 18 km s−1 is exactly the same
as that calculated by Diaz & Hubeny (1999) using a much simpler
approximation, which changed their measured value of 205 km s−1
to 187 km s−1.
3.9 The distance to V347 Pup
By finding the apparent magnitude of the secondary star from its contribution to the total light of the system, and estimating its abso-lute magnitude, we can calculate the distance (d) using the equation:
5 log(d/10)=mV−MV−AV (4)
whereAVis the visual interstellar extinction in magnitudes per kpc.
The mean R-band photometric flux of V347 Pup during the
recorded spectra is 8.93 mJy, which we convert to a meanR-band
magnitude of 13.8±0.3. The uncertainty reflects the change in
brightness of the system between December 25 and 27. During this
time, the secondary star contributes 13± 2 per cent of the total
light of the system, assuming an early M spectral type (see Table 4).
The apparent magnitude of the secondary is thereforeR=16.0±
0.4, which we convert to aV-band magnitude of 17.3±0.4 using
a typicalV −Rvalue for an early M star from Gray (1992). There
are a number of ways of estimating the absolute magnitude of the secondary star, assuming it is on the main sequence (e.g. Patterson 1984; Gray 1992; Warner 1995b). We took each of these into
ac-count and adopted an average value ofMV= +8.8±0.5. Mauche
et al. (1994) estimated the extinction to V347 Pup to beE(B−V)=
0.05, which results inAV=0.16 (Scheffler 1982). The distance to
V347 Pup is calculated from equation (4) to be 470±130 pc.
Buckley et al. (1990) estimate the distance to V347 Pup to be between 174 and 380 pc, based on their measured system inclina-tion and out-of-eclipse magnitude. Mauche et al. (1994) use their interstellar reddening measurement and a mean interstellar hydro-gen number density to estimate a distance of 340–590 pc. Finally,
Diaz & Hubeny (1999) find a distance of 510±160 pc from the
spectral line depths of the secondary star. Our value is consistent with all distance estimates in the literature.
3.10 System parameters
Using theKRandvsinivalues found in Sections 3.7 and 3.8 in
conjunction with the period determined in Section 3.1 and a
mea-surement of the eclipse full-width at half-depth (φ1/2), we can
calculate accurate system parameters for V347 Pup.
In order to determineφ1/2, we estimated the flux out of eclipse
(the principal source of error) and at eclipse minimum, and then mea-sured the full-width of the eclipse half-way between these points.
The eclipse full-width at half-depth was measured to beφ1/2 =
0.115±0.005, in agreement with the eclipse width at
half-depth of 0.052±0.002 measured by Buckley et al. (1990) at the 2σ
level.
We have opted for a Monte Carlo approach similar to Horne, Welsh & Wade (1993) to calculate the system parameters and their
errors. For a given set ofKR,vsini,φ1/2andP, the other system
parameters are calculated as follows.
R2/acan be estimated because we know that the secondary star
fills its Roche lobe (as there is an accretion disc present and hence
mass transfer).R2is the equatorial radius of the secondary star and
ais the binary separation. We used Eggleton’s formula (Eggleton
1983) which gives the volume-equivalent radius of the Roche lobe to better than 1 per cent, which is close to the equatorial radius of the secondary star as seen during eclipse,
R2
a =
0.49q2/3
0.6q2/3+ln (1+q1/3). (5)
The secondary star rotates synchronously with the orbital motion,
so we can combineKRandvsini, to get
R2
a(1+q)=
vsini
KR . (6)
By considering the geometry of a point eclipse by a spherical body (e.g. Dhillon et al. 1991), the radius of the secondary can be shown to be
R2 a
2
=sin2π
φ1/2+cos2πφ1/2cos2i, (7)
which, using the value ofR2/aobtained using equations (5) and (6),
allows us to calculate the inclination,i, of the system. The geometry
of a disc eclipse can be approximated to a point eclipse if the light distribution around the white dwarf is axisymmetric (e.g. Dhillon 1990). This approximation is justified given the symmetry of the primary eclipses in the photometry light curves (Fig. 2). Kepler’s third law gives us
K3
RPorb
2πG =
M1sin3i
(1+q)2, (8)
which, with the values ofqandicalculated using equations (5),
(6) and (7), gives the mass of the primary star. The mass of the secondary star can then be obtained using
M2=q M1. (9)
The radius of the secondary star is obtained from the equation
vsini
R2 =
2πsini
P , (10)
(e.g. Warner 1995a) and the separation of the components, a, is
calculated from equations (6) and (10) withqandinow known.
The Monte Carlo simulation takes 10 000 values of KR,vsin
i and φ1/2 (the error on the period is deemed to be negligible
in comparison to the errors on KR,v sini and φ1/2), treating
each as being normally distributed about their measured values with standard deviations equal to the errors on the measurements. We then calculate the masses of the components, the inclination of the system, the radius of the secondary star, and the separation of the
components, as outlined above, omitting (KR,vsini,φ1/2) triplets
which are inconsistent with sini1. Each acceptedM1,M2pair is
then plotted as a point in Fig. 11, and the masses and their errors are computed from the mean and standard deviation of the distribution of these pairs.
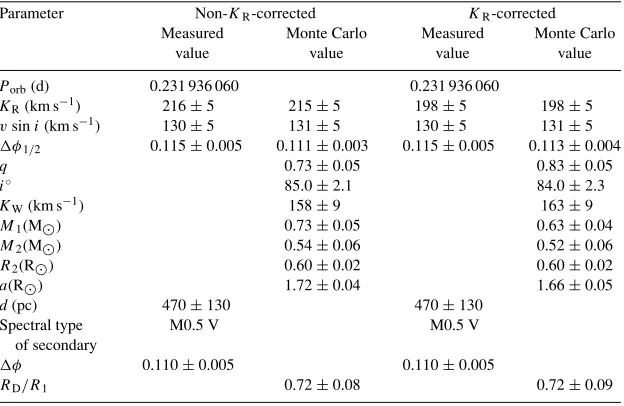
We find the component masses of V347 Pup to beM1=0.63±
0.04 M⊙andM2=0.52±0.06 M⊙. The values of all the system
parameters deduced from the Monte Carlo computation are listed
in Table 5, includingKR-corrected and non-KR-corrected values
for comparison. Note that our derived KW of 163± 9 km s−1 is
in remarkable agreement with theKWvalues of Still et al. (1998)
who measure 156±10 km s−1using a double-Gaussian convolution
of the Balmer lines, and 166 km s−1as the centre of axisymmetric
Balmer emission. The white dwarf mass of 0.63 ±0.04 M⊙ is
consistent with the average value of M1 = 0.80±0.22 M⊙(for
CVs above the period gap) determined by Smith & Dhillon (1998). The empirical relation obtained by Smith & Dhillon (1998) between mass and radius for the secondary stars in CVs predicts that if the
D
o
w
n
lo
a
d
e
d
fro
m
h
ttp
s:
//a
ca
d
e
mi
c.
o
u
p
.co
m/
mn
ra
s/
a
rt
icl
e
-a
b
st
ra
ct
/3
5
7
/3
/8
8
1
/1
0
7
7
8
2
5
b
y
U
n
ive
rsi
ty
o
f S
h
e
ffi
e
ld
u
se
r
o
n
1
1
A
p
ri
l 2
0
1
Figure 11. Monte Carlo determination of system parameters for V347 Pup. Each dot represents anM1,M2pair; the solid curves satisfy thevsiniand KRconstraints, and the dashed lines mark lines of constant inclinations (i= 80◦, 85◦and 90◦).
secondary star in V347 Pup is on the main sequence, it should
have a radius of 0.54±0.08 R⊙. Our measured value of 0.60±
0.02 R⊙(from equation 10) is consistent with this value.
4 D I S C U S S I O N
4.1 Spiral arms
Spiral-armed disc asymmetries are evident in the HeI and Hβ
Doppler maps, confirming the findings of Still et al. (1998) in their
Hβand Hγmaps; see also Papadimitriou et al. (2005) for spiral arms
in HeI. Similar spiral structures have been observed in dwarf novae
Table 5. System parameters for V347 Pup. The Monte Carlo results for corrected and uncorrected KRvalues are shown for comparison. The radial velocity of the white dwarf (KW) has also been calculated from the secondary-star parameters.
Parameter Non-KR-corrected KR-corrected
Measured Monte Carlo Measured Monte Carlo
value value value value
Porb(d) 0.231 936 060 0.231 936 060
KR(km s−1) 216±5 215±5 198±5 198±5
vsini(km s−1) 130±5 131±5 130±5 131±5 φ1/2 0.115±0.005 0.111±0.003 0.115±0.005 0.113±0.004
q 0.73±0.05 0.83±0.05
i◦ 85.0±2.1 84.0±2.3
KW(km s−1) 158±9 163±9
M1(M⊙) 0.73±0.05 0.63±0.04
M2(M⊙) 0.54±0.06 0.52±0.06
R2(R⊙) 0.60±0.02 0.60±0.02
a(R⊙) 1.72±0.04 1.66±0.05
d(pc) 470±130 470±130
Spectral type M0.5 V M0.5 V
of secondary
φ 0.110±0.005 0.110±0.005
RD/R1 0.72±0.08 0.72±0.09
during outburst (e.g. IP Peg, Steeghs, Harlaftis & Horne 1997; U Gem, Groot, Rutten & van Paradijs 2001). Tidally driven spiral den-sity waves can develop in accretion discs due to the tidal torque of the mass donor star on the outer disc (Sawada, Matsuda & Hachisu 1986; Blondin 2000; Boffin 2001). Their detection in outburst only reflects the much stronger tidal effects on the accretion disc when it increases in size and temperature during outburst, in which case a tidally induced spiral structure is expected that closely matches the observed structures (Armitage & Murray 1998; Steeghs & Stehle 1999; Steeghs 2001). In dwarf novae, these asymmetries decay as the system returns to quiescence, and the disc cools and shrinks. In order for a similar tidal response to be responsible for the disc asymmetry in V347 Pup, its disc must be large and comparable to the tidal radius. We calculate the tidal radius of the accretion disc to
be 0.33ausing the pressureless disc models of Paczynski (1977) and
our new system parameters. The measured disc radius ofRD/a=
0.28±0.03 is comparable in size to the tidal radius, and therefore
consistent with a tidal origin for the observed spiral structure. Our observations show that the spiral structures are clearly visible
in the HeIDoppler maps, but are either weak or non-existent in
the Balmer and HeIImaps. This is in contrast to dwarf novae in
outburst, which typically show stronger spiral structures in the HeII
and Balmer lines (e.g. Marsh 2001; Morales-Rueda 2004). This could be a reflection of different densities and temperatures in NL discs compared to the discs of dwarf novae in outburst, or it could simply be due to a contrast effect where the relative contribution of
the spiral structure is not as high in the HeIIand Balmer maps due
to the presence of low-velocity emission.
Note that the impact of such tidally induced spiral arms on the an-gular momentum transport has not been fully established. If they are associated with hydrodynamical shocks, such as in the simulations of Sawada et al. (1986), their contribution to the angular momentum transport could be very significant. On the other hand, Smak (2001) and Ogilvie (2002) propose that these disc structures may reflect tidally thickened areas in the outer disc as it expands close to its tidal radius. Their enhanced emission is then caused by irradiation from the accreting white dwarf and regions close to it.
The prospect of testing such basic disc physics with observations warrants the study of these disc structures in more detail (see also
D
o
w
n
lo
a
d
e
d
fro
m
h
ttp
s:
//a
ca
d
e
mi
c.
o
u
p
.co
m/
mn
ra
s/
a
rt
icl
e
-a
b
st
ra
ct
/3
5
7
/3
/8
8
1
/1
0
7
7
8
2
5
b
y
U
n
ive
rsi
ty
o
f S
h
e
ffi
e
ld
u
se
r
o
n
1
1
A
p
ri
l 2
0
1
[image:13.612.149.461.539.742.2]