Sandwich Structures Under Impulse Loading
Thesis by
Michael Lee Silva
in Partial Fulfillment of the Requirements
for the Degree of
Doctor of Philosophy
California Institute of Technology
Pasadena, California
2011
© 2011
Michael Lee Silva
Acknowledgements
I would like to acknowledge my advisor Guruswami (Ravi) Ravichandran for his
continued support during my time at Caltech. I appreciate his advice, encouragement, and
gentle prodding that has helped guide my studies and thesis research. I truly appreciate
the trust and freedom he allowed me to work through problems while not losing sight of
the bigger picture. I would also like to thank my fellow research group members for their
valuable insights, comments, and spirited discussions. I am grateful for my Caltech
experience as it has allowed me to mature as a scientist, husband, and father.
I must also acknowledge the support and encouragement of my family. In particular,
my loving wife during our entire time at Caltech, from problem sets to thesis writing; we
have helped and supported each other. I can not say in words how much richer my life
has become with her by my side and if I gained nothing else during my experiences at
Caltech, would still be eternally grateful.
This work was supported by the DoD MURI at the California Institute of Technology
on Mechanics and Mechanisms of Impulse Loading, Damage and Failure of Marine
Structures and Materials through the Office of Naval Research
Abstract
Damage evolution in composite materials is a rather complex phenomenon. There are
numerous failure modes in composite materials stemming from the interaction of the
various constituent materials and the particular loading conditions. This thesis is
concerned with investigating damage evolution in sandwich structures under repeated
transient loading conditions associated with impulse loading due to hull slamming of
high-speed marine craft. To fully understand the complex stress interactions, a full field
technique to reveal stress or strain is required. Several full field techniques exist but are
limited to materials with particular optical properties. A full field technique applicable to
most materials is known as thermoelastic stress analysis (TSA) and reveals the variation
in sum of principal stresses of a cyclically loaded sample by correlating the stresses to a
small temperature change occurring at the loading frequency. Digital image correlation
(DIC) is another noncontact full field technique that reveals the deformation field by
tracking the motion of subsets of a random speckle pattern during the loading cycles.
A novel experimental technique to aid in the study of damage progression that
combines TSA and DIC simultaneously utilizing a single infrared camera is presented in
this thesis. A technique to reliably perform DIC with an infrared (IR) camera is
developed utilizing variable emissivity paint. The thermal data can then be corrected for
rigid-body motion and deformation such that each pixel represents the same material
point in all frames. TSA is then performed on this corrected data, reducing motion blur
and increasing accuracy. This combined method with a single infrared camera has several
advantages, including a straightforward experimental setup without the need to correct
external lighting in TSA as the measured electromagnetic radiation is emitted by the
sample’s thermal fields.
The particular stress resolution of TSA will depend on properties of the material of
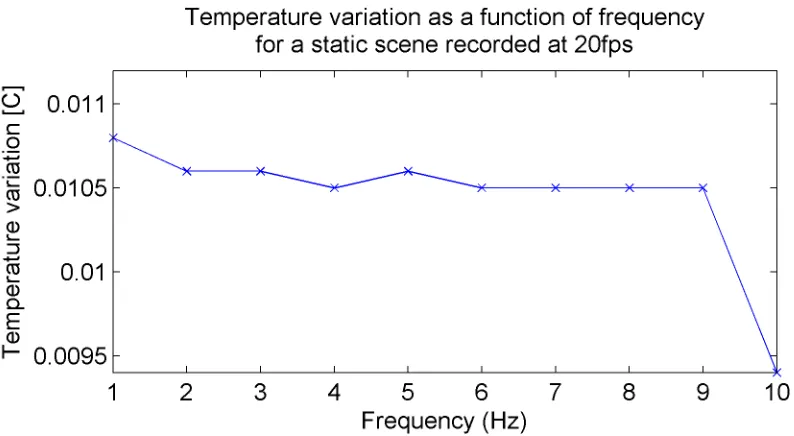
interest but the noise floor for the temperature variation is universal to the camera
utilized. For the camera system in this thesis, the noise floor was found to be fairly
frequency independent with a magnitude of 0.01 oC, giving the minimum measurable
stress for 2024 aluminum alloy of 3.6 MPa and for Nylon of 0.84 MPa. The average
displacement range found during a static DIC test with IR images was 0.1 pixels. The
maximum displacement variation at 1 Hz was 0.018 pixels. The average variation in
strain at 1 Hz was 25 microstrain comparable to traditional DIC measurements in the
visible optical regime.
The combined TSA-DIC method in IR was validated with several benchmark
example problems including plate structures with holes, cracks, and bimaterials. The
validated technique was applied to foam-core sandwich composite beams under repeated
simulated wave slamming loading. There are numerous failure modes in sandwich
composite materials and the full field stress and strain from TSA and DIC, respectively,
allow for improved failure analysis and prediction. Understanding damage in sandwich
structures under impulse loading is a complex open area of research and the combined
Table of Contents
Acknowledgements ... iii
Abstract ... iv
Table of Contents ... vi
List of Figures ... x
List of Tables ... xviii
Chapter 1: Introduction ... 1
1.1 Motivation ... 1
1.2 Hull and Wave Slamming ... 4
1.2.1 Theoretical pressure profiles ... 5
1.2.2 Pressure profiles from water impact experiments ... 7
1.2.3 Slamming simulations ... 12
1.2.4 Summary ... 14
1.3 Composite Materials ... 14
1.3.1 Failure modes and damage in composites ... 23
1.3.2 Damage modes in sandwich structures ... 29
1.4 Damage Detection in Composites ... 35
1.4.1 Damage detection using thermal imaging ... 36
1.4.2 Infrared measurements ... 39
References ... 43
Chapter 2: Combined Thermoelastic Stress Analysis and Digital Image Correlation With a Single Infrared Camera ... 54
2.1 Introduction ... 54
2.1.1 Full field stress analysis ... 54
2.1.2 Thermoelasticity ... 56
2.1.3 Thermoelastic stress analysis (TSA) ... 57
2.1.4 Thermography fundamentals ... 64
2.2 Digital Image Correlation (DIC) ... 67
2.2.1 DIC fundamentals ... 67
2.2.2 Tracking particles with IR camera ... 68
2.3 Combining TSA and DIC ... 70
2.4 Performance Characterization of Combined TSA-DIC Method ... 75
2.4.1 Stress resolution ... 75
2.4.2 Displacement and strain resolution ... 76
2.5 Processing IR images for DIC ... 78
2.5.1 Thermal variation error ... 84
2.6 Combined TSA-DIC Examples ... 85
2.6.1 Plate with crack ... 85
2.6.3 Bimaterial crack ... 95
2.7 Conclusions ... 101
References ... 103
Chapter 3: Simulated Slamming Experiments on Sandwich Composites ... 106
3.1 Slamming Loading Device ... 107
3.2 Design and Performance Characterization ... 111
3.2.1 Pulse replication ... 112
3.2.2 Sandwich structure and expected failure modes ... 120
3.2.3 Thermoelastic stress analysis (TSA) on foam core ... 122
3.3 TSA-DIC under hull slamming loading ... 130
3.3.1 Results from Combined TSA-DIC ... 132
3.3.2 Damage Detection, Initiation, and Growth ... 137
3.4 Conclusions ... 143
References ... 146
Chapter 4: Conclusions and Future Work ... 148
4.1 Conclusions ... 148
4.2 Future Work ... 151
Appendix A: Thermoelastic Calibration of H100 Foam ... 155
A.1 Background on Polymeric Foams ... 155
A.2.1 Thermoelastic properties of H100 PVC foam ... 158
A.2.2 Thermoelastic model of H100 PVC foam ... 161
A.2.3 Comparison and discussion of model ... 163
References ... 165
Bibliography ... 166
List of Figures
Figure 1.1: Schematic of a rigid wedge at velocity V entering initially calm water and the
resulting water surface [2]. The deadrise angle is denoted by the angle β ... 6
Figure 1.2: Theoretical non-dimensional pressure distributions along a rigid wedge
entering water at a constant velocity, calculated from a similarity solution [11] for
various wedge angles β where an abscissa -1 represents the vertex and 0 represents
original water level ... 7
Figure 1.3: Typical pressure profiles at several panel locations during slamming event on
an inclined 10 o rigid panel plunged into water at 3m/s, from [17] ... 11
Figure 1.4: Example of hydroelastic effect on sandwich panel deflection, from [21].
Accounting for hydroelastic effects resulted in decreased panel deflections ... 13
Figure 1.5: Schematic of sandwich structure and bending stiffness. Face sheet thickness tf
separated by distance d attached to a core of thickness tc ... 21
Figure 1.6: Failure mode map for a sandwich structure under three-point bending loading,
CFRP fiber skin and (a) H200 foam (b) H100 foam for 229 mm (9 inch) span, with
the following foam and skin thickness dimensions: x (50mm/2mm), o
(12.5mm/2mm), (12.5mm/1mm), * (12.5mm/0.75mm) ... 34
Figure 1.7: Blackbody spectral radiation according to Planck's law plotted for various
temperatures ... 40
Figure 2.1: Spectral emissivities of ultra flat black paint (Krylon 1602) samples measured
at University of California, Santa Barbara (o) and JPL (solid line), and the effective
Figure 2.2: IR image demonstrating the speckle pattern thermal contrast (oC) on uniform
temperature aluminum sample with applied lower emissivity paint as speckles over
high emissivity base (Krylon 1602) ... 73
Figure 2.3: (a) Temperature variation around fatigue crack tip in Al2024; (b) Percent
error when not accounting for sample motion and distortion ... 75
Figure 2.4: Temperature field (oC) example during static test ... 76
Figure 2.5: Temperature variation as a function of frequency for a static scene recorded at
20 fps with a SC6000 IR camera ... 76
Figure 2.6: (a) Displacement range and (b) variation in pixels at 1 Hz for a static speckled
sample ... 77
Figure 2.7: (a) Strain range and (b) variation in µstrain at 1 Hz for a static speckled
sample ... 77
Figure 2.8: Raw temperature field (oC) at two instances during tension-tension loading
cycle of an aluminum 2024 plate with a fatigue crack demonstrating temperature
change from thermoelastic effect ... 80
Figure 2.9: Example filtering process to improve DIC tracking. (a) Raw image; (b) Low
frequency content; (c) After subtracting low frequency content (Units: oC) ... 80
Figure 2.10: Difference between two thermal images from the same loading cycle: (a)
before filtering showing thermoelastic effect and (b) after subtracting low frequency
content from each image showing the speckle pattern clearly ... 81
Figure 2.11: FFT analysis of the time varying signal for a single pixel. The large spike at
index 0 represents the mean temperature while the spike at index f corresponds to the
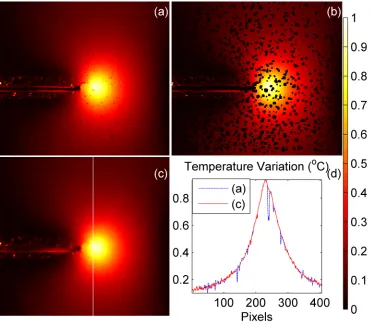
Figure 2.12: (a) Temperature variation around fatigue crack tip in Al2024 with speckle
pattern emissivity effect; (b) Spot removal; (c) interpolated though spots (d)
temperature variation along indicated vertical line before and after spot removal
process ... 83
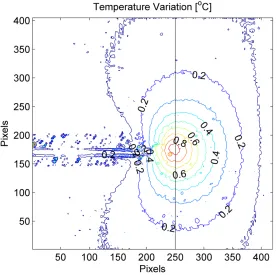
Figure 2.13: Mean thermal variation around fatigue crack tip with indicated line ... 84
Figure 2.14: Thermal variation along indicated line with error bars equal to standard
deviation of amplitude measurement via FFT ... 85
Figure 2.15: (a) Raw Temperature oC; (b)Temperature variation oC around Mode I crack
in Al 2024; (c) Temperature variation difference with distortion correction; (d)
variation in sum of principal stress (MPa) after applying basic TSA relationship to
(b). 5.3 pixels per mm giving a field of view of 69 x45 mm ... 86
Figure 2.16: (a) Sum of principal stresses from theory and TSA; Stress along vertical line
and (c) horizontal line through crack-tip comparing TSA and theoretical result for
geometric correction factors Y = 1 and Y = 2.89 ... 88
Figure 2.17: (a) Sum of principal stress field (MPa) around Mode I crack via TSA and
FEA; (b) Stress along vertical line and (c) horizontal line through crack-tip
comparing TSA and FEA result ... 89
Figure 2.18: Vertical displacement (µm) in loading direction of Al2024 plate near edge
crack from DIC and FEA ... 90
Figure 2.19: Sum principal stresses around 2024 aluminum plate 50.8-mm-wide with a
9.42 mm hole applied cyclic tensile stress comparing measured to theoretical stress
Figure 2.20: Comparing sum of principal stress magnitude between TSA-DIC method
and Theory (a) along horizontal line and (b) along vertical line through hole for a
50.8 mm wide Al2024 plate with a 9.42 mm hole ... 93
Figure 2.21: (a) Vertical displacement field form DIC and FEA; (b) Vertical
displacement on vertical line through hole center ... 94
Figure 2.22: (a) Sum of principal stresses around cyclically loaded 49.8-mm-wide nylon
plate with 25.4 mm hole after correcting for loading distortion; (b) temperature
variation difference when not correcting for sample distortion. Field of view: 71 x
44.3-mm-with 5.98 pixels per mm ... 95
Figure 2.23: Bimaterial edge crack geometry W = 75 mm, a = 18.75 mm (a/W = 0.25)
with 0.38 mm crack thickness. Material 1 is cast nylon 6 and Material 2 is extruded
acrylic ... 96
Figure 2.24: Thermoelastic sensitivity for acrylic (95.0 MPa/C) and nylon (85.6 MPa/C)
determined from fitting of thermal response at various applied stress variations ... 97
Figure 2.25: Temperature variation (oC) around bimaterial crack under 6000 N cyclic
loading. Top material is nylon and bottom material is acrylic. Dimensions are in
pixels with 10.6 pixels per mm giving a field of view of 40 x 52 mm ... 98
Figure 2.26: Sum of principal stress variation (MPa) around bimaterial crack under 6000
N cyclic compressive loading. Top material is nylon and bottom material is acrylic.
Dimensions are in pixels with 10.6 pixels per mm giving a field of view of 40 x 52
mm ... 99
Figure 2.28: Sum of Principal Stresses (MPa); 1pixel (94 µm) above and below interface
comparing TSA and FEA results ... 100
Figure 3.1: Mechanical shock testing machine simulating underwater explosive loads as described in MIL-S-901D [118] ... 108
Figure 3.2: Hull slamming simulator facility for imposing dynamic loading on sandwich structures ... 109
Figure 3.3: Schematic of the mechanical slamming simulator (MSS) ... 109
Figure 3.4: Close-up view of the MSS device ... 111
Figure 3.5: Example of MSS force trace on a rigid structure ... 112
Figure 3.6: Typical pressure during model slamming events [119] ... 113
Figure 3.7: Pressure distribution along contact edge for several nylon impactor geometries utilizing finite element analysis. (a) Rectangle (b) Trapezoid, (c) Cylinder. Same loading force is applied in all cases ... 114
Figure 3.8: Indentation failure of sandwich structure under repeated slamming using nylon half cylinder impactor ... 115
Figure 3.9: FEA geometry of the sandwich structure simulating hull slamming test condition ... 116
Figure 3.11: Surface pressure per unit width under rubber impactor with elastic modulus
of 10 MPa for several loading forces. Distance is normalized with the half-length of
rectangular impactor ... 117
Figure 3.12: Pressure under rubber impactor inferred from experimentally measured force
history over impact area 0.0077 m2onto a sandwich composite beam ... 118
Figure 3.13: Wedge velocity and coefficient of pressure (Cp) required for obtaining
particular pressures based on the wedge water entry problem. Cp = p/0.5 ρV2 ... 119
Figure 3.14: Residual pressure coefficient trailing after peak pressure pulse during a
wedge slamming event. The computation is based on results from [11] ... 119
Figure 3.15: Thermoelastic response of Divinycell H100 for various compaction levels
... 124
Figure 3.16 Schematic of a three-point bend configuration with observation region for
combined TSA-DIC indicated by the dashed box ... 125
Figure 3.17: (a) Raw infrared (IR) image of foam core temperature (oC) in the region
under the center loading pin, (b) After spot removal. Field of view: 55 x 105 mm (5.4
pixels per mm) ... 125
Figure 3.18: DIC displacement and strain field variation amplitude; (a) vertical and (b)
horizontal pixel motion; (c) vertical and (d) horizontal strain components. Field of
view: 44.4 x 107.4 mm (5.4 pixels per mm) ... 126
Figure 3.19: TSA results demonstrating the effect of DIC correction on sandwich
composite beam under three-point bending. (a) Temperature variation (oC) in foam
core with DIC correction and (b) without DIC correction. Field of view: 44.4 x 107.4
Figure 3.20: Detailed half model of three point bending test on sandwich composite
beam. Center and end of epoxy filled groove cut into foam during manufacturing as
origin of coordinate system ... 128
Figure 3.21: Sum of Principle Stresses (MPa) from (a) FEA model; (b) TSA-DIC analysis
using thermoelastic calibration factor for H100 foam; (c) DIC strain field variation
amplitude multiplied by the Young’s modulus for H100 foam ... 129
Figure 3.22: Comparison of sum of principal stress from TSA, DIC and FEA along (a)
vertical centerline of beam and (b) horizontal line at edge of epoxy intrusion into
foam core ... 130
Figure 3.23: Temperature [oC], in a sandwich composite under slamming loading as
visualized using thermal IR imaging ... 131
Figure 3.24: Example of raw temperature field [oC] during a slamming test ... 132
Figure 3.25: TSA thermal variation (oC) near delamination crack in sandwich composite
under slamming loading (a) with DIC correction, (b) without DIC correction, arrow
indicating key difference ... 134
Figure 3.26: Sum of principal stresses [MPa] in sandwich composite under 3.5 mm
prescribed top displacement on a rubber impactor. The composite beam is composed
of a 50 mm H100 foam core and two 2 mm CFRP faceplates ... 136
Figure 3.27: Vertical displacement (mm) plotted on reference geometry from FEA
analysis with prescribed 3.5 mm top displacement of the impactor ... 136
Figure 3.28: Measured vertical displacement variation (pixels) under slamming loads via
Figure 3.29: Stress variation [MPa] in foam core during Case #8 from Table 3.3 at (a)
24000, (b) 48000, (c) 60000, (d) 72000 cycles. Sample supported at bottom corners
of image and loaded at top center; arrows indicate delamination extent ... 139
Figure 3.30: Average temperature during thermal recordings at various numbers of
loading cycles ... 140
Figure 3.31: Vertical displacement variation (pixels) during slamming loading for Case
#8 in Table 3.3 with a delamination crack ... 141
Figure 3.32: Difference in stress [MPa] between states at loading cycles (a) 48 k–24 k,
(b) 60 k–24 k, (c) 72 k–24 k during Case #8 in Table 3.3. Sample supported at
bottom corners of image and loaded at top center; arrows indicate delamination
extent ... 143
Figure A.1: Normalized temperature-dependent elastic modulus of Divinycell H100 and
HP100 foam [128] ... 157
Figure A.2: Density of H100 versus strain for various assumptions on Poisson effect .. 159
Figure A.3: Apparent modulus of H130 foam from [129] during uniaxial compression
test ... 160
Figure A.4: Poisson’s ratio for H130 foam under uniaxial compression [129] ... 161
Figure A.5: Model prediction for thermoelastic sensitivity of H100 foam with evolving
List of Tables
Table 1.1: Maximum stress and strain failure criteria ... 26
Table 1.2: Yield functions for various interactive failure models ... 28
Table 1.3: Hashin-Rotem mode-based failure criteria ... 29
Table 1.4: Nondimensional failure modes for sandwich composite under three-point bending [81] ... 33
Table 1.5: Mechanical and physical properties of selected materials for sandwich structures ... 35
Table 1.6: Values of physical constants [100] ... 40
Table 2.1: Material properties for TSA analysis ... 71
Table 2.2: Material properties of acrylic and nylon using IR displacement tracking ... 97
Table 3.1: Strength properties of sandwich structure components ... 121
Table 3.2: Sample dimensions, mass, density, and observed thermoelastic sensitivity of Divinycell H100 foam core ... 123
Table 3.3: Mechanical slamming simulator test case parameters ... 133
Table 3.4: Comparable wedge slamming conditions ... 133
Table 3.5: Slamming loading conditions determining failure threshold ... 142
Table A.1: Properties of H100 PVC foam ... 161
Chapter 1: Introduction
1.1
Motivation
The development of recent Navy marine craft has seen the emergence of lightweight
designs for high-speed, multi-mission seaborne structures such as the M80 Stiletto of M
Ship Co. and the ONR Sea Fighter experimental littoral combat ship. With novel
concepts such as hybrid hulls and catamarans for high speed and long distance missions,
modern designs for ships are increasingly utilizing sandwich composites to build lighter
weight craft, obtain higher speeds, and have low radar, infrared, and magnetic signatures
making them stealthy. Composite super structures and foredecks have been mated to
traditional steel hulls such as the French La Fayette frigate resulting in weight savings
and reduced maintenance cost over steel. Some of the longest naval ships to be
constructed entirely of composite materials are the 72 meter Visby class corvettes in the
Royal Swedish Navy [1]. The Visby is designed as a multi-purpose vessel with the
capability to perform surveillance, combat, mine laying, mine countermeasures, and
anti-submarine warfare. Being constructed entirely of carbon and glass fiber laminate skins
bonded to closed-cell poly vinyl chloride (PVC) foam core, the Visby’s sandwich
construction allows the vessel to be lightweight, have low radar and magnetic signatures,
and be strong enough to handle underwater shock loads. These benefits do not come
without a cost; these structures are more complex to design and manufacture and have
more failure modes than a metal hull. In addition to the standard failure modes for a
classic metal ship, the material structure itself can introduce failure modes such as
Wave impact loads are a major concern in the structural design of a marine vessel and
are reason enough for a shipmaster to reduce the ship’s speed if the impacts are too large
or frequent [2]. As a marine craft pierces a wave at high speed and slams on the water
surface or is impacted by a wave, a characteristic pressure pulse is generated that travels
along the hull (to be described in more detail in the next section). Depending on the hull
type and impact angle, there can be different responses to wave/hull slamming events.
When the impact angle is quite small, on the order of a few degrees, very high pressures
are created and hydroelasticity becomes important [3] meaning the deformation of the
structure is significant and the fluid structure interaction has a pronounced effect on peak
loads and pressure pulse profile. Very large waves, often called “freak waves”, are also a
concern due to the extreme forces and catastrophic damage a ship could sustain. These
extremely large waves have been documented to submerge the decks of large ships,
causing damage to large vessels and even cleaving one in half [4]. There are a few
possible causes for these extremely large waves; one possibility is caustic focusing of
gravity waves [4], where caustic regions act like a lens and make these waves more likely
to form. Freak waves need not be so extreme, they can simply be surprisingly large for
the given sea state. These waves can be defined as having amplitude twice as large as the
significant wave height [5]. It is these, more common, freak waves which have high
amplitude and low frequency that can be justifiably used as a design load for a vessel.
In addition to these freak waves, high-speed marine craft are also subject to a
significant number of lower amplitude hull slamming events over their operating lifetime,
which raises concern for how these complex composite structures handle repeated
significantly high pressure loads and may occur with a frequency on the order of a hertz
as the craft impacts waves at high speed. The issue of wave slamming poses concern for
any ocean-going vessel or structure subjected to wave impact. During these hull
slamming and wave impact events, the structure can be subject to very high pressures and
result in substantial, if not catastrophic, damage over time. High speed boats, in
particular, are subject to these loads on a more frequent basis. Understanding the
structural response, damage evolution, and failure modes in sandwich structures resulting
from repeated slamming loads are important in estimating a vehicles’ useable lifetime
and can result in improved future designs.
This thesis investigates the damage evolution in sandwich structures under simulated
hull slamming conditions under controlled laboratory conditions. A technique utilizing a
single infrared camera to simultaneously perform thermoelastic stress analysis (TSA) and
digital image correlation (DIC) is developed for cases with relatively large displacements.
TSA allows for the determination of the sum of principal stresses by measuring the
magnitude of thermal variations under cyclic loading under the assumption of elastic and
adiabatic loading on an isotropic homogenous medium. DIC allows for the determination
of deformation under loading by tracking motion of numerous subsets of a random
speckle pattern. This combined method is particularly germane to hull slamming loading
on sandwich composite beams due to the large deflections expected in the center span. If
these deflections are not unaccounted for, a spurious TSA result is likely to be
encountered.
A unique challenge for DIC in infrared (IR) requires creating an apparent thermal
lower emissivity paint speckles on a high emissivity base coat. Combining the IR-DIC
results and TSA allows for deformation correction during the loading cycles such that
each pixel represents the same material point during the entire thermal recording. The
combined TSA-DIC method was verified with on several benchmark problems by
comparing the measured sum of principal stresses to theoretical or numerical results.
Plates with holes, cracks, and bimaterial interfaces were cyclically loaded and the
resulting thermal variation maps were determined after motion correction. The verified
method was then applied to sandwich composite beams under high cycle simulated hull
slamming loading. The resulting damage modes and propagation as well as the complex
stress field, were measured during the actual loading.
1.2
Hull and Wave Slamming
High impulsive loading on boat hulls during wave impact remains a major area of
concern in high-speed ship design. As an approximation of the slamming event, most
previous experimental and numerical studies have focused on the so-called wedge entry
problem [6], where panels or wedges are dropped into water [7]. The wedge water entry
problem has been studied for many years, starting with von Karman’s pioneering work in
1929 and continuing through Faltinsen’s work in the new millennium. Though such
studies have provided insights concerning scaling laws for local slamming pressures, the
mechanisms of load transfer to the structure from slamming and subsequent damage
continue to be active areas for research. In most cases, the structure is considered rigid
and only limited studies have explored the deformability of the structure during
slamming. Due to the unpredictability of hull slamming, designing bows to handle impact
slamming can lead to catastrophic damage, such as complete collapse of the bow
structure or fatigue failure of the hull, the present work seeks to understand the
deformation and failure of sandwich composites due to this type of impulsive loading.
1.2.1
Theoretical pressure profiles
The majority of previous investigation into slamming utilized a wedge model as an
approximation for a boat hull. A schematic of a wedge entering water and the resulting
wetting profile is shown in Figure 1.1. A particular slamming event occurs when a wedge
enters an initially calm body of water at some velocity (V) and deadrise angle (β), the
angle the wedge makes with initial free surface. The first analysis of the wedge entry
problem was performed by von Karman [8] who derived an expression for pressure and
force experienced by seaplane pontoons during landing. Von Karman’s analysis
determined the expected pressure for an assumed infinitely large rigid wedge entering an
infinitely expansive calm body of water at a constant velocity and impact angle. A major
improvement to von Karman’s work made by Wagner [9] included the wetting of the
wedge and the formation of a water jet at the spray roots on the wedge. Dobrovol'skaya
[10] simplified the problem of needing to solve a complex potential for the symmetric
water entry of a rigid wedge with constant entry velocity by providing a similarity
solution where a nonlinear singular integral equation could be solved in an approximate
fashion. Solving this integral equation presents numerical difficulties, especially at small
deadrise angles. Zhao and Faltinsen [11] presented numerical results to the similarity
solution for a broad range of deadrise angles from 4 to 81 degrees using a boundary
‘generalized Wagner method’, was presented by Zhao et al. [12] and is numerically more
stable and faster than the more exact boundary element method.
Figure 1.1: Schematic of a rigid wedge at velocity V entering initially calm water and the resulting water surface [2]. The deadrise angle is denoted by the angle β
An asymptotic solution [11] for the rigid wedge entry problem was used to generate
the pressure distribution on the wedge from vertex to spray root for several deadrise
angles presented in Figure 1.2. The nondimensional surface position is such that an
abscissa of -1 represents the vertex and 0 represents original water level. The peak
pressure occurs above this level, at the newly formed spray root. It should be noted that a
significant residual pressure continues to load the panel after the peak pulse passes as
long as the entry velocity is maintained. Significant peak pressures can be obtained
during slamming resulting in coefficient of pressures, (p-po)/(0.5 ρV2), in the hundreds
when the deadrise angle is only a few degrees [11]. The coefficient of pressure is a
nondimensional measure of the pressure on the wedge surface, subtracting the free
surface pressure (p-po) and divided by the dynamic pressure (0.5 ρV2), where ρ is the
water density and V is the velocity of the wedge. As the impact angle decreases, the peak
assumption of a rigid wedge and attached flow become violated. Below a deadrise angle
of about 5 degrees, the analytical solution is no longer valid as there are likely pockets of
air trapped under the panel and hydroelastic effects become important [13], meaning the
maximum stresses in a deformable panel are strongly dependent on the vibrating motion
of the panel surface and interaction with the impacted water.
Figure 1.2: Theoretical non-dimensional pressure distributions along a rigid wedge entering water at a constant velocity, calculated from a similarity solution [11] for various wedge angles β where an abscissa -1 represents the vertex and 0 represents original water level
1.2.2
Pressure profiles from water impact experiments
There are several types of slamming on ships that are of concern: bottom, bow flare,
bow stem, and wet-deck slamming [14]. In order to measure the pressure during a slam
event, previous researchers [7, 15] have performed ‘drop’ tests with weighted flat panels
or wedges into a body of water. In these tests, a weighted panel or wedge is dropped into
[image:26.612.198.437.221.438.2]pressure sensors. Wet deck slamming is usually characterized by a small slamming angle
between the panel and water. Due to this small angle, the water motion is restricted and
reaches very high pressures, thus increasing the effect of hydroelasticity. When
hydroelasticity becomes dominant, the deformation and vibrating motion of the panel
itself becomes integral to determining the true forces and strains on the panel. The impact
velocity and highest natural period of the local structure also influence the effect of
hydroelasticity. The peak slamming pressure occurs during the structural inertia phase,
[13] with a time scale shorter than that associated with the lowest natural frequency of the
impacted structure. The impact forces are balanced by the inertia of the panel, which
implies structural elasticity is unimportant during this stage. After the initial impact, the
motion of the plate is such that the vibration velocity completely counteracts the rigid
body drop velocity. Also, the maximum strains occur after the structural inertia phase
during the free vibration phase. There are additional complexities in the pressure
response due to the possibility of cavitations from negative pressure and venting during
the free vibration phase. Hydroelasticity needs to be considered when the angle between
the body and free surface is small. For example, a 14 degree wedge shaped hull was
found to have insignificant hydroelastic effects, but these effects are generally considered
to be significant below 5 degrees [13]. The most important error source in the theoretical
analysis is the impact velocity, which is assumed constant. Since velocity is not measured
directly in experiments (only the gross craft motion); there are also non-linear hull and
free-surface effects that influence the true impact velocity.
The effect of hydroelasticity causes deviations from the rigid/quasi-static slamming
demonstrated by Stenius in 2009 [16] and provides a convenient measure characterizing
the importance of the hydroelastic effect in the response of a panel during a slamming
event. The loading period is defined as twice the wetting time, which can be
approximated using Wagner theory, where the wetting time for the half width of a rigid
wedge is given by,
! ! = !"#
2tanβ (1.1)
where V is the velocity of the wedge, ! is the slamming angle, t is time, and c is the horizontal distance from the center line to the spray root. The total length of the wedge
from keel to chine is given by b and thus twice the time to wet the entire wedge length, which is the loading period (TLP), is given by the following relation
!!" =
4!sin!
!" . (1.2)
The first natural period (TNP) can be approximated using engineering beam theory by
assuming an idealized two-dimensional beam where D is the bending stiffness, m
represents the structural mass, and ma the added mass due to the water (fluid-structure)
interaction. The boundary condition factor !!" equals ! under simply supported
conditions and 4.73 when the boundaries are clamped.
!!" =
2! !!"!
!+!! !!
! (1.3)
The added mass for a rigid panel impacting water at high velocity can be expressed as
!! =!
4!! !cos! ! . (1.4)
The ratio (R) between loading period and natural period can then be given as follows while neglecting the structural mass as the added mass is substantially larger,
! = !!" !!" =4
!!" !
!tan!
!
!
!!!!! . (1.5)
A large R ratio can intuitively be thought of as a having a very stiff or rigid beam such that the natural period is quite small. Conversely, a small R ratio can be thought of as having a relatively flexible beam.
Stenius [16] determined panel responses for varying R ratio conditions. He demonstrated that maximum deflections and strains remained relatively constant as the R
ratio increases above 5, indicating that the panels were behaving in a rigid/quasi-static
manner. Deviations began to occur when the R ratio was below 5, indicating hydroelastic and membrane effects were beginning to influence the response of the panel to water
impact.
High speed water impacts of sandwich composite panels have been performed by
Battley [17] using slamming tests using a specially designed servo-hydraulic slam testing
system (SSTS). The SSTS setup used a hydraulic piston to perform slamming events into
a water tank; similar to a drop test, but with the advantage of having some control over
the specimen motion after impacting the water and improved repeatability. Characteristic
pressure traces from a slamming event with the SSTS are shown in Figure 1.3 and
demonstrate the traveling nature of the pressure pulse and residual pressure after the peak
with the SSTS. The maximum strain rate in the skin (face plate) was found to be
approximately 1 to 4 per/second while the maximum shear stress rate in the foam core
varied with velocity from 200 MPa/s to 4000 MPa/s. Hence it is important to account for
the high strain rate properties of the materials in the sandwich structures, particularly that
[image:30.612.139.492.216.445.2]of the cores.
Figure 1.3: Typical pressure profiles at several panel locations during slamming event on an inclined 10 o rigid panel plunged into water at 3m/s, from [17]
Battley and Lake [18] describe additional work using the SSTS machine examining
the differences in strain at various locations on a sandwich panels between static and
dynamic loading. Under dynamic loading, the moving pressure pulse was observed to
cause a large rise in strain at the chine or top edge of a panel. This corresponds to larger
shear loads and deflections than experienced under static loading conditions. The current
design methodologies [19] for high speed craft are based on static uniform pressure
distributions and Battley’s results indicate high speed craft currently may be designed
varying stiffness under slamming loads [17]. It was found that the more flexible panels
experienced lower peak pressures at the center of the panel but high pressures near the
chine likely a result of local reduction in slamming angle due to panel deformation. The
effects were particularly noticeable when the loading rates were comparable to the first
natural frequency of the panels (R value approximately 1). Deformation due to the hydroelasticy at this low R value can result in a number of effects influencing the pressure on the panel. Panel deflection can reduce the effective slamming angle near the
chine when the pressure pulse loads and deforms the panel. As the panel impacts the
water and deforms, the velocity of the panel may also be decreased during portions of the
slamming event due to hydroelastic effects.
1.2.3
Slamming simulations
A number of previous investigations used finite element analysis (FEA) and boundary
element analysis to investigate the fluid structure interaction during slamming events and
to obtain the pressure and ‘hull’ response for various hull designs and slamming
configurations. Stenius and Rosen [19] applied FEA modeling on hull-water impacts to
explicitly determine the resulting pressure profile and, through carefully chosen
parameters, found it feasible to achieve non-leaking solutions (where the fluid does not
inadvertently pass through the solid) that were stable, but the technique is far from trivial
and can be quite numerically intensive. They found the numerical solution to be
significantly dependent on the contact stiffness between the water and wedge as well as
the mesh refinement. Stenius [20] investigated the effect of hydroelasticity and fluid
structure interaction using FEA. A relationship between panel stiffness and loading time
assumed to be rigid/quasi-static from those where the full hydroelastic fluid structure
interaction needs to be considered.
Qin and Batra [21] describe the development of a comprehensive analytical model for
studying the fluid-structure interaction of a sandwich structure during impact with a calm
water surface. The model was also validated using the ABAQUS finite element program
and with analytical solutions. They calculated the slamming loads and response of the
sandwich structure (Figure 1.4) during a shallow water impact of 5 degrees using a
numerical procedure and a method for solving the coupled nonlinear governing
equations. Under these slamming conditions the effect of hydroelasticity was significant
and the panel deformed, leading to discrepancies in pressure when compared to that of a
rigid panel. It is important to note that when the slamming angle is not this small, the
effect of hydroelasticity becomes insignificant.
[image:32.612.129.517.417.658.2]1.2.4
Summary
The concept of hull and wave slamming was introduced and a review of various
analysis methods was explored regarding slamming pressure determination. A short
history of slamming analysis from von Karman’s work on seaplane floats to modern
finite element analysis was presented. Several results from experimental investigations
were also presented in order to compare the accuracy of the theoretical predictions. These
experimental works measured the pressure and strain at several points on the panels for
various impact conditions. The effect of hydroelasticity was also presented and found to
be minimal when the slamming angle is greater than about 5 degrees. When the
slamming angle is quite small, the hydroelastic effect can play a large role in the
deflection and strains experienced by the panel. Future studies of the slamming problem
can enlighten possible damage mechanisms in composite hulls undergoing repeated
slamming events. With continued observation of damage initiation and progression, it is
anticipated that mitigation strategies or improved design rules could be developed to
produce safer, more robust structures in the next generation of lightweight, high-speed
marine craft.
1.3
Composite Materials
In the most general sense, a composite material can be considered any heterogeneous
medium where two or more materials are joined, forming a new structure. These
structures can range from natural material combinations such as hay-reinforced mud
bricks, laminated wood, and reinforced concrete to modern engineering systems such as
benefit of composite materials is in producing a new enhanced material by combining
desirable traits from the individual components. The richness of composite materials
comes from the ability to tailor the properties and ‘enhance’ desired measure of
performance including weight, strength, cost, durability, ductility, toughness, etc. A
desired property can be improved in a composite material but there will usually be a trade
off in another area. For example, the tensile strength of cement is improved with the
addition of aggregate and steel reinforcement, but the total weight increases, thus it is not
possible to improve every measure of performance.
Nature is full of examples of composite materials where evolution has combined
materials to produce stronger, lighter, more durable structures such as trees, bones, teeth,
and seashells. Trees have many layers or rings which combine a lighter resin-dense wood
with a heaver, stronger fiber-dense wood layer [23]. This structure combines flexible and
strong components allowing trees to reduce mass and grow against gravity while not
snapping under normal wind loads. The human body is also full of examples of
composites such as teeth and bones where the combined properties of materials produce
an improved structure. Bones are made of collagen fibers and crystalline salts [24] that
provide great tensile and compressive strength, respectively, very similar to reinforced
concrete. Sea shells, such as nacre, are also composite materials consisting of one or
more ceramic phases embedded in a polymeric matrix [25] that improves the fracture
toughness by virtue of a specialized microstructure.
There is a long history of utilizing composite materials in the construction industry.
From straw-reinforced mud bricks in the ancient world to the ubiquitous steel-reinforced
have become an attractive method to produce high-performance structures due to their
high strength-to-weight ratios and controlled anisotropy [26]. Fiber composites are
constructed by combining high tensile strength fibers with a polymer matrix, which
transfers loads to the fibers, keeps them together in the proper orientation, and protects
them from environmental damage. The high specific strength of fiber-reinforced
composites is due to the high strength fibers and low density matrix. The anisotropy or
directional properties can be controlled in a number of ways; by adjusting the volume
fractions of fiber and matrix, or by combining several layers of fiber-reinforced laminates
in different orientations. The first major use of fiberglass/epoxy composites occurred
during WWII when composite aircraft radar domes replaced the heavier, less
electromagnetically transparent, canvas-plywood domes [27]. The first mass production
of sandwich panels also occurred during WWII, with the English Mosquito aircraft
utilizing veneer faces with a balsa wood core [28]. Soon after WWII, the marine industry
created the first glass fiber composite boat for the U.S. Navy. Composite material use has
increased steadily, growing at 6.5% since the 1960s [29] as costs have decreased and the
weight savings and reduced maintenance costs have been realized.
A material’s true strength is several orders of magnitude lower than ideal atomistic
predictions; this is driven by the size and distribution of flaws within all real materials.
Advanced fibers attain their dramatic strength increase over the bulk material due to
small fiber diameters; as the cross sections decreases the probability of the presence of
flaws is reduced, and thus the material is able to sustain larger stresses before failure. The
long fibers combined with a matrix to transfer load between fibers allow the structure to
fiber is made of glass, due to both the low cost and high strength [29]. The production of
glass fibers begins by melting the raw ingredients such as sand, limestone, and alumina,
in a furnace. The molten glass then flows either into a marble making machine for later
remelting and drawing or into a fiber-drawing machine directly. The molten glass is
gravity fed into a platinum bushing with many small holes. The molten glass from the
orifices is gathered into fibers of the proper dimension, quenched with water spray and
treated with binders to protect and lubricate the individual fibers. Several fibers are then
gathered to form a fiberglass strand that is wound onto a spindle for later textile
processing to woven sheets. Carbon and graphite fibers are the material of choice in high
performance polymer matrix composites [29], with wide-spread use resulting from
significant price reduction in the 1990s. A common method for producing carbon fiber is
to stretch a precursor fiber made of PAN (polyacrylonitrile) molecules that have a carbon
backbone. These stretched fibers are then carbonized in a furnace at 1500oC in an inert
atmosphere burning off the non-carbon elements leaving a pure carbon strand. These
stretched carbon fibers are then surface treated (sizing) to improve bonding with epoxy
resins and wound onto spools. Common matrix materials in polymeric fiber composites
are thermosetting epoxy, giving easy processing ability (being a liquid) and good
chemical resistance to the finished product, or thermoplastic polymers, which add the
ability to be reformed under heat and pressure.
A number of manufacturing processes exist for fiber composite construction
depending on the application and performance requirements. All the methods utilize
either male and/or female molds which are first prepared with the desired surface finish,
main process distinction is between wet and pre-impregnated (pre-preg) construction.
Pre-preg construction utilizes fabric rolls where the fibers are already in an epoxy matrix
and the structure is assembled of this fabric while the epoxy is tacky and gel like. In wet
construction, the polymer matrix is applied, in liquid form, to the dry fibers during final
construction. There are a number of variations of wet construction, from automated
pultrusion to fairly labor-intensive hand layups. In pultrusion, fiber bundles or tows are
pulled through an epoxy reservoir, shaped though a die, and then cured; forming
unidirectional rods and beams. A relatively simple hand layup construction method uses
an open mold where either chopped fiber or woven mats are placed into the mold and
freshly mixed epoxy is applied in liquid form. The epoxy is worked into the dry fibers
with rollers to wet all the fibers and squeeze out excess epoxy. This process yields low
uniformity between parts with the quality depending on the skill of the operator.
Higher performance parts can be created with the introduction of a vacuum bag to
cover the entire composite part so that uniform negative pressure can be applied to the
part thus reducing voids by pulling out air and volatiles formed during the curing process.
The composite laminate can be constructed of numerous layers of woven composite fiber
cloth with freshly applied wet epoxy or pre-preg sheets. This method introduces
additional waste and construction time as several layers of peel plies, bleeder plies,
breather plies, vacuum bag, and sealant tape are included with the composite laminate.
Each material serves a specific purpose within the laying up and bagging procedure,
which are critical steps influencing the quality of the finished part. The first step is to
apply a release coat on the mold for easy part removal. Peel plies help prevent surface
allowing air and volatiles a path to the vacuum ports as well as absorption of excess
epoxy. The vacuum bag and sealant tape create an airtight surface around the lay-up that
compresses the composite with atmospheric pressure when a vacuum is sustained in the
bag. The part can then be cured at room temperature or in an autoclave oven with
additional pressure applied to produce even higher fiber volume fractions, with additional
pressure forcing out more epoxy and gas.
Another common method of composite manufacture is known as resin transfer
molding (RTM) which is a wet impregnation process where resin and fiber layups are
introduced separately. The dry fiber reinforcement layers are placed in a two-sided mold
and epoxy resin is injected. The mold is filled with resin, forcing out air until the part is
completely wetted. The air exhaust and resin injection ports are sealed and heat is applied
to finish curing the part. The RTM method provides improved control over fiber
orientation over a wet hand layup, resulting in improved mechanical properties. A
modification of this method is known as vacuum assisted resin transfer molding
(VARTM), where the resin is pulled into the part via an applied vacuum. Since vacuum is
the driving force, one side of the mold can be replaced with a vacuum bag. Also, the
pressure differential on the mold is much smaller so the mold itself can be less
substantial. In wet lay-ups, VARTM, and pre-preg processes the composite material can
be constructed of chopped strand mats of short fibers or complex structures created by
stacking multiple layers of cloth like woven reinforcing fibers. Each individual layer can
be considered a lamina sheet with approximately 0.25 mm thickness. These lamina can
single fabric with two or more fiber directions. A stack of lamina forms a laminate with
the particular structural and material properties dependent on the orientation of each layer
In addition to solid laminates, the previous methods can also produce sandwich
composites where the laminate skins (face plates) are separated by a low density core
material. The main advantage in sandwich composite materials is to obtain a low-weight
high-stiffness structure. The bending stiffness is the product of the elastic modulus (E) and bending moment of inertia (I). For a rectangular cross section of width b and height
h, the moment of inertia about the axis parallel to the width through the mid-thickness is given by !ℎ!/12. The elastic modulus could be increased, resulting in a linear increase in
stiffness. A more efficient method to increase stiffness takes advantage of the parallel
axis theorem, where the centroid of the cross section is separated from the bending axis
by a distance d resulting in an additional inertia term. This additional term is the product of the cross sectional area and the distance from the neutral axis squared. This is
accomplished by separating strong but dense laminates from the neutral axis, which
dramatically increases the moment of inertia with relatively little added mass of the foam.
The bending stiffness and structure of an example sandwich structure with identical face
sheets is shown in Figure 1.5 with core stiffness, Ec, and face stiffness, Ef. The drawback
is that the compressive and tensile stress in the face sheets increases under bending as the
distance from the neutral axis increases. Thus, provided the skin separation and
attachment to core is maintained, the sandwich structure is stiffer and takes greater
advantage of the high strength fibers than an equivalent solid laminate. A number of
low-density core materials can be utilized, such as balsa wood, polymeric foam or polymeric
Figure 1.5: Schematic of sandwich structure and bending stiffness. Face sheet thickness tf
separated by distance d attached to a core of thickness tc
Sandwich composites are found in a range of industries, including transportation,
automobile, locomotive, naval, aircraft, and spacecraft. In using sandwich composites,
these industries are able to reduce weight and improve various traits, such as sound
transmission, fire suppression, or low magnetic signature. In locomotive applications,
sandwich composite structures are able to reduce weight by 44% per seat [30] compared
to the previous generation of conventional trains. There are also foams specifically
designed for locomotive transportation meeting stringent fire, smoke, and toxicity
requirements [31].
The aerospace industry has a relatively long experience with composite materials.
Improving the performance of aircraft and spacecraft often requires mass reduction while
retaining strength and stiffness, for which, sandwich composites are ideally suited. For
example, the control surfaces of large passenger aircraft such as Boeing’s 787 and
Airbus’ A380 are constructed of sandwich composites because they need to be stiff to
maintain their shape under wind load but light enough to be easily moved during flight.
Sandwich composites constructed of honeycomb core have been in use since the 1950s
and are a major component of modern aircraft and spacecraft. The heat shield of the
Apollo Crew Exploration Vehicle had to be light yet strong enough to withstand reentry !!
!!
!!
!
! = !!!"#$ = 2!!
!!!!
12 +
!!!!!
4 +!!
!!!! 12
loads and, to satisfy these requirements, was constructed of graphite-epoxy honeycomb
core sandwich composites. Major portions of the Space Shuttle Orbiter, such as the cargo
bay doors, are also constructed of honeycomb sandwich composites [32]. Composite use
in air and space vehicles is mainly driven by performance requirements. Most aerospace
components are constructed with the autoclave process to obtain the highest performance
parts. The additional pressure and heat in an autoclave increases the fiber volume fraction
of the finished parts and reduces void content, resulting in stronger, lighter components.
In naval ships, composites have been utilized extensively to reduce weight above the
waterline in bulkheads, deck houses, and helicopter hangers. Entire ship hulls are now
being created from composite materials such as the Visby class Corvettes in the Royal
Swedish Navy. Composite materials can also serve multifunctional roles by reducing
radar, magnetic, or thermal signatures. Additionally, there are cost savings as the total life
cycle cost of a composite ship is lower that an equivalent steel ship (since corrosion does
not affect composite ships, reducing maintenance costs over the life of the vessel). The
composites can be single skin laminates or sandwich structures, either honeycomb or
foam core, with glass, carbon, or Kevlar fibers. The manufacturing techniques in boat
construction include hand layup, sprayup, RTM, and VARTM [22]. When performance is
not the driving factor, the composite construction can be hand layup or sprayup onto an
open mold. For higher performance naval vessels, VARTM is the process of choice for
large components [33] with the parts cured at room temperature. The autoclave method is
not commonly utilized due to the large size of ship parts, but the fiber volume fraction
1.3.1
Failure modes and damage in composites
The superior mechanical properties possible with composites over homogenous
materials often justify the increased complexity in construction and design. The general
structure of fiber composites consists of strong reinforcing fibers held together within a
weaker matrix, with all the fibers in the same direction or woven together in multiple
directions. Usually, the fibers are strong but brittle compared to the surrounding ductile
matrix. Each fabric of unidirectional or woven fibers within a matrix is called a lamina.
When several laminas are stacked together it is called a laminate. The directional
properties of laminates can be tailored by adjusting the fiber directions in the layup
sequence of the various laminas.
Numerous experimental investigations attempting to characterize failure in composite
laminate structures have been performed over the years. Sun investigated failure of
quasi-isotropic laminates experimentally and analytically [34]. It was found that even though
the laminates were isotropic in stiffness they were quite anisotropic in strength, and that
conventional failure theories were inadequate, resulting in the need for new failure
criteria. Various failure modes were observed by Sun [35-37], including transverse
matrix cracking and delamination through the laminate thickness, and also predicted
strength and failure envelopes using Tsai-Hill failure models. Experimental failure
characterizations of laminates under compression have been well investigated by Waas
[38-42] where mechanisms of failure were characterized and used to illustrate the role of
various micromechanical parameters. Carlsson [43-45] investigated crack propagation in
laminates in both Mode I and Mode II starting with the design of test specimens and
composite laminates, numerical investigations are quite common. One example is the
work by Whitcomb [46] on delamination in compressed composite coupons using FEA
and fatigue testing to obtain delamination growth data. He found that the strain energy
release rate (Gc) dominates the growth process for the through thickness delamination
coupons he tested. Other numerical work by Whitcomb covers buckling of a sublaminate
[47] and debond growth under complex loading conditions [48].
Several models have been proposed to incorporate the experimental findings. Various
internal failure modes can be predicted within a composite laminate from a
micromechanics perspective. Micromechanics models are useful for predicting initial
failure and in providing insight into possible underlying failure mechanics of composite
materials. These models are usually limited to unidirectional composites, because adding
multiple fiber orientations results in less tractable problems. Focusing on modern
engineering fiber composites, a number of particular failure modes are possible including
fiber breakage, microcracking in matrix, debonding of fibers from matrix, fiber pullout,
and delamination of individual lamina [29]. Particular failure modes are expected under
different loading conditions. Under longitudinal tensile loading along the fiber direction,
failure modes include fiber breakage when the brittle fibers are stretched beyond the
failure strain, fiber pullout when the matrix debonds from the fibers (initiated at a stress
concentration), and shear failure along the fibers or through the matrix (often a result of
multiple cracks joining). Under compressive loading along the fiber direction, the failure
modes include transverse tensile fracture (when the transverse strain exceeds the strain
capability of the composite), microbuckling of the long slender fibers, and shear across
perpendicular to the fiber orientation, the failure modes are dominated by the weaker
matrix material, as the fibers are not directly loaded. In transverse tension, the failure
mode is through thickness matrix fractures which initiate at the stress concentrations
along each fiber. Under transverse compression, the usual failure mode is matrix shear
failure. Under in-plane shear loads, the usual failure modes are matrix shear or debonding
of the fibers from the matrix. Daniel [49] developed damage evolution predictions for
unidirectional composites based on experimental observation of the formation of
equi-distributed microcracks in the matrix. The analytical model derivation takes advantage of
the repeating structure within unidirectional composites. A unit cell of composite was
envisioned and the corresponding stress field in the fiber, matrix, and interface was
derived. Applying similar observations to cross ply (0/90) laminates produced analytical
models for stress in the two fiber directions as a function of crack spacing. For a given
applied stress, the expected crack spacing was predicted and agreed well with
experimentally observed crack densities in both the 0 and 90 directions.
Predicting failure using micromechanical models in composites can be accurate at the
local level in describing failure initiation at critical points. Extending these failure models
in a global sense provides only approximate predictions of failure progression in lamina
and laminates. Failure theories from a macromechanical point of view treat the lamina as
an anisotropic homogenous medium and are often more useful in predicting failure on a
larger scale. The failure behavior of a composite lamina is characterized by nine material
strengths: tension and compression strength in the warp (1) and fill (2) directions (F1t, F2t,
F1c, F2c), through thickness tensile and compressive strengths (F3t, F3c), in-plane shear
The sheer number of failure theories and lack of suitable and reliable experimental
data makes it difficult to state which theory is the ‘best’. In an attempt to test the various
models fairly Hinton, Soden, and Kaddour [50] conducted a collaborative study over 12
years known as the ‘Worldwide Failure Exercise’ for composite materials where various
theories were compared and validated. In the first part of this exercise, the creators or
proponents of the various different theories produced failure envelopes and stress-strain
curves for particular composite systems given only the basic lamina properties. This
round robin effort encompassed 12 theories and 14 different loading conditions. In the
second part, Hinton, Soden, and Kaddour [51] produced experimental results for the
particular composite systems and biaxial loading conditions which were then used to
evaluate the failure predictions from each theory.
There are a number of common failure theories proposed over the years and can
generally be classified into three groups [52]. The first group is known as limit or
non-interactive theories, where stresses in different directions do not influence the failure
load, such as maximum stress or maximum strain. The failure criteria for the maximum
stress model are constants: essentially the material strengths. The failure envelopes are
composed of straight line segments, forming either rectangular or parallelogram shapes.
Table 1.1: Maximum stress and strain failure criteria Normal stresses
!!! =!!!;!!! = !!!
!!! = !!!;!!! =!!!
!!! = !!!;!!! =!!!
Shear stresses
!!"= !!" =!!
!!" =!!" =!!
!!"= !!" =!!
The second group contains interactive theories such as Tsai-Hill and Tsai-Wu which
are essentially modified yielding theories from Hill’s 1948 model in metal plasticity [53]
potentially improved model for fiber composite yielding and failure by Christensen [54]
is stress based and attempts to derive the governing form from basic physical
postulations. Christensen’s model derives expressions for fiber- and matrix-dominated
failure in both Mode I and Mode II while also maintaining hydrostatic independence. The
combination of the two fracture modes produces a failure envelope with sharp corners
which is not captured in the Tsai-Wu model that does not make any failure mode
distinction. A recent micromechanical model by Oguni and Ravichandran [55] produces
failure envelopes that ma
![Figure 1.2: Theoretical non-dimensional pressure distributions along a rigid wedge entering water at a constant velocity, calculated from a similarity solution [11] for various wedge angles β where an abscissa -1 represents the vertex and 0 represents original water level](https://thumb-us.123doks.com/thumbv2/123dok_us/18729.1401/26.612.198.437.221.438/theoretical-dimensional-distributions-calculated-similarity-solution-represents-represents.webp)
![Figure 1.3: Typical pressure profiles at several panel locations during slamming event on an inclined 10 o rigid panel plunged into water at 3m/s, from [17]](https://thumb-us.123doks.com/thumbv2/123dok_us/18729.1401/30.612.139.492.216.445/figure-typical-pressure-profiles-locations-slamming-inclined-plunged.webp)
![Figure 1.4: Example of hydroelastic effect on sandwich panel deflection, from [21]. Accounting for hydroelastic effects resulted in decreased panel deflections](https://thumb-us.123doks.com/thumbv2/123dok_us/18729.1401/32.612.129.517.417.658/example-hydroelastic-sandwich-deflection-accounting-hydroelastic-decreased-deflections.webp)
![Table 1.4: Nondimensional failure modes for sandwich composite under three-point bending [81]](https://thumb-us.123doks.com/thumbv2/123dok_us/18729.1401/52.612.111.533.348.567/table-nondimensional-failure-modes-sandwich-composite-point-bending.webp)
![Table 1.6: Values of physical constants [100]](https://thumb-us.123doks.com/thumbv2/123dok_us/18729.1401/59.612.103.543.80.502/table-values-of-physical-constants.webp)
![Figure 2.1: Spectral emissivities of ultra flat black paint (Krylon 1602) samples measured at University of California, Santa Barbara (o) and JPL (solid line), and the effective emissivities of the MAS blackbodies (x) [115]](https://thumb-us.123doks.com/thumbv2/123dok_us/18729.1401/91.612.208.431.76.301/spectral-emissivities-university-california-barbara-effective-emissivities-blackbodies.webp)