Impact damage evolution under fatigue loading by InfraRed
Thermography on composite structures
C.Garnier1, 2, a, B. Lorrain2 and M.-L. Pastor3
1Daher-Socata, R&T department, 41401 Montrichard Cedex, France
2Université de Toulouse; ENIT; LGP, M2SP team, 65016 Tarbes Cedex, France 3ICA, IUT Tarbes, 65000 Tarbes, France
Abstract. This study deals with cumulative damage and its evolution in already impact damage composite structure. In order to follow the growing damage and to compare it with cumulative model, tests are monitored with an InfraRed thermography system. A carbon-epoxy composite is first low-energy impacted and then fatigued under tension-compression loading. This study also enables a very fast analysis of predicting the damage evolution coupling InfraRed Thermography as NDT method and InfraRed thermography as a following system.
1 Introduction
Even if the mechanical performance of composite materials give new perspectives for the aircraft and space design, the variability of their behaviour, linked to the presence of initial defects or led in service, constitute however a still important brake in their development. As regards particularly the response to fatigue loads or ageing, the behaviour of these materials is affected by several sources of uncertainties, which cause a large scatter in life time.
In aerospace industry, low energy impact phenomenon is not well known concerning composite materials and composite structures. These small impacts create some defects, on structure, that are not visible during general visual inspection (GVI). Under fatigue loading, they grow up and are propagated on the structure until the crack. In order to predict the crack of the structure, the damages and their evolution have to be detected. Non destructive tests are used. So, it is very important to develop qualitative and quantitative analysis and methodology in order to assess the safety and reliability of low energy impacted carbon fibre reinforced plastics under fatigue loading.
Many investigations were carried out from fatigue loading on composite structure and their behaviour [1-7]. Most of these investigations show that fatigue behaviour of composite structure is a complex phenomenon. Many factors act on this behaviour, such as the loading level, the frequency, etc. However, few studies take into account the worsening character of compression during fatigue loading. Most of the pre-cited works deal with tension-tension fatigue loading. But, when a fatigue cycle takes into account compression, local or global buckling shall appear [17] and initiate in a premature way damages.
a
e-mail: [email protected]
© Owned by the authors, published by EDP Sciences, 2010 DOI:10.1051/epjconf/20100642020
Concerning the damage development, many properties of the materials act on it. The inhomogeneous microstructure, where there are small disparate porosities or cavities on it, the stiffness or strength of the composite lead to complex damage development and to different modes of failure like delaminations, disbondings, fibre breakage, etc.
In order to detect all the defects and to analyse the failure facies, many different NDT methods were developed or adapted for composite structures (Ultrasonic Testing, IR Thermography, Spectroscopy, Speckle shearing interferometry, tomography) [8-12]. IR thermography, coupling to fatigue loading is a simply and a good way to follow the damage evolution [13-16].
Concerning low velocity impacted composite structure under fatigue loading, few studies are carried out. But some works were done on composite structure with hole [16] and its behaviour can be compared with impacted structure behaviour.
This paper presents fatigue tests on impacted carbon-epoxy composite under tension-compression loading. All the tests were followed by infrared thermography to characterize the damage evolution.
2 Experiments
2.1 Material
The used material is a carbon epoxy produced by the Liquid Resin Infusion process. The carbon fabric is the high strength fibre 5H satin G926 coupled with the epoxy resin RTM6. The weight distribution of the carbon fabric is 50% on the warp direction and 50% on the weft direction. The nominal weight is 370 g/m².
The lay-up of the specimens are [[45°/0°]3]s. All the specimens were controlled after production. A
control of the porosity rate was done and the average rate of porosity is under 2,5% in volume. [±45°]n Glass/epoxy tabs made from glass prepreg were done and bonded to the samples in order to
prevent matrix crushing or stress concentration due to pressure of the grips.
All the mechanical properties of this composite were carried out from tensile tests realised from a previous study. The ultimate tensile strengths are 787 MPa and 749 MPa for the warp direction and for the perpendicular direction respectively.
Table 1. Elastic properties of composite G926/RTM6.
E11 (GPa) E22 (GPa) G12 (GPa) G21(GPa) ν12 ν21
63.3 62.5 30.2 29.7 0.049 0.051
2.2 Specimen
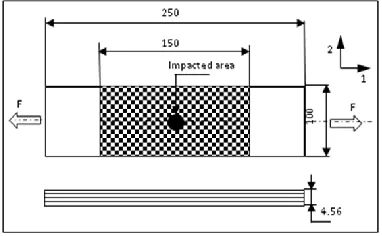
According to the standard specifications about fatigue and impact tests [18, 19], a new design of specimen was established. The useful part of the specimen allows the both tests (impact test and fatigue test).
Fig. 1. Specimen Geometry used for both tests
2.3 Impact test
Impact tests were performed with a MTT drop weight machine. A crosshead brake attached to the impactor is used in order to prevent multiple impacts. The used impactor has a hemispherical tap witch weights 3 kilograms. According to the standard specifications about fatigue and impact tests [18,19], a new design of specimen was established. The useful part of the specimen allows the both tests (impact test and fatigue test).
The chosen impact energy is defined to be smaller than BVID (Barely Visible Impact Damage). So the samples are impacted at 10 J.
Impact tester is as shown on figure 2.
Fig. 2. Impact test machine used for this study
2.4 Fatigue test
loaded in the Instron 1345 hydraulic fatigue machine having a 250 kN dynamic load cell. A load control of this tests was used.
The tension-compression fatigue cycle is defined as following: -R = -0.3
-Load level: 40% of the ultimate load -F = 2.5Hz
Where R is the load ratio and F is the frequency of the test.
The damage and temperature evolutions were monitored during the fatigue test using an Flir Titanium infrared camera with a sensitivity of 20 mk at 30°C. The thermal movies are recorded at 149 Hz in order to catch the maximum of data as possible. The test is carried out on a controlled temperature and hygrometry room. The protocol of the test is as follow on figure 3.
Fig. 3. Fatigue protocol
3 Results
3.1 Impact damage produced
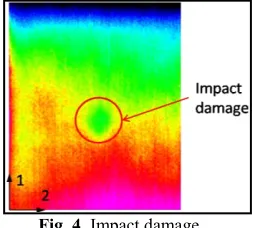
The 10J impact produced at the centre of the sample created some damages. Most common phenomena appearing during impact testing are matrix crack, delaminations, fibre breakage or fibre splitting at the back face of the specimen. In order to detect damages produced by impact, NDT method is used. For this case, Infrared thermography enables to detect the shape and the dimensions of the produced damage in a short time [14]. A thermal stress is sent to the sample by a halogen lamp. The thermal waves propagate on the material: it creates thermal gradient in it. Because of the difference of the two mediums (composite and defect) coefficient of emissivity, a thermal map is created by the IR sensor. During the heating time, the thermal movie reveals the damage, as shown on figure 4.
The defect produced on the material is quite hemispherical, like the impactor shape and measurements are 19 mm and 17,5 mm on the direction 1 and 2 respectively.
3.2 Damage evolution
3.2.1 General Visual damage evolution
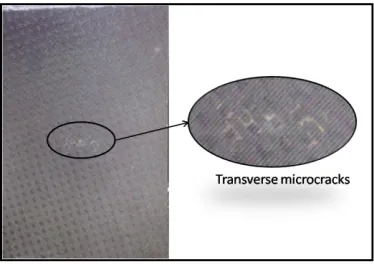
In this part, a sequence of all the visible mechanisms occurred during fatigue testing is presented. After impact, there is no visible indentation on the faces of the sample. After 100000 cycles, transverse cracks reached the front surface.
Fig. 5. Transverse microcracks on the front face
The microcracks area grows hardly after 200000cycles and just before failure, fibre breakage appears. After examining of failure, delaminations appears and are oriented on the same directions as fibre directions.
3.2.2 Damage evolution by IR thermography
One of the main output data is the evolution of the defect. First, a classical method used in Toubal’s work [16] consists in substracting two images caught at two different numbers of cycles. Then hot zones appear and reveal the damage evolution. In this work, the aim is to follow the damage evolution according to the fibre directions.
A new method, consisting in coupling NDT and IR-fatigue enables to have two informations in one image: the initial defect and its evolution during fatigue. NDT methods, as shown in cf 3.1 [14], enables having a thermal map of the defect produced by impact. Following the defect during tension-compression fatigue loading by Infrared thermography outputs a thermal map of the specimen at a known number of cycles.
Fig. 6. Substracting method
The damage evolution is followed by IR thermography. With the substracting method, impact damage evolution is performed as shown on figure 7.
Fig. 6. Evolution of the impact damage under fatigue loading by IR thermography
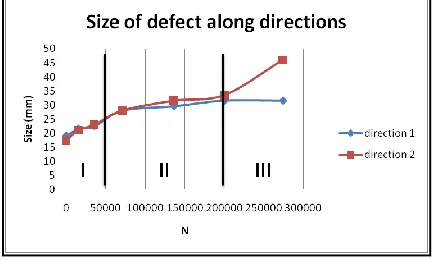
As showm of the figure 7, the damage mainly grows on the direction 2. In order to correlate with some other works [13], a plot of the size of the damage, for the two directions, is performed.
Fig. 7. Evolution of the size of the defect along directions
3 Conclusions
In this study, a tension-compression fatigue test on impacted composite was followed by IR Thermography.
These conclusions are performed :
-Impact test affects the indeed integrity of the structure
-The evolution of damage of a low-energy impacted composite correlate well with the cumulative damage trend of composite.
-The damage grows following the fibre directions and propagates more perpendicularly to the load.
A new method to follow damage evolution is performed by IR thermography. It couples NDT method with a real-time following of the fatigue test.
The substraction of the impact damage to all the IR movie gives 2 informations in the same time: -The size of the impact damage
-The growing directions of the damage
This study has to be completed in comparing datas obtained by IR thermography to residual mechanical properties of the damage composite. Moreover, a cumulative damage model for impacted composite must be carried out.
References
1. Reifsnider, KL, Lesko J, Case S. IUTAM - Symposium on Mechanics of Composite Material (1983); 399-420.
2. Talreja R, Yalvac S, Yats LD, Wetters DG. Transeverse cracking and stiffness reduction in cross-ply laminates of different matrix toughness. J of comp mat 1992; - 26(11): 1644-1663. 3. Gathercole N, Reiter H, Adam T, Harris B. Life prediction for fatigue of T800/5245
carbon-fibre composite : I. Constant-amplitude loading. Int J of Fatigue 1994; 16(8):523-532.
4. Mao H, Mahadevan S. Fatigue damage modelling of composite materials. Comp Struct 2002; 58:405–410.
5. Dzenis YA. Cycle-based analysis of damage and failure in advanced composites under fatigue: 1. Experimental observation of damage development within loading cycles. Int J of Fatigue 2003;25(6):499-510.
6. Gros XE, Bousigue J, Takahashi K. NDT data fusion at pixel level. NDT & E Int 1999;32(5):283-292.
7. Vary A. Acousto-Ultrasonics, In: Nondestructive testing of fiber reinforced plastics. Composites 1990;2:1-54.
8. Luong MP. Infrared thermographic scanning of fatigue in metals. Nucl Eng Des 1995;158:363-376.
9. Toubal L, Lorrain B, Karama M. Evaluation des déplacements et des déformations par photogrammétrie. 16ème Congrès Français de Mécanique 2003, Nice, France 1-5 septembre 2003.
10. Subramanian S, Reifsnider KL, Stinchcomb WW. A cumulative damage model to predict the fatigue life of composite laminates including the effect of a fibre-matrix inter phase. Int J of Fatigue 1995;17(5):343-351.
12. Chrysochoos A. Infrared thermography, a potential tool for analysing the material behaviour. Méca & Indust 2002;3: 3–14.
13. Toubal L. Analytical and experimental approaches of damage by fatigue of a carbon/epoxy composite. Ph.D. thesis, University Paul Sabatier, Toulouse III, 2004.
14. M.L. Pastor, C. Pescay and C. Garnier, ICCM17 (2009)
15. R. Steinberger, T.I. Valadas Leitão, E. Ladstätter, G. Pinter, W. Billinger, R.W. Lang,Int. J. of Fatigue, 28 (2006)
16. Toubal L., Karama M., Lorrain B.,Int. J. of Fatigue, 28 (2006)
17. Lachaud F., thèse de doctorat, Université Paul Sabatier Toulouse (1997)
18. Standard ISO 13003 : 2003- Plastiques renforcés de fibres -- Détermination des propriétés de fatigue en conditions de chargement cycliques