Original article
Validation of a method to predict hammer speed from cable force
Sara M. Brice
a,b,*
, Kevin F. Ness
a, Doug Rosemond
ba
School on Engineering and Physical Sciences, James Cook University, Townsville, QLD 4811, Australia
b
Movement ScienceseBiomechanics, Australian Institute of Sport, Canberra, ACT 6217, Australia
Received 11 January 2013; revised 10 April 2013; accepted 18 November 2013 Available online 24 January 2014
Abstract
Purpose: The purpose of this study was to develop and validate a method that would facilitate immediate feedback on linear hammer speed during training.
Methods: Three-dimensional hammer head positional data were measured and used to calculate linear speed (calculated speed) and cable force. These data were used to develop two linear regression models (shifted and non-shifted) that would allow prediction of hammer speed from measured cable force data (predicted speed). The accuracy of the two models was assessed by comparing the predicted and calculated speeds. Averages of the coefficient of multiple correlation (CMC) and the root mean square (RMS) of the difference between the predicted and calculated speeds for each throw of each participant were used to assess the level of accuracy of the predicted speeds.
Results: Both regression models had high CMC values (0.96 and 0.97) and relatively low RMS values (1.27 m/s and 1.05 m/s) for the non-shifted and shifted models, respectively. In addition, the average percentage differences between the predicted and calculated speeds were 6.6% and 4.7% for the non-shifted and shifted models, respectively. The RMS differences between release speeds attained via the two regression models and those attained via three-dimensional positional data were also computed. The RMS differences between the predicted and calculated release speeds were 0.69 m/s and 0.46 m/s for the non-shifted and shifted models, respectively.
Conclusion: This study successfully derived and validated a method that allows prediction of linear hammer speed from directly measured cable force data. Two linear regression models were developed and it was found that either model would be capable of predicting accurate speeds. However, data predicted using the shifted regression model were more accurate.
CopyrightÓ2014, Shanghai University of Sport. Production and hosting by Elsevier B.V. All rights reserved.
Keywords:Athletics; Force; Hammer; Measurement; Speed; Throwing
1. Introduction
In the hammer throw, the hammer undergoes projectile motion once it is released by the thrower. For this reason it is crucial for throw performance that the speed of the hammer at the instant of release is as large as possible. The athlete ac-celerates the hammer to its release speed by performing turns across the throwing circle during which time the hammer is
subjected to a force exerted by the athlete through the cable (cable force).1A single fluctuation in the linear hammer speed occurs within each turn and the magnitudes of these fluctua-tions vary between athletes.2
Brice et al.3observed a strong relationship (r¼0.87) be-tween the size of these fluctuations and the maximum angle the cable force acts at, relative to the linear velocity, in each turn. These findings suggest that during single support, a thrower could reduce the size of speed losses if they decrease the size of this angle. By reducing the size of the losses in speed the overall speed development will be enhanced which is crucial to throw success given the relationship that exists between release speed of the hammer and throw performance. Throughout a throw, the variation in the angle between the * Corresponding author. School on Engineering and Physical Sciences, James
Cook University, Townsville, QLD 4811, Australia.
E-mail address:[email protected](S.M. Brice)
Peer review under responsibility of Shanghai University of Sport.
ScienceDirect
Journal of Sport and Health Science 4 (2015) 258e262
www.jshs.org.cn
2095-2546/$ - see front matter CopyrightÓ2014, Shanghai University of Sport. Production and hosting by Elsevier B.V. All rights reserved.
cable force and linear velocity is not large3 and it may be difficult for an athlete and/or coach to assess how technique alterations are affecting this angle. The only accurate way to assess whether an athlete is reducing the maximum size of this angle is to directly measure the angle or monitor the associated losses in hammer speed.
Currently angle and linear speed can only be accurately determined from hammer head positional data. Automatic tracking is the quickest method that could be used to collect this positional data. However, this is time consuming, and post-processing is required and immediate feedback in the training environment is not possible via this method. For an athlete to be able to improve technique it is vital to have ac-curate information about their performance and any delay in providing the information reduces the likelihood that the athlete will be able to make effective use of the feedback.4 Therefore, it would be highly beneficial if there were a method that allowed accurate feedback in the training envi-ronment on the behavior of the linear hammer speed. This would allow an athlete and coach to ascertain if technique alterations are beneficial or detrimental.
It is also possible to attain accurate linear hammer speed data via utilisation of its relationship with the instantaneous radius of curvature and the centripetal force. The relationship that exists between centripetal force (F), linear velocity (v) and instantaneous radius of curvature (r) is given by,
F¼mvr2 ð1Þ
where m is the mass of the hammer. The mass term in the above equation is the only constant. Therefore, in order to attain accurate linear speed data via the above equation, both the centripetal force and radius of curvature would need to be directly measured throughout the throw.
Murofushi et al.5have previously presented a method that uses the above relationship along with the relationship be-tween linear and angular velocity to determine linear hammer speed and radius of curvature during the throw. This measuring system added a total mass of 0.37 kg to the hammer and consisted of two strain gauges, that measured the cable force (not centripetal force), and two single axis accelerome-ters that were used to determine the angular velocity. There was good agreement between the measured linear speed and the speed calculated from hammer head positional data. However, there was an obvious phase lag between the two data sets. It was hoped that in this current study a more accurate method could be developed to determine hammer speed that would eliminate the phase lag observed in the data set of Murofushi et al.5In addition, it was hoped that a measuring device that added negligible mass to the hammer system could also be utilized.
Brice et al.6have previously reported an alternate method to directly measure cable force magnitude in the training environment. This system added negligible mass to the hammer system and consisted of a single strain gauge mounted directly on the hammer’s cable. An average error
3.8% for a force of 2000 N when compared with cable force derived from hammer head positional data was reported. It is important to note that the cable force itself is not equal to the centripetal force. The cable force consists of three compo-nents: normal, radial, and tangential to the instantaneous circle of rotation.2,7 The radial component is considerably larger than the other two components and it is nearly equal to the centripetal force acting on the hammer. Due the complex motion of the hammer during the turns it is not possible to derive a simple, usable expression relating the hammer speed to the cable force. However since the cable force is by far the largest contributor to the centripetal force in Equation (1), it was thought that the measurement system described above could be used in conjunction with a regression model to pre-dict speed squared from cable force.
The purpose of this study was to investigate whether the relationship between the cable force and squared linear hammer speed could be used to develop a model that would allow speed to be predicted from measured cable force in the training environment. This type of information could be uti-lized by the athlete and coach to assess if changes in technique are reducing or increasing the losses in speed that occur within each turn.
2. Materials and methods
Five male (height: 1.88 0.06 m; body mass: 106.23 4.83 kg) and five female (height: 1.69 0.05 m; body mass: 101.6020.92 kg) hammer throwers participated in this study. Each participant was in the competition phase of the Australian athletics domestic season and was competing at the open national level. Prior to data collection, all participants gave written informed consent to participate in this study which was given ethical approval by the James Cook Uni-versity Human Ethics Committee and the Australian Institute of Sport Ethics Committee.
Participants were required to perform 10 throws with hammers instrumented with a strain gauge device (sampling at 500 Hz), previously described by Brice et al.6 This device measured the cable force throughout each throw (measured force). Retro-reflective markers were positioned on the ham-mer’s cable at known distances from the centre of the hamham-mer’s head. A 21 infra-red camera system (Oxford Metrics, Oxford, UK) sampling at a frame rate of 250 Hz was used to collect the marker three-dimensional coordinate data. All video footage were post-processed using the Vicon Nexus software suite (Oxford Metrics). All marker positional data were filtered using the same filter level reported by Brice et al.3Positional data were then used in conjunction with direction cosines to determine the three-dimensional coordinate data for the centre of the hammer’s head. These positional data were used to calculate hammer linear velocity (calculated speed) and cable force (calculated force).3 All calculated and measured force data were normalised for hammer weight to account for the fact that males use a heavier hammer than females.
The calculated speed data and calculated force data were used to develop these regression models. All calculated speed data used in the regression model development were squared due to the mechanical relationship that exists between centripetal force and linear velocity squared (Equation(1)).
The first regression model was derived from the square of the calculated speed and the calculated force (non-shifted regression). While the second model was derived from the square of the calculated speed and a time shifted calculated force (shifted regression). The shifted regression model was developed because earlier work showed a phase lag between speed and cable force3and it was thought that accounting for the phase lag in the model development may lead to a model that would produce speed data that were more accurate. As the magnitude of this phase lag varies depending on turn number, throw, and athlete, it is not possible to apply the same time shift to every throw. It was therefore decided to time shift the calculated force such that for each throw the final peaks in the calculated force and calculated speed coincided. This time shift was applied to ascertain if removal of the phase lag resulted in a more accurate regression. As only the final peaks were aligned, there was no change in the frequency of the force data.
The calculated speed and calculated force data used to calculate the shifted regression were also trimmed as the final peak in the calculated force data occurred prior to release whereas the final peak in speed occurred at release. The calculated force data were trimmed so that the final peak was the final data point and the calculated speed data were trimmed by the same amount at the start. This was done so that both data sets were the same size.
A shifted and non-shifted regression equation was devel-oped for each of the participant’s 10 throws and all data points of each throw were used to develop these equations. The MATLAB software suite (The Mathworks, Natick, MA, USA) was used to determine the regression equations and they in-tercepts for both were also forced through (0,0) since Equation (1) predicts zero speed for zero force. Averages of the gradi-ents of the two linear regression equations were determined for the cohort.
The shifted and non-shifted regression models were then used to predict speed squared from measured force data and the square root of these squared speed data was taken to determine linear hammer speed (predicted speed). It was ex-pected that the predicted speed data would closely agree with the magnitude of calculated speed for each trial. However, it was expected that the phase lag that exists between cable force and linear hammer velocity, previously described above, would still be evident in the predicted speed data resulting in peaks in the predicted speeds not coinciding with those in the calculated speeds.
The calculated force and measured force data are in phase; therefore the phase lag described above is also present between the calculated speed and the measured force. To reduce the effect of the phase lag, all measured force data were also time shifted and trimmed so that the final peak in the measured force coin-cided with release. As with the calculated force, the magnitude of
the phase lag varies depending on turn number, throw, and athlete, so it is not possible to apply the same time shift to every throw. It was hoped that using measured force data that are time shifted would result in predicted speed data that were more closely matched to both the magnitude and waveform of the calculated speeds than if the time shift were not applied.
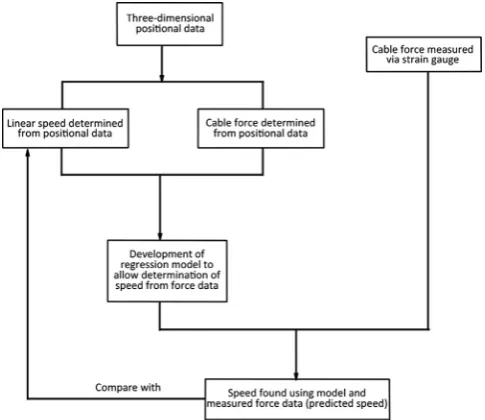
The predicted speed data were then compared with the calculated speed data to ascertain the level of accuracy. The root mean square (RMS) of the differences was determined to compare the closeness in magnitude between the predicted and calculated speeds for each throw of each participant.8These RMS values were then used to determine the average RMS values for the entire group. The average RMS difference be-tween the calculated and predicted release speeds was also determined. The coefficient of multiple correlation (CMC) was determined to assess the closeness in the shapes between the predicted and calculated speed waveforms for each throw of each participant.8,9 The average CMC values was then determined for the entire group. A schematic of the process outlined here is shown inFig. 1.
3. Results
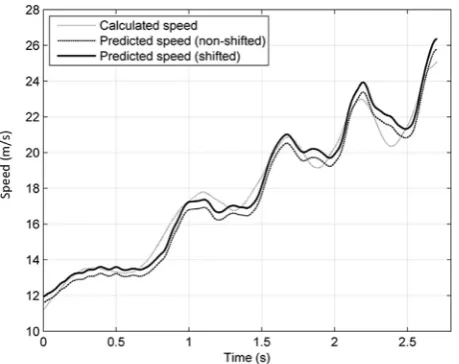
The regression equations, CMC and RMS values of the two models are similar (Table 1). Both models give high CMC values (0.96 and 0.97). In addition, the reported RMS values of 1.27 m/s and 1.05 m/s are relatively low for the non-shifted and shifted models, respectively. In addition, the average percentage difference between the calculated speeds and the speeds determined via the non-shifted and shifted models were 6.6% and 4.7%, respectively.
[image:3.595.306.549.511.721.2]For the release speed, the RMS differences between the calculated and predicted values are 0.69 0.49 m/s and 0.46 0.34 m/s for the non-shifted and shifted models, respectively.
4. Discussion
The magnitudes of the predicted speeds found using the two regression models were similar to the magnitudes of the calculated speeds as the RMS values were both low (Table 1). The shifted model gives both lower overall RMS difference in speeds and in particular lower RMS difference in release speed. The waveforms of the predicted speeds were also similar to the waveforms of the calculated speeds as the CMC values for both were close to one which indicates similarity between the shapes of the waveforms9(Table 1,Fig. 2). It is therefore feasible that either model could be used. However, the slightly lower RMS values of the shifted model indicates that the shifted model predicts speed data that are, on average, slightly more consistent. In addition, if athletes and coaches wish to quantify release speeds in the training environment they should utilize the shifted model as the predicted release speeds are more accurate than those found using the non-shifted model.
The calculated speeds exhibit simple maxima and minima behavior (Fig. 2). Both the measured and calculated force data also exhibit simple maxima behavior. However, the behavior of the measured and calculated force data in the trough regions is more complicated.6There are small fluctuations present in the trough regions that are consequently observed in the predicted speed data (Fig. 2). As a result, there is more error associated with the trough regions of the predicted speed data. This is a
limitation that could potentially be an issue for athletes and coaches if they are quantifying the size of the fluctuations in the speed. In addition, there is also error resulting from use of the strain gauge device itself. The magnitude of this error has been previously reported in the literature.6
The regression model developed in this study is a model between velocity squared and cable force, based on Equation (1). Implicit in this model are two assumptions and therefore sources of error. Firstly, the model assumes that the cable force is major contributor to the centripetal force throughout the throw. Secondly, the model assumes that the velocity is determined only by the cable force and therefore the effect of changes in the instantaneous radius of rotation on the velocity has been ignored. Both of these assumptions will degrade the goodness of the fit of the model. However, both assumptions have been validated given the strong correlations and rela-tively low RMS differences between the predicted and calculated velocities.
Time shifting the measured force data resulted in predicted speeds that had peaks and troughs that lined up closely with the peaks and troughs in the calculated speeds. Whilst applying a time shift to each throw reduced the effect of this time lag, it did not completely eliminate it. Athletes and coaches need to be aware of this limitation when using this type of device in the training environment. Whilst the phase lag was not completely eliminated from the predicted speeds its effect was minimized and the remaining phase lag in the predicted speeds was less than the phase lag evident in the data set of Murofushi et al.5This phase lag is not an issue if the predicted speed data are the only variable being provided for feedback. However, biomechanists will often utilize video feedback in conjunction with feedback on kinetic and kine-matic variables such as speed. As a result, it is important to minimize the phase lag here as peaks and troughs in the pre-dicted speed data will more closely match up with the timing of the video if it is minimized.
5. Conclusion
This study successfully derived and validated a method that allows prediction of linear hammer speed from measured cable force data. Two linear regression models were developed and it was found that either model would be capable of predicting accurate speeds. However, data predicted using the shifted regression model were more accurate. In addition, the method proposed here accounted for the phase lag in the speed data that was evident in data presented in previous studies5 that attempted to measure linear hammer speed in the training environment.
Acknowledgment
[image:4.595.42.296.121.158.2]The authors wish to thank Mr. Mark Davis for the technical development and support with this study and the staff of the Biomechanics Stream of the Australian Institute of Sport Movement Sciences Discipline for their assistance with the data collection for this study.
Table 1
Regression equations used to predict speed squared from normalized measured force data, the coefficient of multiple correlation (CMC) and the root mean square (RMS) of the difference between the calculated speed and the predicted speed (meanSD).
Gradient yintercept CMC RMS (m/s) Non-shifted 16.350.48 0 0.960.05 1.270.65 Shifted 17.080.59 0 0.970.04 1.050.59
[image:4.595.55.285.538.720.2]References
1. Dapena J, Feltner ME. Influence of the direction of the cable force and of the radius of the hammer path on speed fluctuations during hammer throwing.J Biomech1989;22:565e75.
2. Dapena J. The pattern of hammer speed during a hammer throw and in-fluence of gravity on its fluctuations.J Biomech1984;17:553e9.
3. Brice SM, Ness KF, Rosemond D. An analysis of the relationship between the linear hammer speed and the thrower applied forces during the hammer throw for male and female throwers. Sports Biomech
2011;10:174e84.
4. Sanderson LK, McClements JD, Gander RE. Development of apparatus to provide immediate accurate feedback to sprinters in the normal training environment.New Stud Athlet1991;6:33e41.
5.Murofushi K, Sakurai S, Umegaki K, Kobayashi K. Development of a system to measure radius of curvature and speed of hammer head during turns in hammer throw.Int J Sport Health Sci2005;3:116e28.
6.Brice SM, Ness KF, Rosemond D, Lyons K, Davis M. Development and validation of a method to directly measure the cable force during the hammer throw.Sports Biomech2008;7:274e87.
7.Tutevich VN.Teorija sportivnych metanij[Theory of the throwing events]. Moscow: Fizkultura i Sport; 1969. [in Russian].
8.Mayagoitia RE, Nene AV, Veltink PH. Accelerometer and rate gyroscope measurement of the kinematics: an inexpensive alternative to optical mo-tion analysis systems.J Biomech2002;35:537e42.