Phonics screening
Check Evaluation:
Final report
Research report
June 2015
Matthew Walker, Marian Sainsbury, Jack Worth,
Heather Bamforth & Helen Betts
Contents
List of figures 4
List of tables 5
Executive summary 6
1. Introductions 12
1.1 Overview 12
1.2 The Phonics Screening Check 12
1.3 Aims of the evaluation 13
1.4 Methodology 14
1.5 The profile of research participants 19
1.6 Analysis and reporting 19
2. The impact of the check on pupil attainment and progress in literacy 21
2.1 Attainment scores from the National Pupil Database 22
2.2 Revisiting NFER’s typology of schools 30
2.3 Multilevel modelling 34
3. The impact of the check on the teaching of phonics and the wider literacy curriculum37
3.1 Schools’ phonics teaching practices 38
3.2 Teachers’ views on phonics and literacy teaching 48
3.3 Teachers’ views on the value of the check 50
4. What has been learnt from the national roll out of the check 53
4.1 Schools’ preparation for the check 54
4.2 Administration of the check 54
4.3 Costs associated with the check 58
4.4 Evidence on the suitability of the check with different groups of learners 61
5. Conclusions 64
5.1 Summary of findings in relation to the evaluation’s research questions 64
5.2 Conclusions 67
List of figures
Figure 1: Distribution of PSC scores by year 24
Figure 2: Distribution of PSC scores for each point on the EYFSP CLL scale 25
Figure 3: Value added 2011-2014, controlling for known background factors 28
Figure 4: Progress in literacy of different attainment groups, 2011-2014 29
List of tables
Table 1: Survey response rates 15
Table 2: Representation of participating primary schools compared to schools nationally
(based on responses to Year 1 teacher survey) 16
Table 3: Selected characteristics of the 19 schools involved in the case study phase of
the evaluation in 2014 18
Table 4: Profile of staff responding to the literacy coordinator questionnaire 19
Table 5: National results on the PSC 22
Table 6: Mean national scores at KS1 and EYFSP, 2011-2014 27
Table 7: Quintiles of literacy attainment 29
Table 8: Multilevel model outcomes: impact of school type on PSC and KS1 scores 35
Table 9: Teacher reports of their school’s approach to phonics teaching: 2012, 2013
and 2014 39
Table 10: Proportion of literacy coordinators reporting specific changes to phonics teaching in Reception, Year 1 and Year 2 during the 2013/2014 school year 41
Table 11: The actions taken to use the results of the phonics screening check 45
Table 12: Evidence used to decide if and/or what type of extra support should be
provided to a child 46
Table 13: Support offered to Year 2 pupils who undertook the check in 2013 47
Table 14: Teachers’ views about phonics as an approach to teaching reading 48
Table 15: Department for Education one-off costs associated with the phonics
screening check 58
Table 16: Department for Education on-going costs associated with the phonics
screening check 59
Table 17: Year 1 teacher views of the standard of the check in 2012, 2013 and
Executive summary
Introduction
This is the final report from the evaluation of the phonics screening check (PSC), commissioned by the Department for Education (DfE) and undertaken by the National Foundation for Educational Research (NFER). The check was introduced for the first time in 2012 and is taken by all children in Year 1, unless their teachers make the judgement to disapply1 them. It consists of an individual, oral assessment requiring the reading of
words and pseudo-words2. Since 2013, Year 2 pupils who do not meet the expected
standard in Year 1 are reassessed.
This report provides an overview of participating schools’ phonics teaching practices. The report explores whether there is any evidence that the introduction of the check has had an impact on the standard of reading and writing. It also highlights any changes in schools’ practices since 2012, when the check was first introduced. It draws on data collected from case study interviews and surveys with literacy coordinators and Year 1 teachers over three time points between 2012 and 2014. In 2014, this included interviews with staff in 19 primary schools and endpoint surveys of 573 literacy coordinators and 652 Year 1 teachers in schools. The most recent round of data collection commenced the week following the administration of the check in June 2014.
Scope of the evaluation
The evaluation has two main aims:
1. To explore whether issues raised in the 2011 pilot evaluation3 have been
addressed, specifically:
• the confidence of teachers in the administration of the screening check and how schools have prepared for it
• the appropriateness of the screening check for specific groups of pupils (specifically, those with Special Educational Needs (SEN) and English as an Additional Language (EAL))
1 Children who are working well below the level of the screening check (for example, if they have shown no
understanding of letter-sound correspondences), can be disapplied so they do not take part.
2 Pseudo-words or non-words are included in the PSC because they will be new to all pupils. The rationale
is that pupils who can read pseudo-words should have the skills to decode almost any unfamiliar word.
3 DfE recruited 300 primary schools to take part in piloting the PSC in 2011. The process evaluation report
from the pilot can be found at:
https://www.gov.uk/government/uploads/system/uploads/attachment_data/file/182621/DFE-RR159.pdf
2. To identify and track the impact of the check on teaching and learning, including:
• understanding the impact of the teaching of phonics in primary schools
• assessing the impact of the PSC on teaching of the wider literacy curriculum
• quantifying the impact of the check on the standard of reading and assessing its value for money
Methods
In Year 3 of the evaluation (2014) interviews were undertaken with senior school leaders, literacy coordinators, Year 1 and Year 2 teachers, Reception teachers and parents and carers in 19 case study schools. The schools were randomly selected to capture a diverse geographical spread, as well as diversity in terms of size, school type, and the proportion of pupils in receipt of free school meals (FSM), with special educational needs (SEN), and who have English as an additional language (EAL). Survey responses were collected from 573 literacy coordinators and 652 Year 1 teachers. Analysis of the school characteristics of those teachers responding to the surveys, such as key stage 1
performance band and the proportion of pupils eligible for FSM, revealed that
respondents were from schools that exhibited broadly similar characteristics to primary schools nationally. Given this, the sample sizes achieved are large enough to detect statistically significant differences. Where appropriate, comparisons are made to
responses collected in Years 1 and 2 of the evaluation4. Data collection commenced the
week beginning 23rd June 2014, the week after the administration of the check. An
analysis of results from the National Pupil Database (NPD) was also undertaken. This involved a comparison of national results on the PSC, with results for the same pupils one year earlier, on the Early Years Foundation Stage Profile (EYFSP), and one year later, at the end of key stage 1.
A number of methodological limitations have been recognised throughout the reporting of this evaluation. Because the PSC was introduced into all schools nationally at the same time, it was not possible for the study design to include a comparison group. Further, the PSC was introduced as an addition to a number of phonics policies which were already in place. Because of these limitations, it is impossible to ascribe any findings conclusively to the presence of the PSC, and the reporting below recognises this.
4 The methods used in the first and second year of the evaluation included interviews with senior school
leaders, literacy coordinators, Year 1 and 2 teachers and Reception teachers. In 2012 (Year 1),
interviews were undertaken with staff in 14 case study schools and survey responses were collected from 844 literacy coordinators and 940 Year 1 teachers:
https://www.gov.uk/government/uploads/system/uploads/attachment_data/file/198994/DFE-RR286A.pdf In 2013 (Year 2) interviews were undertaken with staff in 19 case study schools and survey responses were collected from 583 literacy coordinators and 625 Year 1 teachers:
https://www.gov.uk/government/uploads/system/uploads/attachment_data/file/307229/Evaluation_of_the_ phonics_screening_check_second_interim_report_FINAL.pdf
Key Findings
The impact of the check on pupil attainment and progress in literacy
• Analysis was undertaken of national results on the PSC, together with results for the
same pupils one year earlier, on the Early Years Foundation Stage Profile (EYFSP), and one year later, at the end of key stage 1. The evaluation did not find any
evidence of improvements in pupils’ literacy performance, or in progress, that could be clearly attributed to the introduction of the PSC. However, no conclusive
statement can be made because of the methodological limitations described above.
• Phonics attainment, as measured by the proportion of pupils reaching the expected standard on the check, improved over three years and there is some evidence that this may have been an impact of the introduction of the check.
• Pupils are unlikely to reach the expected standard in reading and writing at the end
of key stage 1 without being able to demonstrate the phonics skills measured by the PSC.
Phonics teaching practices and views on phonics teaching
• Teachers have been consistently positive about phonics as an approach to
teaching reading throughout the three year evaluation. For example, more than half of the literacy coordinators surveyed in 2014 (58 per cent) agreed with the
statement ‘I am convinced of the value of systematic synthetic phonics teaching’. In the majority of schools, however, it appears that other strategies alongside phonics are also supported. For example, in 2014, 56 per cent of literacy coordinators reported that ‘phonics is taught discretely alongside other cueing strategies’ or that ‘phonics is always integrated as one of a range of cueing strategies’.
• There is evidence that the introduction of the PSC has led to schools making changes to their phonics teaching and classroom practice in each and every year of the evaluation. Just under half of the literacy coordinators surveyed in 2014 reported doing so (48 per cent), compared with 56 per cent in 2013 and 34 per cent in 2012 (in 2012 the question concerned changes made in anticipation of the
check).
• The most frequently reported change by survey respondents in 2014 was
increasing the pace of phonics teaching, and this finding was supported by data drawn from the case studies. As in 2013, an increased focus on pseudo-words was also reported by participants in the survey and case studies, as well as increased assessment of phonics. Analysis did not determine what form this increased focus took.
• In terms of use of the results of the previous year’s check, literacy coordinators
check results primarily for reviewing and revising phonics teaching plans for
individuals and groups. Teachers reported using evidence from the check to make decisions about extra support for individuals, alongside their own records of
assessment.
• For those children who had not met the standard in 2013, the most frequent type of support provided was to continue with systematic phonics teaching; this was
followed by intensive learning in small groups. Teachers’ views on the value of the check
• Despite the evidence above that the results of the check were used for a variety of purposes within schools, when asked directly, less than 30 per cent of literacy coordinators agreed with the statements ‘The phonics screening check provides valuable information for teachers’ and ‘The phonics screening check provides valuable information for parents/carers’. The case study evidence suggested that the reason for this was a view that check results do not reveal anything of which teachers are unaware.
• Year 1 teachers were more positive, with just over half (53 per cent) reporting that the check gave them useful information ‘to a great extent’ or ‘to some extent’. These responses were also more positive than in 2013.
What has been learnt from the national roll out of the check
• Most teachers reported they undertook less preparation for the check this year than
they did when it was first introduced. The most frequent form of preparation, as captured in the literacy coordinator survey, was individual familiarisation with the DfE Check Administrators’ Guide5. A quarter of responding Year 1 teachers reported undertaking no specific preparation for the check in 2014.
• Fewer Year 1 teachers reported having to stop the check early this year (2014: 41 per cent) than was the case last year (2013: 46 per cent). Of those that had to stop early, the majority reported finding it ‘quite’ or ‘very easy’ when making a decision to do so (85 per cent).
• Survey findings suggest that less than half of participating Year 1 teachers had to
disapply children from the check. As the check becomes embedded into school practice it seems that schools feel more secure in their expectations and in the disapplication process.
• The costs associated with the introduction of the check and its on-going annual cost to schools and central government are around £400-500 per school, or £10-12
5 https://www.gov.uk/government/publications/check-administrators-guide-phonics-screening-check-2014
[23/02/15]
per pupil. The largest on-going cost for schools is for supply cover while the check is administered, at £150 per school, or £3 per pupil.
• There is evidence that over the last three years teachers have become more
familiar with and accepting of the standard of the check. In 2014, more than three quarters of Year 1 teachers (77 per cent) reported that the standard of the check ‘was about right’ (an increase of 33 percentage points since 2012).
• Over the course of the study, a small number of respondents have expressed concerns that the check disadvantages higher achieving readers. However, as reported in Chapter 2, the analysis of the NPD data found no identifiable pattern of poorer performance on the check than expected in those children who are already fluent readers.
• The findings from the surveys suggest that most schools provide some sort of
information to parents/carers prior to the administration of the check. Most schools communicate the outcomes of the check to parents/carers via end-of year pupil reports. A smaller proportion of literacy coordinators reported that additional information was given to parents/carers in 2014 , both in terms of details of the in-school support planned (39 per cent in 2014; 50 per cent in 2013; 61 per cent in 2012), and in terms of information regarding how parents/carers can support their child (43 per cent in 2014; 59 per cent in 2013; 73 per cent in 2012).
Conclusions
This three-year evaluation has tracked developments in schools from the first national introduction of the PSC in 2012 to the current, 2014, round. Over this period,
teachers’ responses suggest that most of them now see the standard of the check as appropriate. Teachers have integrated information from the check with their other records of children’s progress in phonics. Its introduction has required administrative effort in schools and gives rise to some, relatively low, costs in terms of time or resources. Little training is now required for teachers and many are familiar with the procedures for the check.
To assess whether its introduction also had impacts on pupils’ learning is more difficult, as the national introduction of the check made it impossible to have a control group. A further complexity concerns the date of implementation of the PSC. It was introduced for the first time nationally in 2012, but was piloted in 2011. Awareness of the proposed introduction of the check may have given rise to a heightened emphasis on phonics in schools prior to its national introduction. The process evaluation of the pilot (Coldwell et al, 2011) found that the sample of schools in the pilot were already making some changes to their phonics practice.
1. Introduction
1.1 Overview
This is the final report from the evaluation of the Phonics Screening Check (PSC), commissioned by the Department for Education (DfE) and undertaken by the National Foundation for Educational Research (NFER). This report provides an overview of participating schools’ phonics teaching practices, and explores whether there is any evidence that the introduction of the check has had an impact on the standard of reading and writing. It also highlights any changes in schools’ practices since 2012, when the check was first introduced. It draws on data collected from case study interviews and surveys with literacy coordinators and Year 1 teachers over three time points between 2012 and 2014. In 2014, this included interviews with staff in 19 primary schools and endpoint surveys of 573 literacy coordinators and 652 Year 1 teachers in schools. The most recent round of data collection commenced the week following the administration of the check in June 2014.
1.2 The Phonics Screening Check
A number of research studies, most recently in this country Torgerson et al. (2006)6,
attest to the effectiveness of systematic phonics programmes in early literacy teaching. Similarly, the Ofsted report ‘Reading by Six’7 emphasises the importance of ‘diligent,
concentrated and systematic teaching of phonics’ in successful early literacy.
The government is committed to ensuring high quality teaching of phonics in primary schools and promoting the use of systematic synthetic phonics in the teaching of early reading, and has produced a set of criteria for high quality phonic work, presenting the key features of an effective, systematic, synthetic phonics programme. This envisages phonics as ‘the prime approach to decoding print, i.e. phonics ‘first and fast’ approach’. It specifies that children should ‘apply phonic knowledge and skills as their first approach to reading and spelling even if a word is not completely phonically regular’ and notes that ‘children should not be expected to use strategies such as whole-word recognition and/or cues from context, grammar, or pictures’. This guidance fits within a context where
phonic work is seen not as one of a range of optional methods or strategies for teaching reading but as a body of knowledge and skills about how the alphabet works, which all children should be taught. The guidance to use synthetic phonics was given in the Rose Review (2006), and phonics first and fast was the method outlined in Letters and Sounds
6 Torgerson, C.J., Brooks, G. and Hall, J. (2006). A Systematic Review of the Research Literature on the
Use of Phonics in the Teaching of Reading and Spelling, DfES Research Report 711, London: DfES.
7 Office for Standards in Education (2010). Reading by Six: How the Best Schools Do It. London: Ofsted.
in 2007. The check and the matched funding provided by the government from 2011 to 2013 were aimed at supporting and reinforcing the use of systematic synthetic phonics.
The new national curriculum programmes of study for English (DfE, 2013)8 reflect the
government’s commitment to ensuring pupils are taught phonic knowledge and skills. Word reading makes up one of the two dimensions of reading (alongside
comprehension) and the word reading requirements for Year 1 pupils consist entirely of phonic skills. The programmes of study state that pupils should ‘apply phonic knowledge and skills as the route to decode words’ and also make clear that ‘phonics should be emphasised in the teaching of reading to beginners’.
Since the 2010 Schools White Paper9, there has been a clear commitment to ensure that
the teaching of phonics is firmly established in the first years of school. This is supported by the core criteria for phonics programmes and also by a stronger focus in Ofsted inspections. The PSC, which was piloted in 300 schools in the summer of 2011, is now statutory and complements these as a central strand of policy implementation.
The purpose of the PSC is to confirm whether individual pupils have learnt phonic decoding to an expected standard. Since June 2012, the check has been administered annually to all Year 1 pupils in maintained schools, academies and free schools. It aims to identify the children who need extra help so that they are given support by their school to improve their decoding skills10. Since 2013, children not reaching the expected
standard in Year 1 have been re-taking the check at the end of Year 2 so that schools can monitor progress in phonic decoding through to the end of key stage 1.
1.3 Aims of the evaluation
The evaluation has two main aims:
1. To explore whether issues raised in the 2011 pilot evaluation have been addressed, specifically:
• the confidence of teachers in the administration of the screening check and how schools have prepared for it
• the appropriateness of the screening check for specific groups of pupils
(specifically, those with Special Educational Needs (SEN) and English as an Additional Language (EAL))
8 https://www.gov.uk/government/publications/national-curriculum-in-england-english-programmes-of-study 9 https://www.gov.uk/government/publications/the-importance-of-teaching-the-schools-white-paper-2010 10 This involves: recognising the sounds that each individual letter makes; identifying the sounds that
different combinations of letters make (such as ‘sh’ or ‘oo’); and blending these sounds together to make a word.
2. To identify and track the impact of the check on teaching and learning, including:
• understanding the impact of the teaching of phonics in primary schools
• assessing the impact of the PSC on teaching of the wider literacy curriculum
• quantifying the impact of the check on the standard of reading and assessing its value for money
Specifically, in this third and final year, the evaluation aims to explore the following research questions:
• What has been the impact of the check on the teaching of phonics in primary
schools during Reception and Years 1 and 2?
• Has the PSC changed the teaching of the wider literacy curriculum?
• Has the introduction of the PSC had an impact on the standard of reading and
writing?
This will add to the evidence on the research questions already addressed in the first two interim reports:
• How suitable is the check for specific groups of pupils?
• How did teachers identify the children who were disapplied from the check?
• What use has been made of phonics training and classroom materials for the teaching of phonics?
• How have schools communicated with parents/carers about the check?
1.4 Methodology
The methods used in this year of the evaluation include in-depth qualitative research with senior school leaders, literacy coordinators, parents and carers and Year 1 and 2
teachers in 19 primary schools, as well as extensive quantitative data collection in the form of endpoint surveys with 573 literacy coordinators and 652 Year 1 teachers. The synthesis of these different elements provides the optimum understanding of participating schools’ phonics teaching practices and the implementation and emerging impacts
associated with the introduction of the PSC.
The research conducted with schools this year focused on Aim 2 of the evaluation, as detailed in Section 1.3 above. As such, the emphasis has been on exploring whether there have been any changes in the baseline position in teachers’ attitudes and
in Year 1 and Year 2 of the evaluation11. In total, data collection activities have been
undertaken three times throughout the course of the study to gather data over time. Surveys and case studies were undertaken in the summer term in July 2012, June-July 2013 and June-June-July 2014.
Surveys
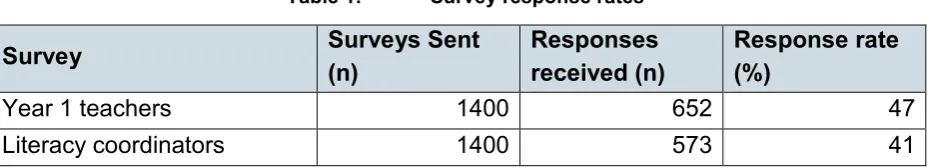
Surveys were administered to a national sample of literacy coordinators and Year 1 teachers. The literacy coordinator surveys explored areas such as: phonics teaching practices in schools; schools’ preparation for the implementation of the screening check; communication with parents and carers; and their views about phonics and literacy teaching in general. The Year 1 teacher survey focused on: their experiences of
[image:15.595.61.527.332.416.2]preparing for and administering the check; the appropriateness of the check for different groups of pupils; any changes in their practice; and their experience, if any, of local authority monitoring. Response rates to the most recent round of surveys can be seen in Table 1 below.
Table 1: Survey response rates
Survey Surveys Sent (n) Responses received (n) Response rate (%)
Year 1 teachers 1400 652 47
Literacy coordinators 1400 573 41
Source: NFER survey of literacy coordinators and Year 1 teachers, 2014
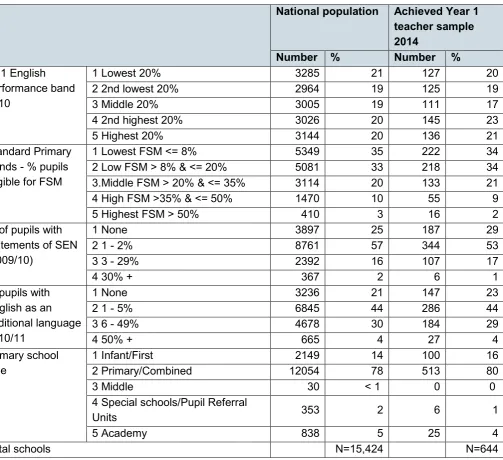
Analysis of the school characteristics of those Year 1 teachers responding to the survey, such as key stage 1 performance band and the proportion of pupils eligible for Free School Meals (FSM), revealed that the sample of achieved Year 1 teacher respondents12 were from schools that exhibited broadly similar characteristics to primary schools
nationally (see Table 2 below). Given this, the sample sizes achieved are large enough to detect statistically significant differences.
11 The methods used in the first and second year of the evaluation included interviews with senior school
leaders, literacy coordinators, Year 1 and 2 teachers and Reception teachers. In 2012 (Year 1) interviews were undertaken with staff in 14 case study schools and survey responses were collected from 844 literacy coordinators and 940 Year 1 teachers:
https://www.gov.uk/government/uploads/system/uploads/attachment_data/file/198994/DFE-RR286A.pdf In 2013 (Year 2) interviews were undertaken with staff in 19 case study schools and survey responses were collected from 583 literacy coordinators and 625 Year 1 teachers:
https://www.gov.uk/government/uploads/system/uploads/attachment_data/file/307229/Evaluation_of_the_ phonics_screening_check_second_interim_report_FINAL.pdf
12 A separate analysis revealed that the literacy coordinator sample was also broadly similar to primary
schools nationally.
Table 2: Representation of participating primary schools compared to schools nationally (based on responses to Year 1 teacher survey)
National population Achieved Year 1 teacher sample 2014
Number % Number %
KS1 English performance band 2010
1 Lowest 20% 3285 21 127 20 2 2nd lowest 20% 2964 19 125 19 3 Middle 20% 3005 19 111 17 4 2nd highest 20% 3026 20 145 23 5 Highest 20% 3144 20 136 21 Standard Primary
Bands - % pupils eligible for FSM
1 Lowest FSM <= 8% 5349 35 222 34 2 Low FSM > 8% & <= 20% 5081 33 218 34 3.Middle FSM > 20% & <= 35% 3114 20 133 21 4 High FSM >35% & <= 50% 1470 10 55 9 5 Highest FSM > 50% 410 3 16 2 % of pupils with
statements of SEN (2009/10)
1 None 3897 25 187 29
2 1 - 2% 8761 57 344 53 3 3 - 29% 2392 16 107 17
4 30% + 367 2 6 1
% pupils with English as an additional language 2010/11
1 None 3236 21 147 23
2 1 - 5% 6845 44 286 44 3 6 - 49% 4678 30 184 29
4 50% + 665 4 27 4
Primary school
type 1 Infant/First 2 Primary/Combined 12054 2149 14 78 100 513 16 80 3 Middle 30 < 1 0 0 4 Special schools/Pupil Referral
Units 353 2 6 1
5 Academy 838 5 25 4
Total schools N=15,424 N=644
Note: Of the 652 responses to the Year 1 teacher survey, eight were not able to be matched to school-level data.
School case studies
In order to gather a more in-depth understanding of the impact of the PSC and to capture any changes in practice since 2012, when the check was first introduced, a series of school case studies were undertaken between June and July 2014, focussing on the experiences of 19 schools13. As reported above, the case study findings presented in this
report are taken from the third of three rounds of visits to schools to build up a picture of the impact of the check over time.
13 A total of 31 different case study schools have been involved in the study over the three years of the
evaluation. Of these, five schools have taken part as a case study in each year of the evaluation. The characteristics of the case study schools in Years 1 and 2 are presented in the first two interim reports.
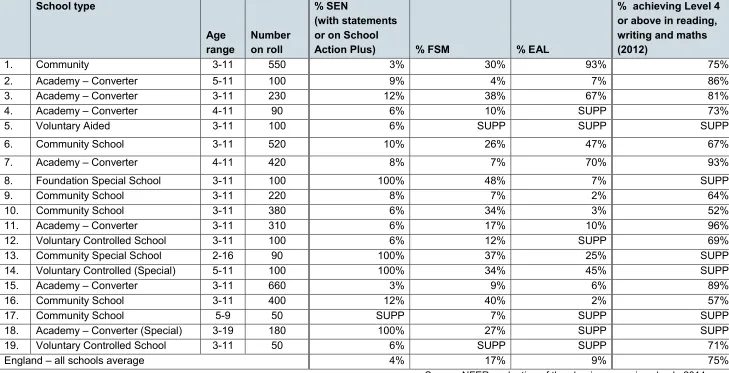
The schools were randomly selected to capture a diverse geographical spread, as well as diversity in terms of size, school type, and the proportion of pupils in receipt of FSM, with special educational needs (SEN), and who have English as an additional language (EAL). The characteristics of the schools are presented in Table 3.
Ten of the 19 case-studies involved a visit to the school, while nine were conducted by telephone. The case-studies consisted of qualitative interviews with senior school
leaders, literacy coordinators, Reception, Year 1 and Year 2 teachers and parents/carers. Topics covered as part of the visits to schools included: experiences of administering the check; impacts associated with the introduction of the check; and the costs and benefits associated with the check.
Analysis of National Pupil Database
Table 3: Selected characteristics of the 19 schools involved in the case study phase of the evaluation in 2014
Source: NFER evaluation of the phonics screening check, 2014 *SUPP – Information has been suppressed by DfE because the underlying numbers are too small The data above have been rounded to the nearest whole number School type
Age
range Number on roll
% SEN
(with statements or on School
Action Plus) % FSM % EAL
% achieving Level 4
or above in reading, writing and maths (2012)
1. Community 3-11 550 3% 30% 93% 75%
2. Academy – Converter 5-11 100 9% 4% 7% 86%
3. Academy – Converter 3-11 230 12% 38% 67% 81%
4. Academy – Converter 4-11 90 6% 10% SUPP 73%
5. Voluntary Aided 3-11 100 6% SUPP SUPP SUPP
6. Community School 3-11 520 10% 26% 47% 67%
7. Academy – Converter 4-11 420 8% 7% 70% 93%
8. Foundation Special School 3-11 100 100% 48% 7% SUPP
9. Community School 3-11 220 8% 7% 2% 64%
10. Community School 3-11 380 6% 34% 3% 52%
11. Academy – Converter 3-11 310 6% 17% 10% 96%
12. Voluntary Controlled School 3-11 100 6% 12% SUPP 69%
13. Community Special School 2-16 90 100% 37% 25% SUPP
14. Voluntary Controlled (Special) 5-11 100 100% 34% 45% SUPP
15. Academy – Converter 3-11 660 3% 9% 6% 89%
16. Community School 3-11 400 12% 40% 2% 57%
17. Community School 5-9 50 SUPP 7% SUPP SUPP
18. Academy – Converter (Special) 3-19 180 100% 27% SUPP SUPP
19. Voluntary Controlled School 3-11 50 6% SUPP SUPP 71%
1.5 The profile of research participants
NFER distributed endpoint surveys to Year 1 teachers and staff ‘with responsibility for the school literacy policy affecting the teaching of phonics and the use of the Year 1 phonics screening check’ (hereafter referred to as the literacy coordinator questionnaire) in a nationally representative sample of primary schools in June 2014. Data collection commenced the week beginning 23rd June 2014, the week after teachers administered
the check to their pupils.
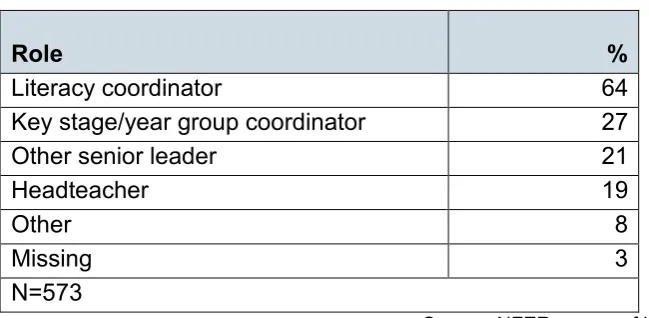
[image:19.595.92.417.299.458.2]Staff responding to the literacy coordinator questionnaire were asked to indicate the role(s) in which they were responding to the questions. The findings are presented in Table 4 below.
Table 4: Profile of staff responding to the literacy coordinator questionnaire
Role %
Literacy coordinator 64
Key stage/year group coordinator 27
Other senior leader 21
Headteacher 19
Other 8
Missing 3
N=573
Source: NFER survey of literacy coordinators, 2014 More than one answer could be given so percentages may sum to more than 100
The majority (64 per cent) identified themselves as being the literacy coordinator, while a notable minority were in a key stage/year group coordinator, headteacher or other senior leader role.
1.6 Analysis and reporting
This report draws on analysis of the data collected as part of the baseline and endpoint surveys, supplemented with data gathered from case study visits to 19 schools in 2014, as well as the case study evidence collected in Years 1 and 2 of the evaluation. Changes in respondents’ practices or views, as compared to those detailed in the first and second interim reports, are highlighted throughout. The report is structured as follows:
Chapter 2 explores the impact of the check on pupil attainment and progress in literacy. It draws on data collected through the National Pupil Database (NPD).
Chapter 4 reports on survey and case study schools’ views on the PSC, their
experiences of administering the check, the costs associated with the check, their views on the appropriateness of the check with different groups of learners, and the impacts associated with the check.
The concluding chapter draws together the key messages from the different strands of the evaluation and provides an assessment of the extent to which the PSC has made an impact on the teaching of phonics in primary schools during Reception and Years 1 and 2.
Findings from descriptive analysis are reported within the chapters; for further details, please refer to the technical appendix published alongside this report. The responses from Literacy Coordinators and Year 1 teachers are reported separately. Comparisons between the findings in 2012 and 2014 are reported where available and appropriate. Through statistical modelling known as latent class analysis, a typology of teachers’ engagement with current policy recommendations has been built and linked to the PSC and Key Stage 1 outcomes in the sample schools. Further details are provided in
2. The impact of the check on pupil attainment and
progress in literacy
Key findings
• Analysis was undertaken of national results on the PSC, together with results for the same pupils one year earlier, on the Early Years Foundation Stage Profile (EYFSP), and one year later, at the end of key stage 1. The evaluation did not find any evidence of improvements in pupils’ literacy performance, or in progress, that could be clearly attributed to the introduction of the PSC. However, no conclusive statement can be made because of methodological limitations.
• Phonics attainment, as measured by the proportion of pupils reaching the expected standard on the check, improved over three years and there is some evidence that this may have been an impact of the introduction of the check.
• Pupils are unlikely to reach the expected standard in reading and writing at the end of key stage 1 without being able to demonstrate the phonics skills measured by the PSC.
This chapter explores one of the central research questions of the evaluation: what, if anything, has been the impact of the introduction of the PSC on standards of literacy? As the check was introduced as part of a policy to strengthen phonics teaching in primary schools and to raise expectations and performance, it might be hypothesised that phonics teaching in general would improve as a result; or, more specifically, that the learning needs of individual children might be more effectively met. Either of these developments could be expected to lead to an improvement in attainment, in phonics specifically and/or in literacy more broadly.
As the PSC was introduced for all schools, it is not possible to identify a control group of pupils comparable in other respects but without the PSC. The absence of such a group means that it is not possible to reliably attribute the introduction of the check to any reported changes, nor to rule out the effect of other factors. Because of this
methodological limitation, interpretations of the data must be made cautiously.
A further complexity concerns the date of implementation of the PSC. It was introduced for the first time nationally in 2012, but was piloted in 2011. Awareness of the proposed introduction of the check may have given rise to a heightened emphasis on phonics in schools prior to its national introduction. The process evaluation of the pilot (Coldwell et al, 2011) found that the sample of schools in the pilot were already making some
changes to their phonics practice.
2.1 Attainment scores from the National Pupil Database
The National Pupil Database (NPD) holds data on PSC (PSC) scores for all pupils nationally, each year since its introduction. It also holds scores for the same children at two other time points: on EYFSP at the end of Reception, one year earlier when they were about five years of age; and at the end of key stage 1 (KS1), one year later when they were about seven. The NPD analyses reported here include all children nationally for whom the relevant scores were available, a cohort of just under 600,000.
Scores on the Phonics Screening Check
Scores on the PSC itself give a measure of pupils’ attainment in phonics, and increases in these scores would therefore give evidence of improvements in phonic skills.
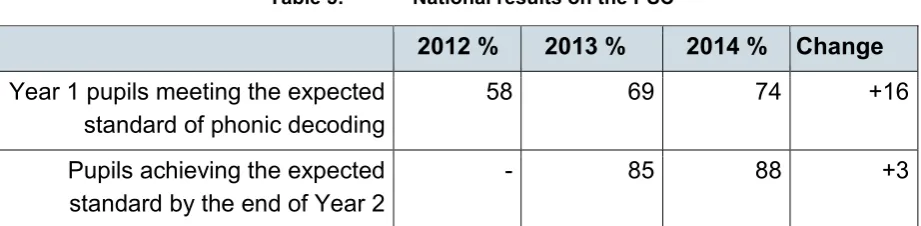
[image:22.595.58.519.363.476.2]The national published results show an increase in the proportions of pupils meeting the expected standard in the PSC year on year since its introduction in 2012 (Table 5). From 2013 onwards, it also includes those who, having fallen below the expected standard in Year 1, took the check again in Year 2 and this time met the standard.
Table 5: National results on the PSC
2012 % 2013 % 2014 % Change
Year 1 pupils meeting the expected
standard of phonic decoding 58 69 74 +16
Pupils achieving the expected
standard by the end of Year 2 - 85 88 +3
Source: Statistical First Release, PSC and national curriculum assessments at key stage 1 in England, 2014. N= 1,846,470. The threshold for the expected standard was 32 marks out of 40 each year. The percentage meeting the standard by the end of Year 2 includes those who achieved it in Year 1.
The table shows an increase of 16 percentage points in the proportion of pupils meeting the expected standard over the first three years of the PSC. Of pupils reaching the end of Year 2, a large majority achieved this standard, and this figure, too, shows a small
increase over the two years when it could be measured. It is worth noting that, in the PSC pilot of 2011, only 32 per cent of pupils were reported to have achieved the standard.
These published figures show a considerable improvement in pupil attainment in phonics, as measured by the PSC, over the three years. The evaluation evidence collected as part of this study suggests some features of the context within which these improvements in scores have taken place. Further details of this evaluation evidence are set out in the later chapters of this report.
As with any new assessment, a process of ‘bedding down’ has been apparent as schools have become familiar with its requirements. The evaluation has found evidence of
consider it an appropriate level of difficulty in 2014 than when they first encountered it (see Chapter 4, Section 4.4). There is also evidence of teachers ensuring that all the features of the PSC, and particularly the need to decode pseudo-words, are familiar to children.
Teacher reports from the evaluation give evidence of increases in the time, frequency or pace of phonics teaching and greater attention to ongoing assessment in phonics. This shows some ‘tightening up’ of phonics teaching practice, reported by teachers as a response to the introduction of the check.
These features of the school context give a plausible explanation for some improvement in children’s performance in phonics, although the methodology is not able to establish a causal link.
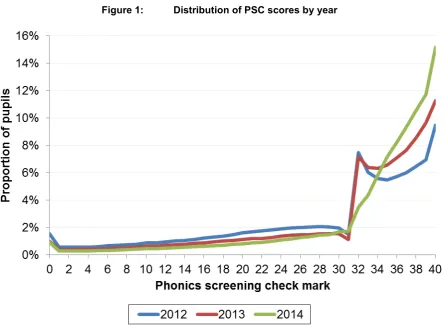
Figure 1 shows the distribution of PSC scores for each of the three years since its
introduction in 2012. The maximum score, and the most frequent score in each year, was 40. The expected standard in each year was 32 marks. It is notable that there is a spike at the expected standard and a dip just below the expected standard in 2012 and 2013.
The spike implies that some pupils have been misclassified in addition to the
misclassification that would be expected due to measurement error. Standards and
Testing Agency (STA) analysis estimated that approximately four per cent of pupils would have been misclassified in the PSC (STA 2012). Other analysis estimated that 46 per cent of pupils would be expected to reach the expected standard if there was a smooth distribution of scores around the expected standard, as was observed in the pilot
(Townley and Gotts 2013). This compared to 58 per cent of pupils that actually reached the expected standard in 2012, a difference of 12 percentage points.
Figure 1: Distribution of PSC scores by year
Source: Department for Education (2014) Statistical First Release: Phonics screening check and national curriculum assessments at key stage 1 in England, 2014. 25 September.
The PSC and prior literacy attainment
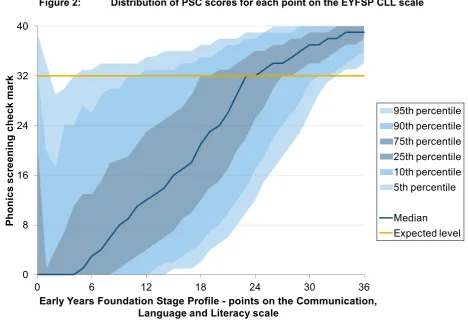
Figure 2: Distribution of PSC scores for each point on the EYFSP CLL scale
Source: NFER analysis of National Pupil Database data. N=568,883
Overall, then, there is no identifiable pattern of poorer performance on the PSC than expected in those children who are already fluent readers.
The PSC and key stage 1
The assessment at the end of KS1 is a teacher judgement of a pupil’s attainment in reading and writing and both are reported as national curriculum levels. They include evidence from a national test of reading comprehension and writing composition, alongside teachers’ ongoing assessments. Averaged together they thus represent a broader construct of literacy than phonics alone and therefore performance on the PSC and KS1 might be expected to be similar, but not identical. The national curriculum levels will be abolished in 2016 but for the purposes of this evaluation they provide a useful measure for analysing the relationship between the PSC and KS1, looking at the same cohorts of pupils in subsequent years, as captured by NPD. Following the procedure in both interim reports, this analysis combines reading and writing points at KS1. As described in the national curriculum, phonics underpins both reading and writing, as pupils with good phonics skills read and write rapidly at the word level, contributing to their ability to comprehend and compose written texts.
Among those who achieved the expected standard of level 2 or above at KS1 in 2014 (87 per cent of pupils):
0 8 16 24 32 40
0 6 12 18 24 30 36
Ph
on
ics scr
een
in
g
ch
eck m
ar
k
Early Years Foundation Stage Profile - points on the Communication, Language and Literacy scale
95th percentile 90th percentile 75th percentile 25th percentile 10th percentile 5th percentile
• 79 per cent reached the expected standard as a Year 1 pupil in the 2013 PSC
• 18 per cent reached the expected standard as a Year 2 pupil in the 2014 PSC
• three per cent did not reach the expected standard in 2014
• less than one per cent had missing phonics check data in 2014.
When only those pupils meeting the more demanding threshold of level 2B at KS1 are considered (71 per cent of pupils in 2014):
• 88 per cent reached the expected standard as a Year 1 pupil in the 2013 PSC
• 11 per cent reached the expected standard as a Year 2 pupil in the 2014 PSC
• one per cent did not reach the expected standard in 2014
• less than one per cent had missing phonics check data in 2014.
These analyses give evidence of the relationship between the attainments measured by the PSC and those assessed at KS1. They show that there is an association between the likelihood of pupils reaching the expected standard in reading and writing at the end of KS1 and meeting the expected standard on the PSC.
Analysis of attainment trends – absolute impact
Pupils’ progress in literacy (rather than specifically in phonics) can be measured using their scores on the EYFSP at age five and at the end of KS1 at age seven. The EYFSP points represent children’s attainment at the end of the Reception year of school. During this time they are very likely to have made a start in learning phonics; and thus it cannot be regarded as a true baseline measure in determining the subsequent impact that the PSC makes in improving children’s literacy skills. This is, however, the only national assessment available for younger children and it gives a useful measure of prior attainment a year before the check.
In the absence of a comparison/control group, it is possible to consider the EYFSP-KS1 progress measures before and after the introduction of the PSC. This before-after comparison could to some extent be seen as representing the situation with and without the check. However, it is difficult to make a reliable interpretation as other factors
affecting attainment and progress over this period cannot be ruled out. A number of phonics initiatives had already been introduced and the PSC itself was piloted in 2011.
Table 6 shows the mean scores for literacy at KS1 (reading and writing) and EYFSP (Communication, Language and Literacy) from 2011 to 2014. The year refers to the year the pupils were assessed for KS1, and EYFSP scores relate to the same cohort, but two years previously. For the first two years in the table, the PSC had not been introduced, whereas pupils reaching the end of KS1 in 2013 and 2014 had taken the PSC.
By calculating pupils’ KS1 points compared to what might be expected given their EYFSP points, a measure of ‘value added’ can be obtained, and this has also been slowly
[image:27.595.53.522.166.280.2]increasing over time. As 2011 is the first year included in the calculations, value added in 2011 is set at zero and this forms the ‘base year’ against which further patterns are measured.
Table 6: Mean national scores at KS1 and EYFSP, 2011-2014
KS1 reading and
writing points EYFSP CLL points FSP-KS1 value added
2011 15.1 25.3 0.00
2012 15.3 25.6 0.11
2013 15.6 25.9 0.25
2014 15.8 26.4 0.20
Source: NFER analysis of National Pupil Database data. N=2,281,655
These analyses of national data therefore indicate small improvements in attainment at KS1, which were a feature before the introduction of the check and continued at a similar pace following the introduction of the check. Similarly, progress in literacy from EYFSP to KS1 has improved since the introduction of the check, but was also improving before its introduction. This analysis is inconclusive and is unable to offer any clear evidence of improvements in literacy performance, or in progress, directly attributable to the impact of the PSC.
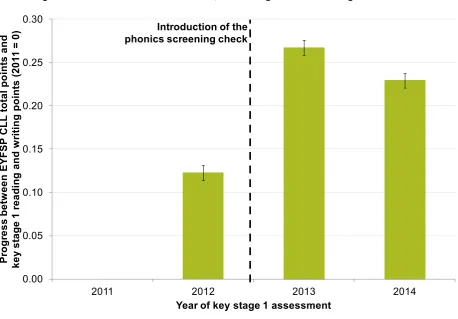
As a check that this relationship was not influenced by known changes in other characteristics (such as an increase in deprivation), value added was estimated in a regression model including pupil and school background factors. Figure 3 below is from that regression model and shows that the results are very similar even after background factors are controlled for. This regression analysis controls for known background factors, but is unable to take account of unquantifiable changes in the educational context (such as a possible increasing emphasis on phonics over the whole of this period) which could have affected the patterns observed.
The first two years are cohorts that did not have the PSC, whereas the last two years are cohorts that did have the PSC. One interpretation is that value added is higher in years when the phonics check was being administered. Another interpretation is that value added was increasing and there is little departure from that trend.
Either way, the difference is not very big, at less than 0.3 of a point at KS1. To put the magnitude in context, one level at KS1 is six points; the standard deviation of KS1 points is 3.6. Statistically the differences are significant, but as these estimates are based on very large numbers – all pupils in the NPD – statistical significance is not very
Figure 3: Value added 2011-2014, controlling for known background factors
Source: NFER analysis of National Pupil Database data. N=2,193,102. Small black bars show the 95% confidence interval.
The evidence offered by these analyses is therefore inconclusive in identifying any impact of the PSC on literacy performance at KS1 or on progress in literacy between ages five and seven. It would be of interest to examine the impact of the PSC on KS1 reading and KS1 writing separately. It will be of continuing interest to review the results at KS1 in future years and also the results at KS2 as the pupils who took the check
progress through their later years of schooling (Department for Education, 2015).
Progress of lower- and higher-attaining pupils
It may be, however, that there is a differential impact on particular groups of pupils. For example, the check could be having a particular impact on the attainment of lower-attaining pupils.
To investigate this, the pupils can be split into five quintiles according to their
performance on the EYFSP at the end of the Reception year. Then, the progress of each quintile can be examined separately. Table 7 defines the attainment groups.
0.00 0.05 0.10 0.15 0.20 0.25 0.30
2011 2012 2013 2014
Pr ogr es s be tw ee n E YFS P C LL t ot al point s a nd ke y s ta ge 1 re ading a nd w rit ing point s ( 20 11 = 0 )
Year of key stage 1 assessment Introduction of the
Table 7: Quintiles of literacy attainment
Attainment group EYFSP CLL points PSC 32 or above (in Year 1) Average KS1 R and W points
Lowest 20% 0-21 22% 11.3
Middle-lowest 20% 22-25 51% 14.5
Middle 20% 26-28 71% 16.1
Middle-highest 20% 29-31 85% 17.5
Highest 20% 32-36 95% 19.2
Source: NFER analysis of National Pupil Database data. N=2,283,242
Overall, the table shows the expected pattern, with pupil scores on the EYFSP reflected in lower or higher scores on the PSC at the end of Year 1 and at KS1.
The progress of the five groups over time is depicted in Figure 4 below. In this graph, the progress of the middle group in 2011 is set at zero and progress of other groups is shown relative to this. Once again, it is important to remember that the 2013 and 2014 cohorts took the PSC whereas the previous cohorts did not.
Figure 4: Progress in literacy of different attainment groups, 2011-2014
Source: NFER analysis of National Pupil Database data. N=2,193,102 0
0.1 0.2 0.3 0.4
2011 2012 2013 2014
Pr ogr es s be tw ee n E YFS P C LL t ot al point s a nd ke y s ta ge 1 re ading a nd w rit ing point s ( 20 11 = 0 )
Year of key stage 1 assessment
Lowest 20% Middle-lowest 20% Middle 20% Middle-highest 20% Highest 20% Introduction of the
[image:29.595.69.519.399.693.2]The graph makes clear that over the years, the greatest relative improvement in progress was made by the highest attainers, those in the highest and middle-highest bands. The other three groups, the lowest, middle-lowest and middle attainers, also make increasing progress over the first three years, with a small fallback in all groups in 2014. The
progress of the lowest 20 per cent and the middle-lowest 20 per cent improve slightly less rapidly than the other groups. It appears from the figure that improvements continued both before and after the introduction of the check for all groups.
Figure 4 confirms that progress in literacy learning was greatest for children of higher literacy attainment and that improvements in progress were underway before the PSC was introduced in 2012 and continued into 2013. Again, therefore, the findings are inconclusive: there is no clear evidence of any particular impact of the introduction of the PSC on pupil progress in literacy for learners with different levels of prior attainment.
2.2 Revisiting NFER’s typology of schools
In principle, the relationship between schools’ teaching methods and pupils’ attainment is of interest in a study of this kind. However, as Chapter 3 below will explain in more detail, it is not possible to distinguish groups of schools that are characterised by a particular teaching method, to the exclusion of others. It was possible, however, to use the questionnaire responses of literacy coordinators to investigate the school’s ‘stance’, or overall attitude, towards current phonics policies. By combining their views of the check, their reported teaching approach and their attitudes towards systematic synthetic phonics and other methods of literacy teaching, a typology of schools was established that
suggests some systematic differences between schools in their attitudes towards phonics. The questions included in this analysis were:
• ‘Which of these statements best characterises the approach to phonics within early literacy teaching in your school?’ There were three answer options. The first, ‘systematic synthetic phonics is taught ‘first and fast’’, had further clarification added in 2014 that this option was intended to exclude other cueing strategies. The second option was ‘phonics is taught discretely alongside other cueing
strategies’ and the third, ‘phonics is always integrated as one of a range of cueing strategies’.
• ‘Please indicate the extent to which you agree with each of these statements.’ This question had five response options: agree; agree somewhat; uncertain or mixed views; disagree somewhat; disagree.
- I am convinced of the value of systematic synthetic phonics teaching
- Phonics should always be taught in the context of meaningful reading
- A variety of different methods should be used to teach children to decode words
- Systematic phonics teaching is necessary only for some children
- The phonics screening check provides valuable information for teachers
- The phonics screening check provides valuable information for parents/carers
Previous interim reports have detailed the exploratory analyses of this kind that were undertaken in the first two years of the evaluation. In this final year, the analysis was repeated on the current year’s data. Once again, the overall stance of the school was derived from key questionnaire responses by the literacy coordinator. A latent class analysis (see Technical Appendices for full description) sought out patterns of response that allowed a grouping of respondents.
Despite the significant change to one question this year, described above, the results this time were broadly consistent with the typologies identified in the first and second interim reports. Four types of school have emerged. These have been labelled ‘Type 1:
[image:31.595.60.534.464.718.2]Supporters of synthetic phonics and of the check’, ‘Type 2: Supporters of synthetic phonics but not of the check’, ‘Type 3: Supporters of mixed methods’ and Type 4: Supporters of integrated literacy teaching’. These are depicted in Figure 5.
Figure 5: Typology of schools
This typology gives an overall indication of the school’s attitude, based on a combination of different questionnaire responses. When schools are divided up into groups according to type, it is possible to examine the characteristics of each type separately.
A key characteristic distinguishing these types is their response to the questionnaire item offering three overall approaches to phonics teaching. Types 1 and 2 are highly likely to identify themselves as teaching systematic synthetic phonics ‘first and fast’ (85 and 91 per cent, respectively). In contrast, 94 per cent of Type 3 respondents and 99 per cent of Type 4 respondents did not select this option, instead favouring a mixed or integrated approach, respectively. The proportion of schools falling into the ‘mixed strategies’ type has increased noticeably from previous years, which is most likely to be the result of the change in the question mentioned above.
In the discussion below, the percentages refer to the proportion of literacy coordinators selecting either ‘agree’ or ‘agree somewhat’ in response to a variety of statements expressing views about phonics teaching and the phonics check.
Type 1: Supporters of synthetic phonics and of the check (22 per cent of sample)
Together with their adherence to the ‘first and fast’ teaching of synthetic phonics, this group of respondents are highly convinced of the value of systematic synthetic phonics teaching (96 per cent). They are less likely than the other groups to support the teaching of phonics ‘in the context of meaningful reading’ (79 per cent) and the teaching of a variety of methods of decoding (65 per cent). They are the group least likely to believe that systematic synthetic phonics is necessary only for some children (15 per cent) or that phonics has too high a priority in current education policy (nine per cent). Overall, this can be seen as the type most favourably disposed towards systematic synthetic phonics as embodied in current policy recommendations. Moreover, in contrast to the other three groups, a majority of these respondents (65 per cent) agree that the PSC provides valuable information for teachers, and just under half (46 per cent) agree that it provides valuable information for parents/carers.
Type 2: Supporters of synthetic phonics but not of the check (18 per cent of sample)
Type 3: Supporters of mixed methods (43 per cent of sample)
This group is distinguished by their practice of teaching phonics alongside other cueing strategies, rather than ‘first and fast’. Ninety-three per cent report teaching phonics ‘discretely alongside other cueing strategies’. Their level of support for systematic synthetic phonics teaching is only slightly lower than Types 1 and 2, at 89 per cent. Almost all of this group, 98 per cent, think that a variety of different methods should be used to teach children to decode words. A similar percentage to Types 2 and 4, 90 per cent, support the teaching of phonics in the context of meaningful reading. Thirty-eight per cent of Type 3 teachers think that phonics has too high a priority in current education policy and 32 per cent think that systematic synthetic phonics is necessary for only some children. These teachers are slightly more positive towards the PSC than Type 2, with 20 per cent believing it gives valuable information to teachers and 14 per cent to
parents/carers. Thus, some of these teachers seem to see the check as a useful ingredient within their overall mixed approach.
Type 4: Supporters of integrated literacy teaching (17 per cent of sample)
This group is distinguished by their selection of the option ‘Phonics is always integrated as one of a range of cueing strategies’ (99 per cent). Their view of the value of
systematic synthetic phonics teaching is less positive than the other three types, at 75 per cent (although this still represents a substantial endorsement). Almost all of this group, 99 per cent, think that a variety of different methods should be used to teach children to decode words. Ninety-three per cent, the highest of all groups, support the teaching of phonics in the context of meaningful reading. Forty-three per cent of Type 4 teachers, the highest of any group, think that phonics has too high a priority in current education policy and 32 per cent think that systematic synthetic phonics is necessary for only some children, suggesting that this is the most negative of the four groups towards current phonics policies. These teachers are slightly more positive towards the PSC than Type 2, with 27 per cent believing it gives valuable information to teachers and 19 per cent to parents/carers. Like Type 3, some of these teachers seem to see the check as a useful ingredient within their overall integrated approach.
This typology of schools provides a classification of the broad stance towards the teaching and assessment of systematic synthetic phonics which may be useful in
analysing other findings. It is noteworthy that all four types strongly endorse the teaching of systematic synthetic phonics, but differ in their views of the extent to which this should be accompanied by other cueing strategies and their views of the PSC.
2.3 Multilevel modelling
Multilevel modelling is a way of discerning which factors are significant, taking all other factors into account. It works by jointly examining the relationship between an outcome of interest and many potentially influential background characteristics including prior
attainment. It has a number of distinct advantages over other estimation procedures. First, it allows comparison on a like-with-like basis. It is important that any analysis technique used takes account of the differences in the circumstances in which different pupils and schools are situated.
The second major advantage of multilevel modelling, which is particularly important in the analysis of educational data, is that it takes account of the fact that there is often more similarity between individuals in the same school than between individuals in different schools. By recognising the hierarchical structure of the data, multilevel modelling allows the most accurate estimation of the statistical significance of any effects of the
intervention being investigated.
Two multilevel analyses of pupil performance were conducted, based on the NPD data described above. The first took as its outcome the score on the PSC, while the second was based on reading and writing outcomes at KS1.
Background variables included in the model were:
• pupil characteristics: gender, age, ethnicity, SEN, and EAL
• pupil prior attainment: points on the EYFSP scale
• pupil-level indicators of socio-economic status: Income Deprivation Affecting Children Index (IDACI), eligibility for FSM
• school characteristics: type, size, region, key stage 1 attainment band; proportion of pupils eligible for FSM; proportion of pupils with SEN; proportion of pupils with EAL
• school type, following the typology described in section 2.2 of this report.
The analysis was based on a sample of 39,024 pupils in the evaluation schools who took the check in 2012 and 26,720 pupils who took it in 2013. This sample was a good
representation of national figures; further details are given in the separate technical appendices document. The actual analysis samples were smaller because they did not include schools that only returned one of the questionnaires.
Attainment by typology – relative impact
The multilevel model revealed that positive attitudes towards the teaching of systematic synthetic phonics and the value of the check (Type 1) are reflected in higher scores on the check for pupils. This pattern held true for both cohorts of pupils in the evaluation: those taking the PSC in 2012 with KS1 results in 2013; and those taking the PSC in 2013 with KS1 results in 2014.
Schools that are positive towards systematic synthetic phonics, although unconvinced of the value of the check (Type 2), also had higher scores amongst the first cohort, but this pattern was not found in the second cohort.
[image:35.595.58.537.306.498.2]In contrast to the PSC scores, there were no significant associations between school typology and the results at KS1. Thus attainment in reading and writing more broadly appears unaffected by the school’s enthusiasm, or not, for systematic synthetic phonics and the check, and by their attitude to phonics. These results are summarised in Table 8.
Table 8: Multilevel model outcomes: impact of school type on PSC and KS1 scores
Cohort 1 Cohort 2
Impact on: PSC KS1 PSC KS1
Type 1: Supporters of phonics
and the check positive insignificant positive insignificant
Type 2: Supporters of phonics
but not the check positive insignificant insignificant insignificant
Type 3/4: Supporters of mixed
/ integrated methods base base base base
Statistical significance is from a t-test at 95% confidence level. The typology analysis was repeated each year. In 2012, it distinguished 4 types and in 2013 only 3, with the third combining the characteristics of the previous types 3 and 4. ‘Base’ indicates that types 1 and 2 were analysed relative to type 3/4; the positive findings for type 1 and 2 indicate that schools in type 3/4 had significantly lower results.
Schools in the KS1 analysis are defined according to the typology that related to when the pupils were in Year 1. The 2012 analysis, like that in 2014, identified four types rather than the three in 2013. However, the results of the multilevel analysis were not affected by amalgamating the ‘mixed methods’ and ‘integrated’ groups.
3. The impact of the check on the teaching of
phonics and the wider literacy curriculum
Key findingsPhonics teaching practices and views on phonics teaching
• Teachers have been consistently positive about phonics as an approach to
teaching reading throughout the three year evaluation. For example, more than half of the literacy coordinators surveyed in 2014 (58 per cent) agreed with the
statement ‘I am convinced of the value of systematic synthetic phonics teaching’. In the majority of schools, however, it appears that other strategies alongside phonics are also supported. For example, in 2014, 56 per cent of literacy coordinators reported that ‘phonics is taught discretely alongside other cueing strategies’ or that ‘phonics is always integrated as one of a range of cueing strategies’.
• There is evidence that the introduction of the PSC has led to schools making
changes to their phonics teaching and classroom practice in each and every year of the evaluation. Just under half of the literacy coordinators surveyed in 2014 reported doing so (48 per cent), compared with 56 per cent in 2013 and 34 per cent in 2012 (in 2012 the question concerned changes made in anticipation of the
check).
• The most frequently reported change by survey respondents in 2014 was
increasing the pace of phonics teaching, and this finding was supported by data drawn from the case studies. As in 2013, an increased focus on pseudo-words was also reported by participants in the survey and case studies, as well as increased assessment of phonics. Analysis did not determine what form this increased focus took.
• In terms of use of the results of the previous year’s check, literacy coordinators reported that Reception teachers used these mostly to review or revise phonics teaching plans in general. Year 1 and 2 teachers were reported to have used the check results primarily for reviewing and revising phonics teaching plans for
individuals and groups. Teachers reported using evidence from the check to make decisions about extra support for individuals, alongside their own records of
assessment.
• For those children who had not met the standard in 2013, the most frequent type of support provided was to continue with systematic phonics teaching; this was
followed by intensive learning in small groups. Teachers’ views on the value of the check
valuable information for teachers’ and ‘The phonics screening check provides valuable information for parents/carers’. The case study evidence suggested that the reason for this was a view that check results do not reveal anything of which teachers are unaware.
• Year 1 teachers were more positive, with just over half (53 per cent) reporting that the check gave them useful information ‘to a great extent’ or ‘to some extent’. These responses were also more positive than in 2013.
One of the aims of the evaluation in years 2 and 3 is to understand the impact of the teaching of phonics in primary schools, and to assess the impact of the PSC on teaching of the wider literacy curriculum.
Drawing on the findings from the surveys and case studies, this chapter explores
schools’ approaches to the teaching of phonics. It looks specifically at the extent to which schools reported making changes to their phonics teaching practices since the
introduction of the check. It also explores how teachers have used the results from the check. The chapter also explores teachers’ views on the value of the check, and whether these views have changed over time.
3.1 Schools’ phonics teaching practices
As in 2012 and 2013, responses from teachers in both the survey and case study schools indicated that almost all schools have committed to teaching phonics to some degree and that, within literacy teaching, considerable emphasis is placed on phonics as a method of teaching children to learn to decode.
Table 9 presents survey data indicating schools’ perceptions of their approach to phonics within overall early literacy teaching. In 2014, the following clarification was added to the statement about teaching systematic synthetic phonics ‘first and fast’, in response to an apparent misunderstanding in previous years of the meaning of ‘first and fast’: This envisages phonics as the only way to decode words, i.e. with no other cueing strategies, which should underpin pupils’ reading of all words.
As can be seen in Table 9, in 2014, there was a marked drop in the percentage of
Table 9: Teacher reports of their school’s approach to phonics teaching: 2012, 20