167
VISIBLE AND SHORTWAVE NEAR INFRARED SPECTROSCOPY TO PREDICT SUGARCANE QUALITY FROM CLEAR AND RAW JUICE
SAMPLES
N. M. Nawi1, 2*, G. Chen1 and T. Jensen1
1
Faculty of Engineering and Surveying,
University of Southern Queensland, Toowoomba, QLD 4350, Australia E-mail: [email protected], [email protected],
2
Department of Biological and Agricultural Engineering, Faculty of Engineering, Universiti Putra Malaysia,
43400 UPM, Serdang, Selangor, Malaysia. *E-mail: [email protected]
ABSTRACT
The feasibility of using visible and shortwave near infrared (Vis/SWNIR) spectroscopy to predict soluble solids content (brix) and sucrose content (pol) from sugarcane juice samples was assessed. A total of 96 sugarcane juice samples for each clear and raw juice samples were used. The spectral measurements were collected by scanning the juice samples in a cuvette with 1 mm path length using transmittance mode. Principal component analysis (PCA) and partial least squares (PLS) analysis were used to interpret the spectra and develop both calibration and prediction models. The prediction performances for the clear juice samples were good with coefficient of determination (R2) values of brix and pol were 0.85 and 0.87, respectively. For the raw juice samples, the prediction performances were acceptable with R2 values for brix and pol were 0.72 and 0.75, respectively. The overall results indicated that the Vis/SWNIR spectroscopy combined with PLS models could be applied to predict sugarcane quality from both clear and raw sugarcane juices.
Keywords: visible and shortwave near infrared spectroscopy; sugarcane; quality; raw
juice; clear juice.
INTRODUCTION
Sugarcane (Saccahrum spp.) is an important crop in Australia with the production value ranging from AUD$1.5 to 2.5 billion per year (Anon., 2011). In the Australian sugarcane industry, growers are paid based on both yield and quality of their product. Sugarcane quality is determined based on its sugar content, known as commercial cane sugar (CCS). CCS is derived from brix (soluble solids content), pol (sucrose content) and fibre content. The brix and pol are usually measured in a laboratory using conventional measurement methods including refractometer, polarimeter and chromatographer. Lately, the applications of laboratory spectroscopic methods as rapid and simple measurement systems in measuring sugarcane quality parameters have been reported (Mehrotra and Siesler, 2003; Valderrama et al., 2007; Taira et al., 2010).
168
and adoption of the precision agriculture technique. Unfortunately, the conventional measurement methods and laboratory spectroscopic methods have great limitations for field uses because they are often time-consuming, operator dependent, and require hazardous reagents (Mehrotra and Siesler, 2003). Moreover, these laboratory technologies are not suitable to be used in the field considering the potential damage due to harsh and dusty environment in the field. This laboratory equipment is also expensive, thus should be handled with a great care.
Therefore, a portable, robust and low-cost spectrometer is more preferable for field use. Nowadays, a portable visible and shortwave near infrared (Vis/SWNIR) instrument with a wavelength range from 350 to 1100 nm appears promising for predicting fruit quality since the instrument is low-cost and portable enough for in-field measurements (Walsh et al., 2000). The applications of this equipment to measure sugarcane quality from stalk samples have been reported by Nawi et al., (2012, 2013a, 2013b). However, no study has reported the use of this equipment to measure sugarcane quality from juice samples. The application of this equipment seems to be feasible because it is small, portable and low-cost compare to other spectroscopy sensors. Therefore, the objectives of this study were (1) to investigate the feasibility of using Vis/SWNIR spectrometer to predict brix and pol in sugarcane juice samples; (2) to compare the prediction performance between clear and raw juice samples.
MATERIALS AND METHODS
Sugarcane Juice Samples
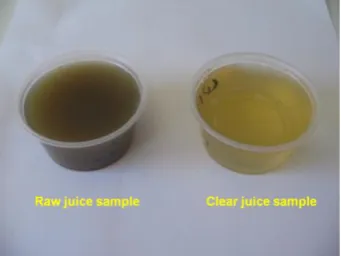
[image:2.595.213.384.610.738.2]A total of 96 juice samples were collected for each clear and raw sugarcane juices. Each juice sample was extracted from a sample set consisted of a group of six whole stalk samples. Each sample set was collected from different field trials in Bundaberg, Australia throughout the harvest season in 2012. Each sample set was passed through a small mill at the Bureau of Sugar Experimental Station (BSES) laboratory complex in Bundaberg, Queensland, Australia. The first expressed juice was collected by hydraulically pressed the shredded cane samples. Then, the collected juices of each sample set were filtered and divided into two sets, one to determine brix and another one to determine pol. The brix (soluble solids content) measurement was done on raw juices using a Bellingham and Stanley RFM 310 refractometer. For pol measurement, the raw juice samples were first clarified using lead acetate to produce clear juices (Figure 1). Pol (sucrose content) measurement was done on clear juice samples using a Polartronic Universal automatic polarimeter (Schmidt + Haensch, Berlin, Germany).
169
Instrument and Spectral Collection
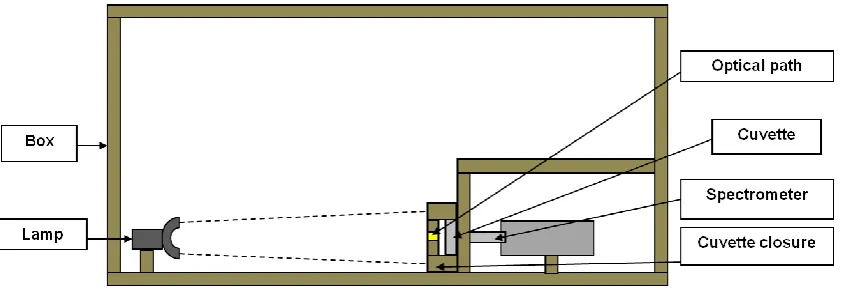
[image:3.595.88.509.287.435.2]The transmission spectra of the samples were measured using a handheld Vis/SWNIR Spectroradiometer (FieldSpec HandHeld and FieldSpec Pro FR, 325 to 1075 nm, Analytical Spectral Devices (ASD), Inc., Boulder, USA). The spectral measurements were conducted inside a black measurement box (900 x 600 x 450 mm). The box was built to enclose the sensor and the samples from the ambient light (Figure 2). The juice samples were placed into a plastic cuvette with 1 mm of optical path length. The field of view (FOV) of the spectroradiometer was 10°, giving a working distance of 45 mm from the cuvette with the diameter of the scanning area of 10 mm. A cuvette holder was built to firmly hold the cuvette inside the box throughout the experiments. One side of the cuvette was scanned using the sensor while on another side was illuminated with halogen lamp (Lowell Pro-Lam 14.5 V tungsten bulb, Ushio Lighting, Inc., Japan). The lamp was placed about 300 mm away from the measurement samples.
Figure 2. Simplified diagram of the transmittance measurement inside the measurement box.
The reference spectrum was acquired using the cuvette filled with distilled water and the dark spectrum was acquired when the lamps were off. Transmission spectra from 375 to 1075 nm were measured at 1.5 nm intervals with an average reading of 20 scans per spectrum. All spectral data were stored in a computer and processed using the RS3 software for Windows (Analytical Spectral Devices, Inc., Boulder, Colo.), designed with a graphical user interface. The transmission spectra were transformed into ASCII format by using the ASD ViewSpecPro software (Analytical Spectral Devices, Boulder, USA). Then, three spectra for each sample were averaged into one spectrum and transformed by log (1/T) into absorbance spectrum.
Multivariate Analysis
170
software packages. MSC was used to correct the light scattering variations in the spectral data (Naes et al., 2004). The pre-processing processes were implemented using The Unscrambler, V 9.6 software (Camo Process AS, Oslo, Norway).
Prior to the development of calibration model, principal component analysis (PCA) was applied in analyzing the spectra data to extract useful information, decrease the noise and reduce the number of principle components (PCs). PCA is a well-known chemometrics method used to search for directions of maximum variability in sample grouping and uses them as new axes called principle components (PCs) that can be used as new variables, instead of the original data, in the following calculations (Blanco and Villarroya, 2002). PCA was also used to detect spectral outliers that might affect model performance in each data set (Moghimi et al., 2010). Two outliers were found in this study and they were removed prior to spectral analysis using partial least square (PLS) regression.
Partial least squares (PLS) analysis is commonly applied in the near infrared spectroscopy analysis. PLS analysis could be used to establish a regression model to perform the prediction of sugar content from sugarcane juices. PLS simultaneously considers the variable of matrix Y (brix and pol) and the variable of matrix X (spectral data). In this paper, PLS was applied as a regression method as well as a way to extract the latent variables (LVs). The LVs were considered as new eigenvectors of the original spectra to reduce the dimensionality and compress the original spectra data (Wu et al., 2008). The maximum numbers of LVs used in this study was set to ten. Due to a limited number of samples used, full cross validation (leave-one-out) was used to evaluate the prediction quality and prevent over fitting of the calibration model (Arana et al., 2005).
External validation method was also used in this study to check the performance of the PLS models. The external validation procedure determines the predictive ability of an equation, based on a sample set which has not been used in the calibration development. Before the calibration, samples were divided into two sets. One set (75% of samples) was used to develop a prediction equation (calibration set) and another set (25% of samples) was used to validate the predictive equation (validation set). Samples for validation were selected by taking one of every four samples from the entire sample set, taking care to ensure that each set included samples that covered the entire range of sugarcane quality values.
In this paper, both PCA for PLS modeling were run using the Unscrambler V 9.6. The performance of the final PLS models was evaluated by the coefficient of determination for calibration (R2), root mean squares of calibration (RMSEC), and the coefficient of determination for prediction (R2) and root mean squares of prediction (RMSEP). A proper model should have a low RMSEC, RMSEP and a high R2 for both calibration and prediction models.
RESULTS AND DISCUSSION
Overview of the Spectra and Statistical Values of Brix and Pol
171
[image:5.595.121.472.167.366.2]chlorophyll content was eliminated through clarification process. For the raw juice sample, it can be seen that there was some noises in the range of 400-550 nm. Hence, to afford better comparison with better prediction performance, only the wavelength region from 600 to 1000 nm was used for the analysis in this study.
Figure 3. Typical absorbance spectra of raw and clear sugarcane juices.
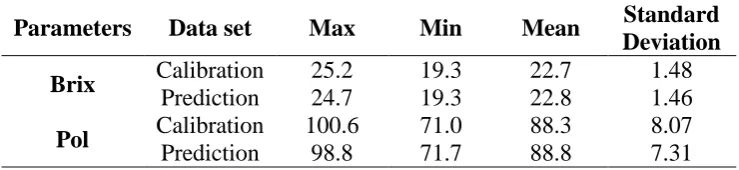
The statistical characteristics of brix and pol for the juice samples for both calibration and prediction are shown in Table 1. Since, the samples in calibration and validation sets were selected systematically, it was found that the range and mean values of brix and pol were almost identical in both data sets. Since the data was collected from different locations throughout the whole harvest season, the brix and pol values in both data sets would be considered sufficient to represent the typical quality values of sugarcane during harvest.
Table 1. Statistical characteristic of the juice samples.
Parameters Data set Max Min Mean Standard Deviation Brix Calibration 25.2 19.3 22.7 1.48
Prediction 24.7 19.3 22.8 1.46
Pol Calibration 100.6 71.0 88.3 8.07 Prediction 98.8 71.7 88.8 7.31
PLS Models Performance
PLS models were developed and applied for calibration and prediction data sets. The performances of the models were evaluated by the prediction set using R2 and RMSEP. The performances of the models in predicting the quality parameters are shown in Table 2. The prediction performance of the clear juice samples was good with R2 values for brix and pol were 0.85 and 0.87, respectively. For the raw juice samples, the prediction performance was acceptable with R2 values for brix and pol were 0.72 and 0.75, respectively. The prediction performance of clear juice was better than raw juice
0 0.4 0.8 1.2 1.6 2
400 500 600 700 800 900 1000
A
b
sor
b
an
ce
Log (1/
T)
Wavelength (nm)
[image:5.595.113.483.549.634.2]172
[image:6.595.91.497.463.644.2]because raw juice was an opaque, frothy and viscous liquid owing to the presence of colloidal substance. These substances would absorb energy from light source thus influence the prediction of sucrose content in the juices. In clear juice samples, those colloidal substances were removed through clarification process.
Table 2. PLS model performances for both juice samples.
Samples Parameters LVs Calibration Prediction R2 RMSEC R2 RMSEP Clear juice Brix 4 0.90 0.63 0.85 0.82
Pol 10 0.91 3.28 0.87 4.10
Raw juice Brix 6 0.92 0.55 0.72 1.08
Pol 6 0.91 3.13 0.75 5.61
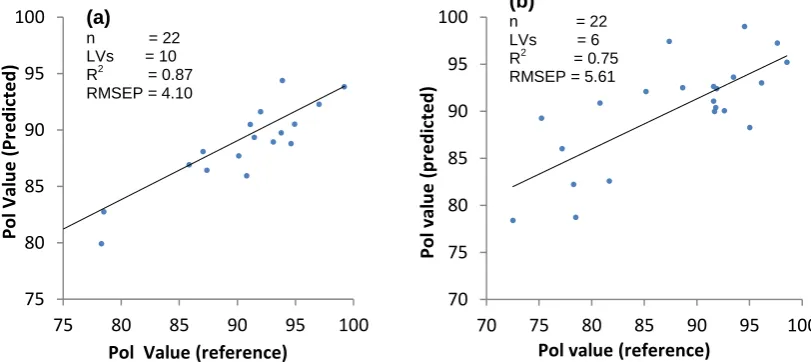
It can be seen from Table 2 that pol prediction for both juice samples are better than brix prediction. This finding is consistent with the study reported by Berding et al. (1991). The performance of prediction models of pol for both juice samples are presented by the scatter plots in Figure 4 (a) and (b), respectively. The performances of these models were evaluated by 22 juice samples in the prediction set. The R2 for clear juice and raw juice were 0.87 and 0.75, respectively. Pol yielded better prediction performance than brix probably because pol was an estimation of sucrose content in juice whereas brix was just an estimation of soluble solids content in the juices. Roggo et al. (2004) claimed that spectroscopic method could be an accurate method to determine pol (sucrose content) and brix. The authors also reported that brix and sucrose are highly correlated, where sucrose content in brix was about 80%. This fact explained why pol prediction was better than brix prediction.
Figure 4. Scatter plots of reference versus predicted pol; (a) clear juice (b) raw juice.
CONCLUSION
The results obtained in this study demonstrated the potential of the Vis/SWNIR spectroscopy to predict brix and pol content in both clear and raw sugarcane juices. For the clear juice samples, the R2 values for brix and pol prediction were 0.85 and 0.87,
75 80 85 90 95 100
75 80 85 90 95 100
Pol Val u e (Pr e d ic te d )
Pol Value (reference)
70 75 80 85 90 95 100
70 75 80 85 90 95 100
Pol val u e (p re d ic te d )
Pol value (reference)
(a)
n = 22 LVs = 10 R2 = 0.87 RMSEP = 4.10
(b)
173
respectively. While for the raw juice samples, the prediction accuracies of brix and pol were slightly lower than the clear juice samples with R2 values of 0.72 and 0.75, respectively. The results of this study suggest that a low-cost and portable Vis/SWNIR spectrometer could offer the possibility to predict sugarcane quality in the field without the need for costly and laborious analysis using the conventional methods. However, the development of a portable mini sugarcane crusher would be needed to supply juice samples for the instrument in the field. Further studies are also needed in order to improve calibration specificity, accuracy and robustness, and to further interpret and develop new applications of this technique in the sugarcane industry.
ACKNOWLEDGEMENTS
The authors acknowledge the financial supports provided by Ministry of Higher Education, Malaysia and National Center for Engineering in Agriculture (NCEA), Toowoomba, Australia. The authors also thank BSES Limited, Bundaberg, for providing samples and equipment.
REFERENCES
Abbott, J. A., Lu, R., Upchurch, B. L. & Stroshine, R. L. 1997. Technologies for non-destructive quality evaluation of fruits and vegetables. Horticultural Reviews, 20, 1-120.
Anon. 2011. Canegrowers Annual Report for 2010/2011, Brisbane, Australia.
Arana, I., Jarén, C., & Arazuri, S. 2005. Maturity, variety and origin determination in white grapes (Vitis vinifera L.) using NIRS. Journal of Near Infrared Spectroscopy, 13, 349–357.
Berding, N., Brotherton, G. A., & Skinner, J. C. 1991. Near infrared reflectance spectroscopy for analysis of sugarcane from clonal evaluation Trials: II. Expressed juice. Crop Sciences, 31, 1024-1028.
Blanco, M., & Villarroya, I. 2002. NIR spectroscopy: a rapid- response analytical tool.
Trends in Analytical Chemistry, 21, 240 - 250.
Cadet, F. & Offmann, B. 1997. Direct spectroscopic sucrose determination of raw sugar cane juices, Journal of Agriculture and Food Chemistry, 45, 166-171.
Mehrotra, R. & Siesler, H. W. 2003. Application of mid infrared/near infrared spectroscopy in sugar industry. Applied Spectroscopy Reviews, 38, 307–354. Moghimi, A., Aghkhani, M. H., Sazgarnia, A., & Sarmad, M. 2010. Vis/NIR
spectroscopy and chemometrics for the prediction of soluble solids content and acidity (pH) of kiwifruit. Biosystems Engineering, 106(3), 295-302.
Næs, T., Isaksson, T., Fearn, T., & Davies, T. 2004. A user-friendly guide to multivariate calibration and classification. Charlton, Chichester, UK: NIR Publications.
Nawi, N. M., Jensen, T. & Chen, G. 2012. The application of spectroscopic methods to predict sugarcane quality based on stalk cross-sectional scanning. Journal of American Society of Sugar Cane Technologists, 32, 16-27.
Nawi, N. M., Chen, G., Jensen, T. & Mehdizadeh, S. A. 2013a. Prediction and classification of sugar content of sugarcane based on skin scanning using visible and shortwave near infrared. Biosystems Engineering, 115, 154-161.
174
Proc. SPIE 8881, Sensing Technologies for Biomaterial, Food, and Agriculture 2013, 88810A (May 17, 2013); doi:10.1117/12.2029395.
Roggo, Y., lduponchel, L., & Huvenne, J. 2004. Quality evaluation of sugar beet (beta vulgaris) by near-infrared spectroscopy. Journal of Agriculture and Food chemistry, 52, 1055-1061.
Taira, E., Ueno, M. & Kawamitsu, Y. 2010. Automated quality evaluation system for net and gross sugarcane samples using near infrared spectroscopy. Journal of Near Infrared Spectroscopy, 18, 209-215.
Valderrama, P., Braga, J. W. B. & Poppi, R. J. 2007. Validation of multivariate calibration models in the determination of sugar cane quality parameters by near infrared spectroscopy. Journal of Brazilian Chemistry Society, 18, 259-266. Walsh, K. B., Guthrie, J. A., & Burney, J. W. 2000. Application of commercially
available, low-cost, miniaturised NIR spectrometers to the assessment of the sugar content of intact fruit. Australian Journal of Plant Physiology, 27, 1175– 1186.