1 ETRP PROGRESS REPORT
Address to:
Director, Environment Technology Office
National Environment Agency
40 Scotts Road, #11-00, Environment Building
Singapore 228231
Attn: ETRP Secretariat
National Environment Agency
Environment Technology Office
40 Scotts Road, #11-00, Environment Building
Singapore 228231
Attn: Project Officer, Ms Teresa Cheong
GUIDELINES FOR ETRP PROGRESS/FINAL REPORT
Project Reference No.: ETRP 1201 105 Project Completion Date: 12/2014
Project Title: Developing Novel Biorefineries using Food Waste as Substrate
Organization: Nanyang Technological University, NEWRI, AEBC
Officer-in-charge: Joycelyn Tang
Project Period (Please tick the appropriate box)
2 Part A
1. PROJECT MANAGEMENT AND EXECUTION
The project is progressing smoothly on schedule as shown below. The projected milestones and
deliverables have all been achieved as detailed in Section “Results and Discussion”. As of July
2013, we have completed the literature review and characterization of food wastes. The two
bioreactors with essential control software will be ready soon for the next phase experiments.
Meanwhile, the saccharification level of food wastes (from cafeteria) was investigated with
commercial enzymes, and the conditions were also optimized. The preliminary studies of solid
state enzyme production were conducted, based on which the process optimization was then
carried out for improving the enzyme production.
Milestones and Deliverables
Implementation Schedule
Year 1 Year 2 Remarks
Q1 Q2 Q3 Q4 Q1 Q2 Q3 Q4
Literature Review
1: Characterisation of KW
2: Construction of 2 HRs (2-5L)
3: Liquid state fermentation of FW by Aspergillus: characterization of enzymes
Actual Implementation
4: Solid State fermentation of FW by Aspergillus characterization of enzymes
5: Optimization of in-house enzymes production
6: Enzymatic hydrolysis of KW using in-house enzymes cocktail produced by Aspergillus
Actual Implementation
2. RESULTS & DISCUSSION 2.1FW Characterization
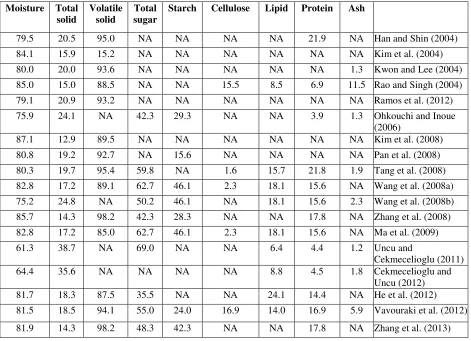
According to the literature, food waste (FW) is mainly composed of carbohydrate polymers
(starch, cellulose, hemicelluloses), lignin, proteins, lipids, acids, and a smaller inorganic portion
(Table 1). Hydrolysis of carbohydrate components, particularly starch, causes the breakup of
3 maltodextrins and monosaccharides, which can be further converted to valuable products through
fermentation, e.g. gaseous and liquid biofuels. Total sugar and protein contents in food waste
[image:3.612.72.543.174.515.2]were typically in the range of 35.5-69.0% and 3.9-21.9%, respectively.
Table 1. Composition of mixed food waste.
Moisture Total solid Volatile solid Total sugar
Starch Cellulose Lipid Protein Ash
79.5 20.5 95.0 NA NA NA NA 21.9 NA Han and Shin (2004)
84.1 15.9 15.2 NA NA NA NA NA NA Kim et al. (2004)
80.0 20.0 93.6 NA NA NA NA NA 1.3 Kwon and Lee (2004)
85.0 15.0 88.5 NA NA 15.5 8.5 6.9 11.5 Rao and Singh (2004)
79.1 20.9 93.2 NA NA NA NA NA NA Ramos et al. (2012)
75.9 24.1 NA 42.3 29.3 NA NA 3.9 1.3 Ohkouchi and Inoue
(2006)
87.1 12.9 89.5 NA NA NA NA NA NA Kim et al. (2008)
80.8 19.2 92.7 NA 15.6 NA NA NA NA Pan et al. (2008)
80.3 19.7 95.4 59.8 NA 1.6 15.7 21.8 1.9 Tang et al. (2008)
82.8 17.2 89.1 62.7 46.1 2.3 18.1 15.6 NA Wang et al. (2008a)
75.2 24.8 NA 50.2 46.1 NA 18.1 15.6 2.3 Wang et al. (2008b)
85.7 14.3 98.2 42.3 28.3 NA NA 17.8 NA Zhang et al. (2008)
82.8 17.2 85.0 62.7 46.1 2.3 18.1 15.6 NA Ma et al. (2009)
61.3 38.7 NA 69.0 NA NA 6.4 4.4 1.2 Uncu and
Cekmecelioglu (2011)
64.4 35.6 NA NA NA NA 8.8 4.5 1.8 Cekmecelioglu and
Uncu (2012)
81.7 18.3 87.5 35.5 NA NA 24.1 14.4 NA He et al. (2012)
81.5 18.5 94.1 55.0 24.0 16.9 14.0 16.9 5.9 Vavouraki et al. (2012)
81.9 14.3 98.2 48.3 42.3 NA NA 17.8 NA Zhang et al. (2013)
Total Solid, Total sugar, Starch, Cellulose, Lipid, Protein and Ash Contents were given in wt% on the basis of dry weight. Volatile solid contents were given as the %VS ratio on total solid basis.
In this study, nine different kinds of FWs were collected from supermarkets, cafeterias and
houses. They were first homogenized using a kitchen blender and then stored in tightly closed
food bags at -20oC until further use. The compositions of the FWs were determined in triplicate,
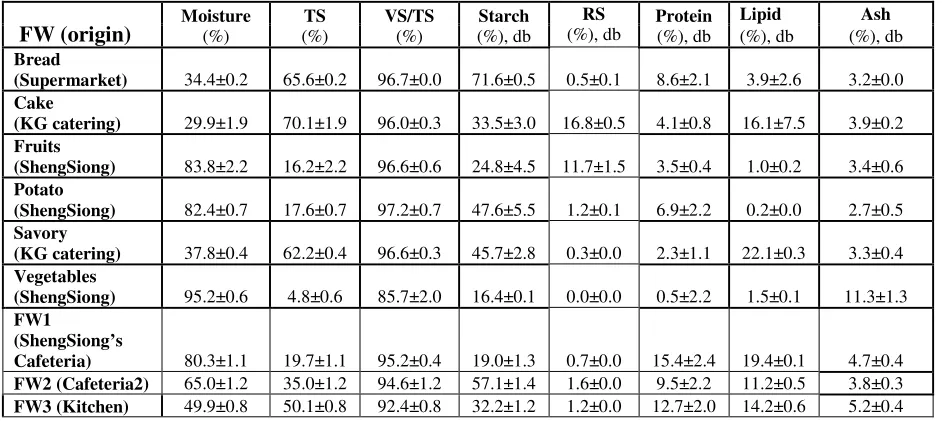
and the average values are presented in Table 2. The compositions of the FWs were all different.
For example, the solid content of pastries like cake, bread and savory were higher, while higher
moisture contents were found in vegetable, potato and fruits. The mixed food wastes made up
from cafeterias and kitchen had a higher protein and lipid content, which might favor microbial
4 Table 2. Composition of different FWs.
FW (origin) Moisture (%) TS (%) VS/TS (%) Starch (%), db RS (%), db Protein (%), db
Lipid Ash (%), db (%), db Bread
(Supermarket) 34.4±0.2 65.6±0.2 96.7±0.0 71.6±0.5 0.5±0.1 8.6±2.1 3.9±2.6 3.2±0.0 Cake
(KG catering) 29.9±1.9 70.1±1.9 96.0±0.3 33.5±3.0 16.8±0.5 4.1±0.8 16.1±7.5 3.9±0.2 Fruits
(ShengSiong) 83.8±2.2 16.2±2.2 96.6±0.6 24.8±4.5 11.7±1.5 3.5±0.4 1.0±0.2 3.4±0.6 Potato
(ShengSiong) 82.4±0.7 17.6±0.7 97.2±0.7 47.6±5.5 1.2±0.1 6.9±2.2 0.2±0.0 2.7±0.5 Savory
(KG catering) 37.8±0.4 62.2±0.4 96.6±0.3 45.7±2.8 0.3±0.0 2.3±1.1 22.1±0.3 3.3±0.4 Vegetables
(ShengSiong) 95.2±0.6 4.8±0.6 85.7±2.0 16.4±0.1 0.0±0.0 0.5±2.2 1.5±0.1 11.3±1.3 FW1
(ShengSiong’s
Cafeteria) 80.3±1.1 19.7±1.1 95.2±0.4 19.0±1.3 0.7±0.0 15.4±2.4 19.4±0.1 4.7±0.4 FW2 (Cafeteria2) 65.0±1.2 35.0±1.2 94.6±1.2 57.1±1.4 1.6±0.0 9.5±2.2 11.2±0.5 3.8±0.3 FW3 (Kitchen) 49.9±0.8 50.1±0.8 92.4±0.8 32.2±1.2 1.2±0.0 12.7±2.0 14.2±0.6 5.2±0.4 Total Solid, Starch, Reducing sugar (RS) Lipid, Protein and Ash Contents were given in wt% on the basis of dry weight (db). Volatile solid (VS)
contents were given as the %VS ratio on total solid basis.
2.2. Pretreatment of FWs with Commercial Enzymes
In order to gauge enzymatic saccharification degree of the mixed food waste (namely FW2 in
Table 2), the commercial enzymes, α-amylase and glucoamylase from Genencor, Danisco
Singapore Pte Ltd (Singapore) were used to treat FW2 (food waste from cafeteria) sequentially.
The optimal pHs for glucoamylase and α-amylase were 5.0-5.8 and 4.2-4.8, respectively.
Amylase activity was assayed according to the method by Bernfeld (1955). One unit (1 U) of α
-amylase activity was defined as the amount of enzyme releasing 1 µmol glucose equivalent in 1 minute under the assay conditions.
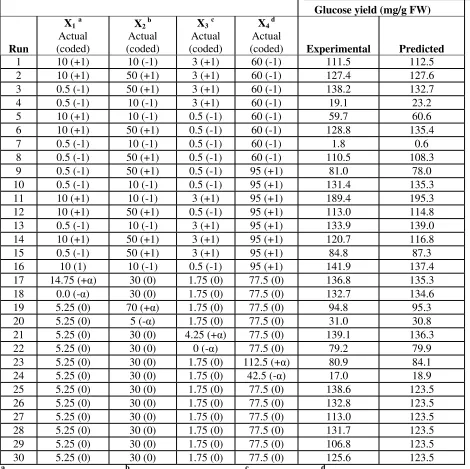
To maximize glucose yield, Response Surface Methodology (RSM) was employed in this study
to optimize operation parameters of enzymatic hydrolysis of FW2 with α-amylase and glucoamylase. Experiments were carried out under different operational conditions with four
independent variables, i.e. substrate loading, α-amylase loadings, pretreatment temperature and duration. The roles of each variable, their interactions in fermentation were also analyzed with a
second-order polynomial model.
Enzymatic pretreatments were conducted in 50 mL Duran bottles placed in a water bath. The
5 acetate buffer (pH 5) and α-amylase. Samples were taken at different time intervals. After the liquefaction by α-amylase, glucoamylase treatment was conducted using a fixed enzyme at a dose of 5U/g FW for 2 hours. To optimize the saccharification reaction as well as to maximize
the glucose production, the effects of solid and enzyme loadings, temperature and time were
investigated through 30 experiments which were based on central composite design. The
experimental conditions and the responses are presented in Table 3.
Table 3. Central composite design with observed and predicted responses of glucose yields. Each row corresponds to a single experiment.
Glucose yield (mg/g FW)
Run X1 a X2 b Actual (coded) X3 c X4 d Experimental Actual (coded) Actual (coded) Actual
(coded) Predicted
1 10 (+1) 10 (-1) 3 (+1) 60 (-1) 111.5 112.5
2 10 (+1) 50 (+1) 3 (+1) 60 (-1) 127.4 127.6
3 0.5 (-1) 50 (+1) 3 (+1) 60 (-1) 138.2 132.7
4 0.5 (-1) 10 (-1) 3 (+1) 60 (-1) 19.1 23.2
5 10 (+1) 10 (-1) 0.5 (-1) 60 (-1) 59.7 60.6
6 10 (+1) 50 (+1) 0.5 (-1) 60 (-1) 128.8 135.4
7 0.5 (-1) 10 (-1) 0.5 (-1) 60 (-1) 1.8 0.6
8 0.5 (-1) 50 (+1) 0.5 (-1) 60 (-1) 110.5 108.3
9 0.5 (-1) 50 (+1) 0.5 (-1) 95 (+1) 81.0 78.0
10 0.5 (-1) 10 (-1) 0.5 (-1) 95 (+1) 131.4 135.3
11 10 (+1) 10 (-1) 3 (+1) 95 (+1) 189.4 195.3
12 10 (+1) 50 (+1) 0.5 (-1) 95 (+1) 113.0 114.8
13 0.5 (-1) 10 (-1) 3 (+1) 95 (+1) 133.9 139.0
14 10 (+1) 50 (+1) 3 (+1) 95 (+1) 120.7 116.8
15 0.5 (-1) 50 (+1) 3 (+1) 95 (+1) 84.8 87.3
16 10 (1) 10 (-1) 0.5 (-1) 95 (+1) 141.9 137.4
17 14.75 (+α) 30 (0) 1.75 (0) 77.5 (0) 136.8 135.3
18 0.0 (-α) 30 (0) 1.75 (0) 77.5 (0) 132.7 134.6
19 5.25 (0) 70 (+α) 1.75 (0) 77.5 (0) 94.8 95.3
20 5.25 (0) 5 (-α) 1.75 (0) 77.5 (0) 31.0 30.8
21 5.25 (0) 30 (0) 4.25 (+α) 77.5 (0) 139.1 136.3
22 5.25 (0) 30 (0) 0 (-α) 77.5 (0) 79.2 79.9
23 5.25 (0) 30 (0) 1.75 (0) 112.5 (+α) 80.9 84.1
24 5.25 (0) 30 (0) 1.75 (0) 42.5 (-α) 17.0 18.9
25 5.25 (0) 30 (0) 1.75 (0) 77.5 (0) 138.6 123.5
26 5.25 (0) 30 (0) 1.75 (0) 77.5 (0) 132.8 123.5
27 5.25 (0) 30 (0) 1.75 (0) 77.5 (0) 113.0 123.5
28 5.25 (0) 30 (0) 1.75 (0) 77.5 (0) 131.7 123.5
29 5.25 (0) 30 (0) 1.75 (0) 77.5 (0) 106.8 123.5
30 5.25 (0) 30 (0) 1.75 (0) 77.5 (0) 125.6 123.5
a
[image:5.612.71.541.250.719.2]6 A reduced cubic model was used to fit the results. A regression equation (Eq. 1) was generated
through the analysis of variance (ANOVA), showing the relationship of the glucose yield to
substrate & enzyme loadings, time and temperature.
Y = +126.01 + 77.28 * X1 + 40.49 * X2 + 23.22 * X3 + 15.63 * X4 10.14 * X12 + 4.05 * X13
-0.082 * X14 - 3.41* X23 - 31.45 * X24 - 3.11 * X34 - 32.08 * X11 X2 -24.12*X1X22 (1)
where X1, X2, X3 and X4 are independent variables representing the α-amylase loadings, substrate loadings, time and temperature, respectively, and Y is the glucose yield (mg/g FW)..
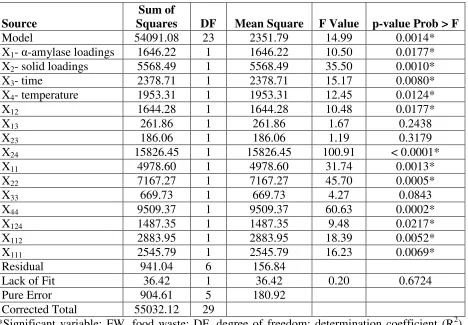
The ANOVA results showed that this model can adequately predict the response variables in
terms of coded factors with 95% confidence at the level of P < 0.001 (Table 4). The model’s
F-value of 14.99 implies that the model is significant, and there is only a 0.01% chance of that a
“model F-value” at this large could occur due to noise. Values of “Prob>F” less than 0.05
indicate that the model terms are significant, while values greater than 0.1 indicate that the model
terms are not significant. As such, Table 4 shows that X1, X2, X3, X4, X12, X24, X11, X22, X44,
X124, X112 and X111 are all the significant terms. The coefficient of determination (R2) for the
enzyme activity was calculated as 0.98, showing that the proposed model can explain 98% of
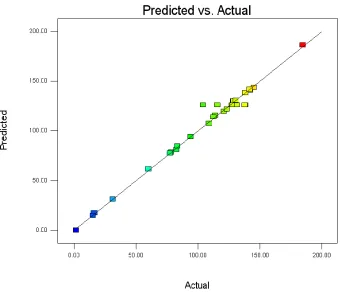
variability in the response. Fig. 1 is a parity plot showing the correlation between the
experimental and predicted values of the response, so that the points cluster around the sloping
line, exhibiting the good fit of the model. Similarly, Fig. 11 also represents an acceptable
variation between the experimental and predicted glucose yields in the range of the operating
variables. The high value of R2 indicates that the reduced cubic equation is able to represent the
system performance in the given experimental domain. Adequate precision measures the signal
to noise ratio, and a ratio greater than 4 is desirable. In this study, a signal-to-noise ratio of 16.62
was obtained, clearly indicating an adequate signal. Therefore, the model generated (Eq. 1) can
7 Figure 1. The observed versus the predicted glucose yields under the experimental conditions.
It appears from Table 4 that all the independent variables have a significant effect on the
response (e.g. glucose yield in Eq. 1). The positive coefficients for X1, X2, X13 and X24 indicate a
positive effect on the saccharification. However, the negative coefficients for X12, X14, X23, X34 ,
X112 and X122 suggest a negative effect on the response concentration.
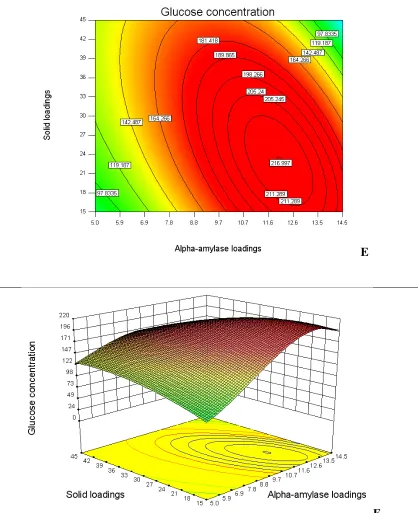
The response surface plots (Fig. 2) are helpful for better understanding the main and interaction
effects of two variables. As can be seen in Figure 1A, a glucose yield of 168.6 mg/g FW was
obtained at an enzyme loading of 7.25 U/g FW within 105 min. At 80oC, increased solid
loadings from 20 to 35% resulted in 18% increase in the glucose yield (Figure 2A). However,
when the substrate loadings were increased from 35 to 50%, the glucose yield decreased from
168.6 to 154 mg/g FW. This might be due to the increased density and decreased water content
of the suspension which prevents α-amylase action on FW. The glucose yield was increased by 14.4% (139.8 to 160 mg/g FW) with increasing the residence time from 30 to 90 min, while a
further 7.5% (160 to 172 mg/g FW) increase was observed when the reaction time was prolonged
8 loading less than 25%, the glucose yield could not be further improved with prolonged reaction
time, and peaked at 168 mg/g FW. Similar trend was also observed at the solid loading higher
than 45%. These in turn suggest that the optimal solid loadings should be in between 25-45% for
efficient hydrolysis of FW. It was found in Figs. 2C and 2D that the applied α-amylase loadings were related to reaction time and temperature, and the optimal α-amylase loadings should be in the range of 7.3 and 13.2 U/g FW. At the 35% solid loading, the highest glucose yield of 203
mg/g FW was obtained with 10.66 U/g FW enzyme loadings at 83.8oC within 105 min. Further
increase in the glucose yield was negligible at the reaction time longer than 3 hours (Figure 2D).
At the optimum temperature of (83.8oC), the highest glucose yield of 217 mg/g FW can be
expected using 22.41% solid loadings for 90 min (Fig. 2E).
Table 4. ANOVA for glucose yield during enzymatic hydrolysis of FW as a function of α -amylase loadings (X1), solid loadings (X2), time (X3) and temperature (X4).
Source
Sum of
Squares DF Mean Square F Value p-value Prob > F
Model 54091.08 23 2351.79 14.99 0.0014*
X1- α-amylase loadings 1646.22 1 1646.22 10.50 0.0177*
X2- solid loadings 5568.49 1 5568.49 35.50 0.0010*
X3- time 2378.71 1 2378.71 15.17 0.0080*
X4- temperature 1953.31 1 1953.31 12.45 0.0124*
X12 1644.28 1 1644.28 10.48 0.0177*
X13 261.86 1 261.86 1.67 0.2438
X23 186.06 1 186.06 1.19 0.3179
X24 15826.45 1 15826.45 100.91 < 0.0001*
X11 4978.60 1 4978.60 31.74 0.0013*
X22 7167.27 1 7167.27 45.70 0.0005*
X33 669.73 1 669.73 4.27 0.0843
X44 9509.37 1 9509.37 60.63 0.0002*
X124 1487.35 1 1487.35 9.48 0.0217*
X112 2883.95 1 2883.95 18.39 0.0052*
X111 2545.79 1 2545.79 16.23 0.0069*
Residual 941.04 6 156.84
Lack of Fit 36.42 1 36.42 0.20 0.6724
Pure Error 904.61 5 180.92
Corrected Total 55032.12 29
[image:8.612.75.543.339.664.2]9 A
10 C
11 E
[image:11.612.105.523.70.583.2]F
12 In summary, enzymatic hydrolysis of domestic FW with α-amylase and glucoamylase was successfully modeled using central composite design and response surface methodology. The
optimum conditions predicted by the model were then validated experimentally. Under the
identified optimal (83.8oC, 22.4% solid loadings, 12.55 U/g FW α-amylase loadings and 90 min reaction), a maximum glucose yield of 217 mg/g FW was obtained, which shows a yield increase
of 43% as compared 123.48 mg/g FW on average achieved in the non-optimized controls.
Besides, 98% of the total starch in FW could be saccharified
2.3. In-house Glucoamylase Production
In order to determine the best substrate and fermentation mode for glucoamylase production,
both submerged and solid-state fermentations were conducted using the FWs described above.
The enzyme production studies were conducted with Aspergillus awamori, which is one of the
well-known glucoamylase producing microorganisms.
2.3.1. Submerged Fermentation
Submerged fermentations of food wastes were conducted using sterilized medium in 250 mL
flasks containing 5% FW (w/v) in 50 mL, 100 mM sodium acetate buffer (pH 5.0) (Figure 3). To
start, 1 mL fungal inoculum was added to each flask and incubated at 30oC and 300 rpm for 6
days. The samples were taken aseptically and stored at -20oC until determination of the enzyme
activity.
Mycelium formation was observed even on second day of the fermentation in each experiment
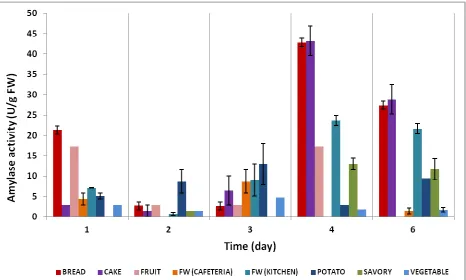
set, showing that the fungus can grow in the FW. The glucoamylase activity profiles are given in
Figure 4. In general, the highest enzyme activities were obtained with cake and bread as
substrates. On the first day, significant enzyme production was determined on bread and fruit
containing media, while lower activities were observed on the others. On the second and third
days, enzyme activities on potato containing media started to increase. The highest activities
were obtained on 4th day of the fermentation, e.g. 43.2 U/g FW on cake, 42.8 U/g FW on bread,
17.3 U/g FW on fruit 23.6 U/g FW on kitchen FW. The enzyme production from FWs having
14 Figure 3. Experiment sets for submerged enzyme production studies (day 0, 2, 4 and 6).
Figure 4. The effect of FWs on GA production in submerged fermentation.
2.3.2. Solid State Fermentation of FW
Solid-state fermentations of food wastes were conducted after sterilizing the fermentation media
[image:14.612.76.542.330.610.2]15 medium and mixed with a sterile spatula aseptically. 5g FW was transferred to each petri plate
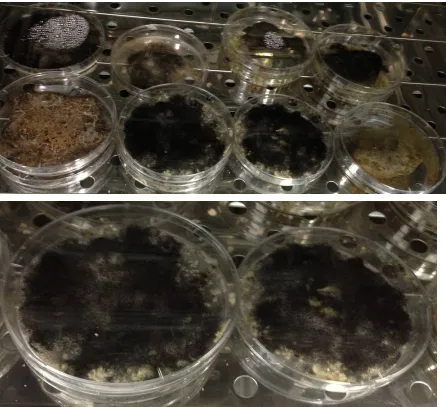
aseptically and the petri dishes were incubated at 30oC for 10 days. Mycelium formation was
observed even on first day of the fermentation in each experiment set, showing that the fungus
can grow in each FW studied (Figure 5). After having such positive results, systematic
experiments will be carried out in Petri dishes to find the optimum conditions for enzyme
production. The spore formation started after the second day of the fermentation and spores
16 Figure 5. Experiment sets for solid state enzyme production studies (day 0, 2, 4 and 8).
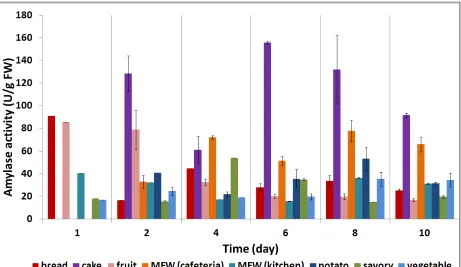
Figure 6 shows the glucoamylase activity profiles. In general, the highest enzyme activities were
obtained with cake, mixed food waste (cafeteria) and fruit. For example, the highest enzyme
activity of 155.8 U/g FW was obtained in the solid fermentation of cake as sole substrate, while
only 43.2 U/g FW was achieved in submerged fermentation of the same FW. This suggests that
solid-state fermentation is a better option than submerged one for enzyme production. Thereby,
the parameters will be optimized to improve the solid-state enzyme production in subsequent
studies.
Although the highest glucoamylase activity was observed in the solid-state fermentation of cake,
17 significant activities were found on bread (90.9 U/g FW) and fruit (85.6 U/g FW) containing
media. Cake contains significant amount of soluble sugar, thus the fungi might consume it first
without production of glucoamylase on day 1. On second day, the enzyme activities on cake
containing media increased markedly and reached to 128.4 U/g FW, followed by that in fruit
(78.9 U/g FW) and potato (40.8 U/g FW). The enzyme activity reached its peak of 155.8 U/g FW
[image:17.612.80.541.215.482.2]on cake containing media on day 6.
Figure 6. The effect of FWs on GA production in solid state fermentation.
3. Plans for the Next 6 and 12 Months Period
Next 6 Months:
• We are targeting to optimize in-house solid-state enzyme production from cake wastes using
Aspergillus awamori. For this, RSM design will be used to ease the optimization procedure and
to determine the interaction between the parameters.
• The recovery of enzyme cocktails will be investigated. For this, we are planning to use simple
autolysis method by heat. Then, the effects of enzyme addition as a solid cake and crude extract
18
• The produced enzyme cocktails will be used to saccharify mixed type food wastes (from
cafeteria and kitchen). For this, the enzyme loading, solid loading, temperature, pH and
hydrolysis time will be optimized in two hydrolytic bioreactors.
Next 12 Months:
• Besides Aspergillus awamori, microbial strains producing other saccharification enzymes
such as α-amylase, cellulase, β-glucosidase and pullulanase, will be cultured and/or co-cultured with Aspergillus awamori to produce an enzyme cocktail in order to improve the saccharification
yield further.
• The effect of different pretreatments, such as heat, alkaline, microwave, ozonation and
ultrasonication on food waste, will be investigated to improve enzyme production and
saccharification.
• The produced enzyme cocktails will be used to saccharify mixed type food wastes. For this,
the enzyme loading, solid loading, temperature, pH and hydrolysis time will be optimized in
hydrolytic bioreactors.
• The residues will be used to produce biogas using anaerobic digestion.
• The final report, publications and project proposal for the continuation of the project will be
prepared.
[image:18.612.71.541.526.724.2]The proposed milestones and deliverables are summarized in Table 5.
Table 5. Updated Gantt chart with completed tasks
Milestones and Deliverables
Year 1 Year 2
Q1 Q2 Q3 Q4 Q1 Q2 Q3 Q4
Literature Review
Characterisation of KW
Construction of 2 HRs (2-5L)
Liquid state fermentation of food
waste by Aspergillus: characterization
of enzymes
19 of food waste by Aspergillus
characterization of enzymes
Optimization of in-house enzymes production
Enzymatic hydrolysis of KW using in-house
enzymes cocktail produced by Aspergillus
Enzymatic hydrolysis of KW using
commercially available enzymes for
benchmarking
Deliverable 1: Bench-scale process for sugar
production
4. PERFORMANCE INDICATORS
Items Target Achieved
Numbers of patents or intellectual properties 1 0
Numbers of researchers* 1 1
Numbers of research man-months* 24 24
Numbers of publications in leading journals 2-3 1
*Include researchers, scientists and engineers (RSEs) and research scholars (Masters & PhDs)
In the project proposal it was proposed to produce 1 IP and 2 to 3 article during the project. We
have already prepared two articles:
-One comprehensive review article on food waste valorization using biological treatment
strategies.
-One article on the optimization of enzymatic glucose production from cafeteria food waste
20 Declaration
I declare that the information of the Development Project as described in the above report is true
and to the best of my knowledge.
Associate Prof Liu Yu
Principle investigator Signature
Principle Investigator
Date
Technology Transfer office (or equivalent)
Signature
Technology Transfer office (or equivalent)
Date
Name
Research Director
Signature
Research Director
Date
Research Director
Organization Stamp: ______________________________________________
<Organization’s name>
* Please note that the completeness of the report submitted will help to ensure the efficient
21
References
Bernfeld, P. 1955. Amylase Alpha and Beta. Methods Enzymol., 1, 149-158.
Cekmecelioglu, D., Uncu, O.N. 2012. Kinetic modeling of enzymatic hydrolysis of pretreated kitchen wastes for enhancing bioethanol production Waste Management
Han, S.K., Shin, H.S. 2004. Biohydrogen production by anaerobic fermentation of food waste. International Journal of Hydrogen Energy 29, 569 – 577.
He, M., Sun, Y., Zou, D., Yuan, H., Zhu, B., Li, X., Pang, Y. 2012. Influence of temperature on hydrolysis acidification of food waste Procedia Environmental Sciences, 16, 85-94.
Kim, D.H., Kim, S.H., Shin, H.S. 2008. Hydrogen fermentation of food waste without inoculum addition. Enzyme and microbial technology 45, 181–187.
Kim, S.H., Han, S.K., Shin, H.S. 2004. Feasibility of biohydrogen production by anaerobic co-digestion of food waste and sewage sludge. International Journal of Hydrogen Energy 29, 1607-1616. Kwon, S.H., Lee, D.H. 2004. Evaluation of Korean food waste composting with fed-batch operations I:
using water extractable total organic carbon contents (TOCw) Process Biochemistry 39, 1183– 1194.
Ma, H., Wang, Q., Qian, D., Gong, L., Zhang, W. 2009. The utilization of acid-tolerant bacteria on ethanol production from kitchen garbage. Renewable Energy 34, 1466–1470.
Ohkouchi, Y., Inoue, Y. 2006. Direct production of L(+)-lactic acid from starch and food wastes using Lactobacillus manihotivorans LMG18011. Bioresource Technology, 97, 1554–1562.
Pan, J., Zhang, R., El-Mashad, H.M., Sun, H., Ying, Y. 2008. Effect of food to microorganism ratio on biohydrogen production from food waste via anaerobic fermentation. International Journal of Hydrogen Energy, 33, 6968-6975.
Ramos, C., Buitron, G., Moreno-Andrade, I., Chamy, R. 2012. Effect of the initial total solids concentration and initial pH on the bio-hydrogen production from cafeteria food waste. International Journal of Hydrogen Energy, 37, 13288-13295.
Rao, M.S., Singh, S.P. 2004. Bioenergy conversion studies of organic fraction of MSW: kinetic studies and gas yield–organic loading relationships for process optimisation. Bioresource Technology 95,
173–185.
Tang, Y.Q., Koike, Y., Liu, K., An, M.Z., Morimura, S., Wu, X.L., Kida, K. 2008. Ethanol production from kitchen waste using the flocculating yeast Saccharomyces cerevisiae strain KF-7. Biomass Bioenergy 32, 1037–1045.
Uncu, O.N., Cekmecelioglu, D. 2011. Cost-effective approach to ethanol production and optimization by response surface methodology. Waste Management, 31(4), 636-643.
Vavouraki, A.I., Angelis, E.M., Kornaros, M. 2012. Optimization of thermo-chemical hydrolysis of kitchen wastes. Waste Management.
Wang, Q., Ma, H., Xu, W., Gong, L., Zhang, W., Zou, D. 2008a. Ethanol production from kitchen garbage using response surface methodology. Biochemical Engineering Journal, 39, 604-610.
Wang, Q., Wang, X., Wang, X., Ma, H. 2008b. Glucoamylase production from food waste by Aspergillus niger under submerged fermentation. Process Biochemistry 43, 280–286.
Zhang, B., He, P.J., Ye, N.F., Shao, L.M. 2008. Enhanced isomer purity of lactic acid from the non-sterile fermentation of kitchen wastes Bioresource Technology 99, 855–862.