1
Dissertation on
“A COMPARATIVE STUDY OF SERUM CHOLINESTERASE
AND LIVER FUNCTION TESTS IN LIVER DISEASE”
Submitted in partial fulfilment for the Degree of
M.D GENERAL MEDICINE
BRANCH – I
INSTITUTE OF INTERNAL MEDICINE
MADRAS MEDICAL COLLEGE
THE TAMIL NADU DR. MGR MEDICAL UNIVERSITY
CHENNAI - 600003
2
CERTIFICATE
This is to certify that the dissertation entitled
“A COMPARATIVE
STUDY OF SERUM CHOLINESTERASE AND LIVER FUNCTION
TESTS IN LIVER DISEASE.”
is a Bonafide original work done by
Dr. SHANMUKAM.V
, post graduate student, Institute of Internal
Medicine, Madras Medical College, Chennai-03, under our guidance and
supervision in partial fulfilment of regulations of the Tamilnadu Dr. M.G.R
Medical University for the award of M.D. Degree Branch I (General
Medicine) during the academic period from 2016 to 2019.
PROF. Dr. P. VASANTHI, M.D. PROF. Dr. S. TITO, M.D.
Guide and Supervisor, Director (i/c) and Professor of Medicine, Professor of Medicine, Institute of Internal Medicine,
Institute of Internal Medicine, Madras Medical College & RGGGH, Madras Medical College & RGGGH, Chennai- 600003
Chennai – 600003
PROF.DR. S.RAGHUNANTHANAN, M.D, Dr.R.JAYANTHI,M.D.,FRCP
CO – Guide (GLAS).
Professor of Medicine – IMCU, DEAN
3
DECLARATION
I hereby solemnly declare that the dissertation entitled “A COMPARATIVE STUDY OF SERUM CHOLINESTERASE AND LIVER FUNCTION TESTS IN LIVER DISEASE” is done by me at Institute
of Internal Medicine, Madras Medical College & Rajiv Gandhi Government General Hospital, Chennai during August 2017 to January 2018 under the guidance and supervision of PROF. Dr. P. VASANTHI, M.D, Institute Of Internal Medicine, Madras Medical College, Chennai-03. This dissertation is submitted to The Tamilnadu Dr. M.G.R Medical University, Chennai towards the partial fulfilment of requirement for the award of M.D. Degree in General Medicine (Branch I)
Place: Dr. SHANMUKAM.V Date: Post Graduate Student M.D. General Medicine, Institute of Internal Medicine,
4
ACKNOWLEDGEMENT
I would like to thank our respected Dean, Madras Medical College, Prof. Dr. R. JAYANTHI, M.D, FRCP(GLAS), for her kind permission to use the hospital resources for this study.
I would like to express my sincere gratitude to my bellowed Professor and Director, Institute of Internal Medicine Prof. Dr. S. TITO M.D., for his guidance and encouragement.
With extreme gratitude, I express my indebtedness to my respected Chief and teacher Professor Dr. P. VASANTHI., M.D., for her motivation, advice and valuable criticism, which enabled me to complete this work.
I would also like to thank Professor DR. S. RAGHUNANTHANAN. M.D for his guidance and valuable criticism.
I would like to express my gratitude to my former Chief and teacher PROF. Dr. R. SABARATNAVEL.M. D and former Director, Institute of Internal Medicine, PROF. Dr. S. MAYILVAHANAN., M.D.
I am extremely thankful to Assistant Professor of Medicine Dr.JACINTH PREETHI, M.D., and Dr. A. PRIYATHARICINI, M.D., for their co-operation and guidance.
I express my heartfelt gratitude to my Postgraduate colleagues Dr. JAINY, Dr. SABARISH, and Dr. NOKCHUR IMCHEN for their constant support and encouragement.
I am immensely grateful to the generosity shown by the patients who participated in this study.
5
CONTENTS
S NO TITLE PAGE NO
1. INTRODUCTION 6
2. AIMS AND OBJECTIVES 9
3. REVIEW OF LITERATURE 10
4. MATERIALS AND METHODS 51
5. OBSERVATION AND RESULTS 56
6. DISCUSSION 84
7. CONCLUSION OF THE STUDY 90
8. LIMITATIONS OF THE STUDY 91
9. BIBLIOGRAPHY 93
10.
ANNEXURES
i. PROFORMA
ii. ETHICAL COMMITTEE APPROVAL iii. PLAGIARISM SCREENSHOT
iv. PLAGIARISM CERTIFICATE v. INFORMATION SHEET vi. CONSENT FORM
vii. MASTER CHART
6
7
INTRODUCTION
Liver being the largest vital organ, has wide range of functions. Liver disease are one of the major causes of mortality in India and also worldwide. Biochemical tests of assessing the liver function, includes measurements of serum bilirubin, serum protein, serum albumin, serum aspartate transaminase, alanine transaminase and alkaline phosphatase. These tests often show abnormal results in patient with clinical conditions other than liver dysfunction.
Serum bilirubin can be raised because of increased erythrocyte lysis other than failure of hepatic clearance. Serum transaminase can be raised due to increased release from non-liver tissue sources. Albumin produced by the hepatocyte are synthesized by polyribosomes bound to the rough endoplasmic reticulum before secreted into plasma. Decrease in albumin reflects decreased hepatic synthesis, although changes in plasma volume and losses, for instance in to gut or urine, may contribute to hypoalbuminemia. Therefore, there comes a need for a test, which should be specific as well as sensitive for liver disease
8
9
AIMS & OBJECTIVE
- To estimate the level of serum cholinesterase and liver function tests in both liver disease cases and non-liver disease cases and comparing them. - To estimate the correlation between the serum cholinesterase level with
other liver function tests within the liver disease group.
10
REVIEW OF LITERATURE
The very purpose of this study to evaluate the serum cholinesterase activity as a test of liver function. The test had considerable merit, as it appeared to be a direct test of liver function which did not depend on any abnormalities of the protein fraction.
HISTORY:
Estimation of the level of activity of the cholinesterase found in serum was first suggested by McArdle (1940), as a useful means for differentiating hepatic from post – hepatic jaundice1
In 1946, Brauer and Root ² and in 1947 Ellis, sanders, Shirley and Bodansky ³ showed that Serum cholinesterase level was lowered when rat livers were damaged by carbon tetrachloride.
Brauer& Root⁴ also found, rise in plsma cholinesterase initially, when administering carbon tetrachloride to dogs, and after one to four hours, it dropped below normal.
The latter can be explained by the fact, that there is outpouring of the enzyme, which results in rise in level.
11
Croft & Richter ⁶ observed serum cholinesterase rises during muscle exercise.,
Bauer⁷ & many others ⁸ ,⁹ ,10 ,11 ,12 ,13 ,1⁴ ,1⁵ ,1⁶ observed that serum cholinesterase decreased in liver disease and normal in obstructive jaundice.
Any disease producing cachexia has decreased serum cholinesterase level was observed by Schifrin, Tuchman and Antopol10‚13.
McArdle1 reported normal cholinesterase activity of serum in diabetes and hyperthyroidism.
Faber 17‚18 noted that low serum albumin was associated with low cholinesterase.
LIVER DISEASE:
Liver is the largest gland in humans. Liver weighs about 1500g and 5% of body weight of a new born. The most common liver diseases are Alcoholic liver disease, Infective hepatitis, Obstructive Jaundice, Liver abscess, Liver metastasis etc.,
12
FUNCTION OF LIVER:
1. Carbohydrate, fat and protein metabolism 2. Bile production and secretion
3. Storage of glycogen 4. Protein synthesis
5. Production of bile pigments and Heparin 6. Erythropoiesis (in fetus)
HISTOLOGY OF LIVER:
HISTOLOGICAL STRUCTURE OF
LIVER
STROMA
RETICULAR NETWORK
CONNECTIVE TISSUE CAPSULE
TRABECULAE
PARENCHYMA
BLOOD VESSELS
BILE DUCT
13 CONCEPT OF HEPATIC LOBULES:
CLASSIC LOBULE
:Structure and functional unit of the organ is classic lobule. It is hexagonal in shape. It has a vein at the center, which is the central vein and portal tracts in the periphery.
PORTAL LOBULE
:14
HEPATIC ACINUS (ACINUS OF RAPPAPORT):
15
Hepatocyte cells are arranged in cords oriented around the central hepatic vein. Vascular sinusoids are present between these cords. Fenestrated endothelial cells line their sinuosity and form space of Disse.
Kupffer cells belonging to monocyte family are found in the space. Stellate cells involved in vitamin A storage are found scattered in this space. They are responsible for forming collagen when there is liver inflammation.
16 ALCOHOLIC LIVER DISEASE:
INCIDENCE:
Worldwide mortality form alcoholic liver disease is estimated to be 1,50,000/year. 90-100% among heavy drinkers will develop hepatic steatosis in 10years. Only 10-30% develops steato hepatitis and 8-20% will develop cirrhosis in the same period.
Liver cirrhosis develops in 6 – 14% of those persons who consume greater than 60-80g alcohol, daily for man and greater than 20g, daily for women.
Despite cessation of alcohol use, only 10% will have normalization of liver histology and liver function tests
PROGRESSION IN ALCOHOLIC LIVER DISEASE
Normal liver 90 to 100 percent Fatty liver
10 to 35 percent 80 to 20 percent
Alcoholic hepatitis cirrhosis
17
BEVERAGES AND THEIR ALCOHOL CONTEST
1. 12 g of alcohol present in 12oz of Beer 2. 12 g of alcohol present in 50oz of Wine
18 PATHOGENESIS:
Pathophysiology of Alcohol induced liver injury
Alteration in membrane fluidity
Fatty acid ethylesterss, phosphatidylethanol
Alcohol
Lipid peroxidation
Toll like receptor heat shock protein
Decreased
Induces CYP2E1 Hydroxy ethylradicals
Aldehyde Iron overload
Perivenular hypoxic
Endotoxemic
SAM synthesis vitA & VitE Antioxidant
defense Mitochondria
19
CENTRILOBULAR HYPOXIA:
Chronic alcohol ingestion have demonstrated susceptibility of the hepatic pericentral area to hypoxemic due to parallel competitive O2 consumption by ethanol metabolism.
NEUTROPHIL INFILTRATION AND ACTIVATION:
The characteristic pathologic hallmarks of alcohol hepatitis infiltration of neutrophils
Both IL-8 and arachidonic acid metabolite acts as a neutrophil chemoattractant
Kupffer cell secreting inflammatory mediators also have a role in ethanol induced hepatic injury.
ANTIGENIC ADDUCT FORMATION:
Acetaldehyde and hydroxy ethyl radicals bind covalently to protein present in the hepatocytes, thereby forming adducts that are antigenic
ACTION OF INJURIOUS CYTOKINES:
Many studies have demonstrated increased levels of the proinflammatory cytokines, TNFα and IL - 6
20
COFACTORS THAT POTENTIATE THE DEVELOPMENT OF ALCOHOL LIVER DISEASE.
AGE:
Early age alcohol consumption is more likely associated with alcoholism later in life.
GENDER:
Overall prevalence is higher among men than women.
Women are more prone to alcohol related injury and fibrosis then men, for the same amount of the alcohol consumption.
HEPATITIS C INFCETION:
14 % to 36% individual with Alcohol liver disease also have chronic infection with hepatitis C.
Increases the risk of HCC.
HBV INFECTION:
Datas suggest that chronic HBV infection and alcohol consumption increases the risk for HCC.
MEDICATIONS:
21 EXCESS IRON:
Iron and alcohol generate reactive O2 species that promote lipid peroxidation of cell membrane and further damage to cellular integrity occurs.
INFECTIVE HEPATITIS:
HEPATITIS A:
It is usually a self-limited illness that does not become chronic disease. Fulminant hepatic failure occurs in less than 1 percent of cases.
HAV is a member of the genus Hepato virus in the family picornoviridae.
It is usually transmitted by the faeco oral route.
PATHOGENESIS:
Hepatic injury occurs because of the host immune response to HAV. Viral replication occurs in the hepatocyte cytoplasm. Hepatocyte damage and destruction of infected hepatocytes is mediated by human leukocyte antigen – restricted, HAV- specific CD8+ T lymphocytes and natural killer cells. Interferon- gamma appears to have a central role in promoting clearance of infected hepatocytes.
HEPATITIS B:
22 PATHOGENESIS:
The pathogenesis of HBV related liver disease is largely due to immune mediated mechanism. It can also case direct cytotoxic liver injury.
IMMUNE MEDIATED LIVER INJURY:
HBV related liver disease is generally thought to be related to cytotoxic T cell mediated lysis of infected hepatocytes.
Patient with chronic hepatitis B, who clear HBeAg have more vigorous cytotoxic T lymphocyte response to HBV antigen than those who remain HBe Ag positive.
Fulminant hepatitis B is believed to be due to massive immune mediated lysis of infected hepatocytes.
DIRECT CYTOTOXIC LIVER INJURY:
There is no correlation between viral load and the severity of liver disease. Direct cytopathic liver injury can occur when the viral load is very high as in fibrosing cholestatic hepatitis.
HEPATITIS C:
An estimated amount of 130-170 million people is affected by Hepatitis C infection worldwide.
Around 75-85% will develop chronic infection.
23
Around 5 – 20 percent people develops cirrhosis over the course of CLD
1 – 5percent will develop hepatocellular carcinoma.
HCV is a single stranded RNA virus, which belongs to Genus Hepa – C virus and family. Flavi – viridae.
It has high spontaneous mutation rate. There are 11 geno types with 90 sub types.
PATHOGENESIS:
DIRECT CELL INJURY DUE TO VIRAL REPLICATION
Geno type 1 – high viral application
Geno type 1 b – more progressive liver disease
IMMUNE MEDICATED CELL INJURY:
CD8+T lymphocyte found in portal, periportal and lobular areas in patients with hepatitis C infection.
FACTORS PROMOTING CIRRHOSIS IN HCV INFECTION:
Male sex
Age over 40years at the time of infection
Alcohol use
25 OBSTRUCTIVE JAUNDICE
BENJAMIN CLASSIFICATION 1983
Type 1: complete obstruction
It has classical symptoms with biochemical changes. Tumors: Ca head of pancreas
ligation of the common Bile duet cholangio carcinoma
parenchymal liver disease
Type 2: Intermittent obstruction
Symptoms and biochemical parameters changes but jaundice may or may not be present.
Choledocholithiasis Periampullary tumor Duodenal diverticula Choledochal cyst
26 Type 3: chronic incomplete obstruction:
Pathological changes are present in bile duct and liver with or without classical symptoms
Strictures of the CBD Congenital
Traumatic
Sclerosis cholangitis Post radio therapy
Stenosed biliary enteric anastomosis Cystic fibrosis
Chronic pancreatitis
Stenosis of the sphincter of oddi
Type 4: segmental obstruction
One or more segment of intra hepatic biliary tract should be obstructed Traumatic
27 HEPATIC FIBROSIS AND CIRRHOSIS:
Hepatic fibrosis can be defined as a reversible wound healing response characterized by the accumulation of extra cellular matrix or ‘scar’, it follows chronic liver disease but not self-limited.
Hepatic stellate cells activation is a main central event in hepatic fibrosis.
‘Not only is hepatic fibrosis reversible, but it is also increasingly clear that cirrhosis may be reversible as well. The exact stage at which fibrosis / cirrhosis becomes truly irreversible and its biologic determinants, are not known19
20 types of collagens are identified in the liver. Type 1, 3, 5, 11 are largely present in the capsule, blood vessels and in the portal triad.
Type 4 collagens are present in the space of Disse as delicate strands.
In fibrosis, deposition of type1 and 3 collages results in septae formation. Blood shunting occurs due to vascular channels formation in these septae. Irrespective of etiology, cirrhosis is initiated by hepato cellular necrosis followed by collagen gets deposited in the space of Disse
Fenestrations in the Sinusoidal cells are obliterated
No exchange of solutes between plasma and hepatocytes
Secretory function of liver gets affected.
28
Perisinusoidal cells and stellate cells acquire myofibrils which cause increased vascular resistance in the liver.
29 CAUSE OF FIBROSIS AND CIRRHOSIS
PRESINUSOIDAL FIBROSIS
I. Idiopathic portal fibrosis II. Schistosomiasis
PARENCHYMAL FIBROSIS
DRUGS AND TOXIC
Alcohol Methotrexate Vitamin A Isoniazid Aminodarone Perhexiline maleate α methyldopa
INFECTIONS
chronic hepatitis B and C brucellosis
30 AUTO IMMUNE DISEASE:
Auto immune hepatitis
METABOLIC GENETIC DISEASE Wilson disease
Genetic hemochromatosis α,1 anti trypsin deficiency
carbohydrate metabolism disorder lipid metabolism disorder
urea cycle defects amino acid metabolism porphyria
bile acid disorder
BILIARY OBSTRUCTION:
primary biliary cirrhosis secondary biliary cirrhosis cystic fibrosis
31 IDIOPATHIC/ MISCELLENOUS:
Non alcoholic steato hepatitis Indian childhood cirrhosis Granulomatous liver disease Polycystic liver disease
POST SINUSOIDAL FIBRONS
Sinusoidal obstruction syndromes (venoocculusive disease)
CLINICAL FEATURE OF CIRRHOSIS
Anorexia, wasting, and easy fatiguability Jaundice
Hyper dynamic circulation Spider neavi
Palmar erythema White nails Hypogonadism Gynecomastia
Enlargement of alcoholic (alcoholic) Ascites, peripheral edema
32 COMPLICATION OF CIRRHOSIS
1. PORTAL HYPERTENSION
Portal hypertensive gastropathy Gastroesophageal varices Splenomegaly
Hypersplenism Ascites
Spontaneous bacterial peritonitis Hepatorenal syndrome type1, 2 Hepatic encephalopathy
Portopulmonary hypertension Hepatopulmonary syndrome Malnutrition
COAGULOPATHY
Factor deficiency Fibrinolysis
Thrombocytopenia
BONE DISEASE
33 HEMATOLOGIC ABNORMALITIES
Hemolysis Anemia
34 LIVER FUNCTION TEST
Routine liver function test includes
1. Serum albumin
Albumin is the major constituent of plasma protein with concentration of 3.5 – 5.0 g/dl
Liver synthesis around 12g albumin per day, around 25% of total hepatic protein synthesis
FUNCTIONS
1. Colloidal osmotic pressure 2. Transport function
3. Nutritive function 4. Buffering function
Hypoalbuminemia occur when there is damage to hepatocytes and decreased ability to synthesize albumin
However other causes of Hypoalbuminemia - Enteropathy
- Malnutrition - Kidney disease
- Hormonal disturbances
35
Serum albumin can be used for assessing the prognosis in chronic liver disease Pre albumin, which is also synthesized by liver, has shorter half life
PROTHROMBIN TIME:
Prothrombin Time is a measure the rate of formation of thrombin from prothrombin.
This is dependent on factor II, VII, IX, &X, and other factors along the extrinsic pathway. Thus, prothrombin time is a measure of hepatocyte synthetic function.
Normal value: 10.9 – 12.5seconds Prothrombin time can also be increased by
i. Use of anticoagulants ii. Deficiency of vit K iii. DIC
iv. Clotting factor deficiencies
36
TESTS FOR HEPATO CELLULAR DAMAGE AND EXCRETORY FUNCTION OF LIVER
I. AST (SGOT) – Aspartate aminotransferase II. ALT (SGPT) – alanine aminotransferase
ALT enzyme found in the hepatocyte cytoplasm
But, AST found in organs like skeletal muscle, brain, kidney, myocardium, RBC, pancreas, in the cytoplasm and mitochondria
NORMAL VALUES:
ALT – 10-55 U/L
AST- 10-40 U/L
In patients with elevated AST levels disproportionate to ALT levels, extrahepatic origin of this enzyme must be excluded. Both enzymes are high in severe rhabdomyolysis.
In initial phase of hepatocellular damage, enzymes elevate, but correlates poorly with severity of liver injury.
So, it becomes not a good predictor of the outcome in liver disease.
Ureamia can cause a falsely low serum levels of AST
AST/ALT ratio:
1. Alcoholic hepatitis - ≥ 2 2. Cirrhosis - > 1
3. Nonalcoholic steatohepatitis - ≤ 1
37 MARKERS OF CHOLESTASIS:
ALKALINE PHOSPHATASE(ALP):
It is a hydrolase enzyme responsible for removing phosphate groups, from many types of molecule including nucleotides, alkaloids and proteins.
It is present in all tissue, particularly concentrated in liver, bile duct, kidney bones, placenta, and intestinal mucosa.
Three Isoenzymes of ALP:
1. ALP-I- present in Intestine
2. ALP-L- tissue, nonspecific (Liver , bone, kidney) 3. ALP-p-Specific in placenta
Half life- 5 – 7 days
Normal level-35 – 130U/L
CONDITIONS WITH RAISED LEVELS:
1. Biliary obstruction 2. Osteoblastic bone tumor 3. Hepatitis
38 9. Hyperthyroidism
10.Hyperparathyroidism 11.Myocardial infarction 12.Pregnancy
Wilson’s disease can be associated with very low undetectable levels of alkaline phosphatase.
“BY STANDER PHENOMENON”: Values are raised as a result of nonspecific hepatitis in Hodgkin disease and malignancies of kidney, but without direct liver involvement.
“REGAN ISOENZYME”: ALP levels are raised in patients with malignancy but without bone/liver involvement
GAMMA GLUTAMYL TRANSPEPTIDASE (GGTP):
It is microsomal enzyme, formed in hepatocyte, biliary epithelium, kidney, pancreas, heart, lung, brain, and spleen.
Normal: 0-30 U/L
Values are raised in cholestasis GGT/ALP > 2.5 suggest alcoholism 5’ NUCLEOTIDASE:
It is formed in liver, pancreas, blood vessels, brain and myocardium.
39
Although, it is elevated in cholestasis but lags behind elevations of GGT and ALP.
BILIRUBIN:
Synthesis of bilirubin
Hemoglobin Heme
Biliverdin
Biliverdin reductase
Bilirubin
(RED YELLOW)
(GREEN)
NADPH+ H+
NADP+ H2O2
CO
Globlin Amino acid pool ( Ring Open)
Heme- oxygenase system (NADPH,Cytohromic C&O2) O2
40
[ Normal value < 1.1 g/dl]
Bilirubin is fractionated in to direct and indirect bilirubin
DIRECT BILIRUBIN:
1. Also called conjugated bilirubin 2. Water soluble
3. Make up less than 10% 4. Excreted in urine
INDIRECT BILIRUBIN:
1. Also called as Unconjugated bilirubin 2. Lipid soluble
41
CAUSES OF INCREASED INDIRECT BILIRUBIN
1. Hemolysis
2. Ineffective erythropoiesis 3. Hematoma resolution 4. Rhabdomyolysis
CAUSES OF INCREASED DIRECT BILIRUBIN:
1. Hepatitis
2. Obstructive jaundice 3. Cirrhosis of liver 4. Metastatic liver disease
Conjugated hyperbilirubinemia cannot differentiate hepatocellular liver injury from biliary obstruction.
Since, serum bilirubin indicates prognosis in liver cirrhosis, acute liver failure, alcoholic hepatitis, and primary biliary cirrhosis, It is incorporated in CHILD PUGH and MELD scoring system
PROGNOSTIC SCORING USED IN LIVER CIRRHOSIS
I. Child Turcotte Pugh classification (CTP) II. Model for end stage liver disease (MELD) 1. CHILD TURCOTTE PUGH SCORE (CTP)
42
43
CHILD PUGH CLASSES AND THEIR SURGICAL OUTCOMES:
Class A- well compensated cirrhosis
There is only moderate increase in surgical risk
Class B and C
There is substantial increase in surgical risk
In child class C surgery should be done only in life threatening conditions example incarcerated hernia
Extreme care is essential in patients undergoing surgery. Complication should be treated before elective surgery
MODEL FOR ENDSTAGE LIVER DISEASE (MELD)
MELD scoring system is based on serum bilirubin, serum creatinine and INR value
44
ADVANTAGES OF MELD SCORING SYSTEM OVER CTP
Variables in CTP lack reproductivity and consistency Patients are classified only into three categories in CTP Patients with severe decompensation are not quantified CTP prone to subjective variations
Although MELD score is advantageous over CTP scoring system, CTP scoring is used in our study to grade the severity of chronic liver disease.
CHOLINESTERASES:
Cholinesterase are a group of enzymes preferable splitting choline and thiocholinester
There are two types of cholinesterase
Acetyl cholinesterase Serum or butyrl cholinesterase Or
45 ACETYLCHOLINESTERASE (AchE):
If not for cholinesterase, which are a family of enzymes known to catalyze the hydrolysis of acetylcholine to choline and acetic acid, thereby impeding the neurotransmitter ability to signal contraction – skeletal muscle would to incapable of relaxation²⁰ (Pohanka, 2011).
AchE is structurally determined to have much narrower substrate specificity than BchE (Butyrl cholinesterase), as they specifically bind to Ach.
The existence of large aromatic residue from the volume of the AchE aromatic gorge creates a narrow pathway, allowing for higher selectivity of the enzyme at its active site21 (Sussman et al, 1991).
This enzyme would require more positive charged substrate or inhibitor than BchE
SITES:
RBC, CNS, PNS and in MUSCLES
MAJOR PROPERTIES:
High turnover
High affinity for acetylcholine Low affinity for non-cholinester
46
SERUM CHOLINESTERASE (PSEUDO (OR) BUTYRL CHOLINESTERASE):
BChE (Butyrl cholinesterase) more commonly found in the liver and serum of the organisms²².
BChE is known to improve the hydrolysis rate of cocaine, protect the mice from cocaine’s toxic effects, and protect the human body from OPC compounds, suggestive of detoxification role in the body²³,²⁴ ‚²⁵ .
BChE has a wider active site than AchE, it has lesser aromatic residues lining the catalytic gorge and therefore is more voluminous and easily accomodative for various substrate, specifically for butyrlcholine (Nicolet et al,2003²⁶ .
HALF LIFE 12 days
SERUM CHOLINESTERSE IN VARIOUS PHYSIOLOGICAL AND PATHOLOGICAL CONDITIONS:
Many investigators 18,27,28,29 have studied serum cholinesterase in healthy people and have stated the wide range of variation in enzyme concentration from person to person
Difference in enzyme activity did not correlate with age, sex, weight, height or surface area.
47 LOW SERUM CHOLINESTERASE
1. LIVER DISEASE AND DISEASE OF THE BILIARY SYSTEM: when hepatic parenchyma deceased, the serum cholinesterase decrease, almost invariably. This finding was observed by Antopol et al27
Depression is more marked in patient with CLD, such as cirrhosis than in patients with acute condition such as viral hepatitis, ascending cholangitis etc.
Serial studies of serum cholineterase in both acute and chronic disease have shown that, changes in its concentration closely reflect changes in the hepatocellular function.
When compared with other liver function tests (serum albumin, serum bilirubin, SGPT, SGOT, total protein), none appeared to mirror the changing status of the hepatic parenchyma as sensitively as did the serum cholinesterase.
Normal levels of serum cholinesterase activity were found in patients suffering with obstructive jaundice, unless complicated by considerable hepatic parenchymal involvement.
2. MALNUTRITION AND CHRONIC DEBILITATING DISEASE: Low levels have been formed in blood from patients, who were mal nourished, as a result of starvation, anorexia or any chronic inflammatory disease.
48 3. ANEMIA
Many authors have commented upon low level of serum cholinesterase in various type of anemia’s such as, pernicious anemia, anemia due to celiac sprue, cooley’s anemia, anemia due to blood loss, and anemia of chronic infection.
4. OPC poisoning and drugs acting through enzyme inhibition.
5. Drugs such as caffeine, theophylline, aresenochlonline, morphine, desomorphine, codeine, phenothiazine derivatives, procaine hydrochloride, etc., are known to decrease cholinesterase activities in serum 31,6,32,33,34. The mechanism is not known.
6. European studies shows that there is a prevalence of about 3- 4% of
congenital serum cholinesterase deficiency 35
7. Serum cholinesterase is found to be decreased in some community people in southern India (e.g Arya vysya chettiar)44
Disease state in which serum cholinesterase is normal to high
Myasthenia gravis36 Bronchial asthma³⁷ ‚³⁸ Epilepsy 28,30
Hyperthyroiudism38,29,30 Diabetes milletus 28,30
49
Conditions in which serum cholinesterase activity is high
1. Nephrosis38,18:
Elevated level of cholinesterase in the serum of patients with nephrotic syndrome have been found by several investigators. One of the speculation is that the high level of serum cholinesterase in nephrosis reflects on increased and maximal effect of liver to synthesis new proteins.
Since the size of cholinesterase molecule is over twice the size of the albumin molecule, it does not pass through the glomerular membrane and not dissipated in the urine.
2. Exercise
Croft and Richter6 reported, the vigorous muscular exercise of short duration cause a transient increase in serum cholinesterase, which returned to normal after rest.
50
MATERIALS
AND
51 MATERIALS AND METHODS:
SOURCE OF DATA:
Patients who were admitted in the Institute of Internal Medicine, Madras Medical College and Rajiv Gandhi Government General Hospital, Chennai-600003
SAMPLE SIZE - 150
Group I : Liver disease patients- 75
Group II: Non Liver disease patients – 75
STUDY DESIGN:
Hospital based cross sectional study
STUDY DURATION: 6 months(Aug 2017 – Jan 2018)
INCLUSION CRITERIA:
Patients with any liver disease like infective Hepatitis, Liver cirrhosis, Obstructive Jaundice, Liver metastasis, Liver abscess were included.
EXCLUSION CRITERIA FOR BOTH GROUPS:
A. Patients with age <20 or > 70 years B. Acute abdominal disease
C. Chronic Infection
52 F. Organophosphorus poisoning
G. Exposure to Succinylcholine, Cocaine, codeine and morphine H. Acute myocardial infarction.
DATA COLLECTION AND METHODS:
After selection, patients were subjected to thorough history taking and clinical examination. Following Investigations were performed
1. Serum cholinesterase – DGKC method 2. Total and direct bilirubin – DMSO method45
3. Alanine aminotransferase- NADH, Kinetic UV, method IFCC45 4. Aspartate aminotransferase- NADH, kinetic UV method, IFCC45 5. Total protein – Biuret method45
6. Alkaline phosphatase-p- Nitrophenylphosphate, kinetic method DGKC 45 7. Serum albumin- Bromocresol Green method45
8. Prothrombin time and INR 9. Ultrasonography of abdomen
SERUM CHOLINESTERASE ANALYSIS:
53 PRINCIPLE:
Cholinesterase hydrolyses butyrlthiocholine under release of butyric acid and thiocholine. Thiocholine reduces yellow potassium hexacyanoferrate( III) to colorless potassium hexacyanoferrate(II). The decrease of absorbance is measured at 405nm
Butyrlthiocholine + H2o Thiocholine + butyrate
2 Thiocholine+ 2[ fe( CN)6]3- + H2o choline+ 2[fe(CN)6]4-+ H2o
REAGENTS:
Components and concentration
R1: Pyrophosphate pH 7.6 95mmol/L
Potassium hexacyanoferrate(III) 2.5mmol/L
R2: Butyrlcholine 75mmol/L Fresh and non hemolyzed serum was used for assay
About 20 microlitres of the sample was used with 1ml of the reagent and absorbance was first read at 15 seconds and then at 45 seconds and results were calculated by the formula
Activity in U/L = Absorbance/ 30 seconds * factor
Factor = [ TV* 1000*2] ÷ [ 14.64 * SV*P]
TV – Total reaction volume in ml SV- sample volume in ml
54 14.64 = millimoles absorption
Coefficient of 5 thio- 2 nitro benzoic acid at 405nm
P- Cuvette pathlength in cm
2= conversion from absorbance per second to absorbance per minute
Reference Range at 37 degree Men – [ 4620-11500 U/L]
Women- [ 3930-10800 U/L]
STATISTICAL METHODS USED:
The data was analyzed using SPSS software. Pearson correlation coefficient and P value were calculated to find the correlation and the statistical significance respectively.
P< 0.05 – Significant P> 0.05 – not significant
P < 0.0001 – highly significant
55
OBSERVATIONS
AND
RESULTS
56 OBSERVATIONS AND RESULTS:
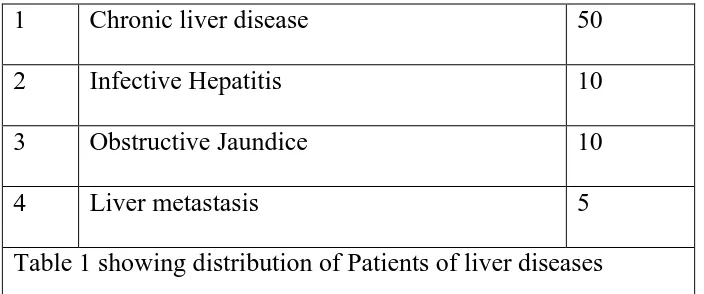
Liver disease patients: Total no.of cases- 75
1 Chronic liver disease 50
2 Infective Hepatitis 10
3 Obstructive Jaundice 10
[image:56.595.107.459.146.293.2]4 Liver metastasis 5
Table 1 showing distribution of Patients of liver diseases
Non liver disease patients – Total No.of cases- 75
1 Acute respiratory infection 17
2 CAD 8
3 Cellulitis 6
4 Chronic kidney disease 5
5 COPD 16
6 Dermatitis 9
7 Anasarca 9
8 Bone disease 5
[image:56.595.204.427.376.623.2]57
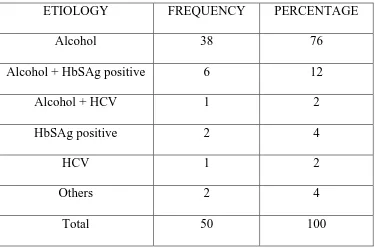
Table 3 : ETIOLOGY OF CHRONIC LIVER DISEASE
ETIOLOGY FREQUENCY PERCENTAGE
Alcohol 38 76
Alcohol + HbSAg positive 6 12
Alcohol + HCV 1 2
HbSAg positive 2 4
HCV 1 2
Others 2 4
Total 50 100
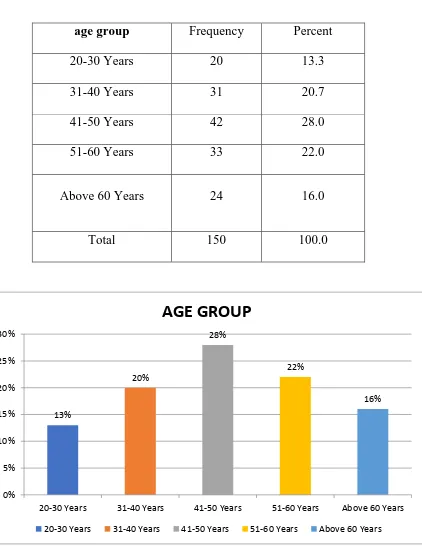
58 Table 4 :
AGE DISTRIBUTION:
age group Frequency Percent
20-30 Years 20 13.3
31-40 Years 31 20.7
41-50 Years 42 28.0
51-60 Years 33 22.0
Above 60 Years 24 16.0
Total 150 100.0
INTERPRETATION:
The above table depicts the percentage of the age group of the patients and
the maximum percentage is in 41-50 years (28%)
13%
20%
28%
22%
16%
0% 5% 10% 15% 20% 25% 30%
20-30 Years 31-40 Years 41-50 Years 51-60 Years Above 60 Years
AGE GROUP
59
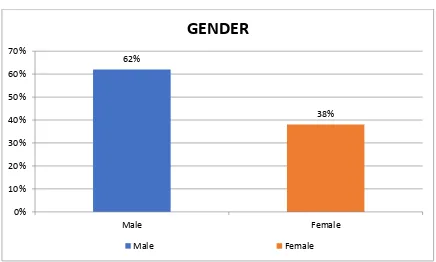
[image:59.595.106.542.333.595.2]Table 5:
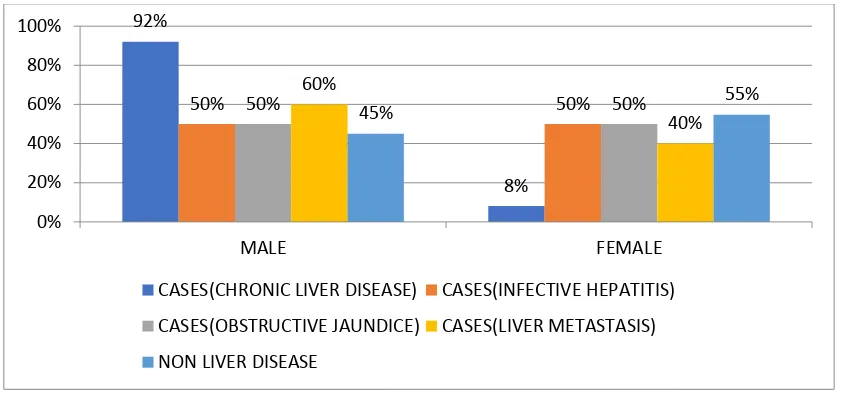
SEX DISTRIBUTION:
Gender Frequency Percent
Male 93 62.0
Female 57 38.0
Total 150 100.0
INTERPRETATION:
The above table depicts the percentage of gender .The maximum percentage is
male(62%).
62%
38%
0% 10% 20% 30% 40% 50% 60% 70%
Male Female
GENDER
60
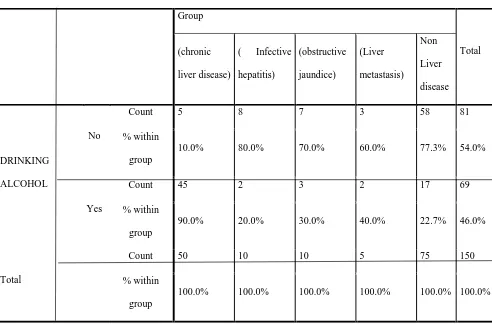
Table 6 : DISTRIBUTION OF ALCOHOLICS
Group
Total (chronic
liver disease)
( Infective hepatitis)
(obstructive jaundice)
(Liver metastasis)
Non Liver disease
DRINKING ALCOHOL
No
Count 5 8 7 3 58 81 % within
group
10.0% 80.0% 70.0% 60.0% 77.3% 54.0%
Yes
Count 45 2 3 2 17 69 % within
group
90.0% 20.0% 30.0% 40.0% 22.7% 46.0% Total
Count 50 10 10 5 75 150 % within
group
61
Table 7: COMPARISON OF MEANS OF LABORATORY PARAMETERS IN BOTH GROUPS
Variables N Mean Std.
Deviation Std. Error Mean
I value p value
Serum cholinesterase U/L Non liver disease
75 6494.21 1269.16 146.55
12.197 p<0.0001
Liver disease patients
75 3816.53 1415.51 163.45
Total bilirubin mgdl_
Non liver disease
75 0.79 0.47 0.05
-6.406 p<0.0001
Liver disease patients
75 7.84 9.51 1.10
Direct bilirubin mg/dl
Non liver disease
75 0.39 0.29 0.03
-6.644 p<0.0001
Liver disease patients
75 4.58 5.45 0.63
Indirect bilirubin mg/dl
Non liver disease
75 0.41 0.27 0.03
-5.359 p<0.0001
Liver disease patients
75 3.18 4.48 0.52
SGPT IU/L
Non liver disease
75 35.40 30.93 3.57
-3.545 p<0.0001
Liver disease patients
75 181.03 354.44 40.93
SGOT IU/L
Non liver disease
75 32.40 19.26 2.22 -4.862 p<0.0001
92%
8%
62
Liver disease patients
75 189.39 278.99 32.21
ALP IU/L
Non liver disease
75 94.96 43.17 4.98
-5.291 p<0.0001
Liver disease patients
75 170.19 115.33 13.32
TOTAL PROTEIN g/dl
Non liver disease
75 6.87 0.66 0.08
6.918 p<0.0001
Liver disease patients
75 6.15 0.61 0.07
Serum albumin g/dl
Non liver disease
75 3.78 0.49 0.06
9.575 p<0.0001
Liver disease patients
75 2.99 0.52 0.06
63 CHOLINESTERASE U/L NO.OF LIVER DISEASE PATIENTS
NO. OF NON LIVER DISEASE PATIENTS TOTAL < 4500 >4500 50 25 2 73 52 98
TOTAL 75 75 50
Above table shows that cholinesterase level decrease in 66.7% patient of Liver disease patients, and only 2.7% of non liver disease patients
SENSITIVITY TO DIAGNOSE LIVER DISEASE – 88.9%
SPECIFICITY TO DIAGNOSE LIVER DISEASE – 97.33%
3492.64 4488.5 4595.4 4153.8 6494.21 0 1000 2000 3000 4000 5000 6000 7000
Sr cholinesterase
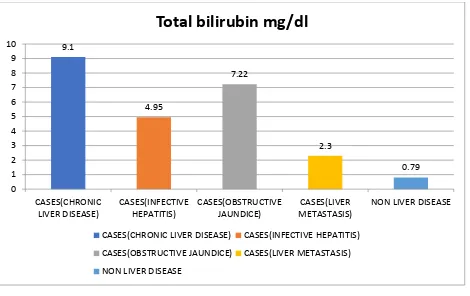
64 Table 8: TOTAL BILIRUBIN mg/dl NO.OF LIVER DISEASE PATIENTS NO.OF NON LIVER DISEASE PATIENTS TOTAL >1.1 <1.1 70 5 20 55 90 60
TOTAL 75 75 150
Above table shows that Total bilirubin raised in 93.3% of liver disease patients, and in 26.7% of non liver disease patients.
SENSITIVITY TO DIAGNOSE LIVER PATIENTS – 93.33%
SPECIFICITY TO DIAGNOSE LIVER PATIETNS – 73.33%
9.1 4.95 7.22 2.3 0.79 0 1 2 3 4 5 6 7 8 9 10 CASES(CHRONIC LIVER DISEASE) CASES(INFECTIVE HEPATITIS) CASES(OBSTRUCTIVE JAUNDICE) CASES(LIVER METASTASIS)
NON LIVER DISEASE
Total bilirubin mg/dl
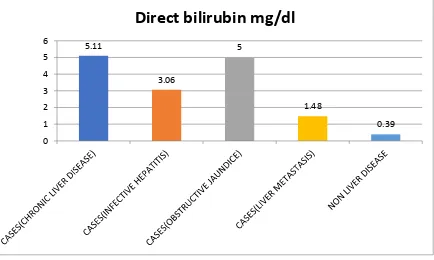
[image:65.595.77.547.70.366.2]65 Table 9 DIRECT BILIRUBIN mg/dl NO.OF LIVER DISEASE PATIENTS
NO.OF NON LIVER DISEASE PATIENTS TOTAL >0.3 <0.3 73 2 37 38 110 40
TOTAL 75 75 150
Above table shows that Direct Bilirubin raised in 97.3% cases of liver disease, but it is also raised in 49.3% non-liver disease patients.
SENSITIVITY TO DIAGNOSE LIVER DISEASE PATIENTS- 97.3%
SPECIFICITY TO DIAGNOSE LIVER DISEASE PATIENTS – 50.7%
5.11 3.06 5 1.48 0.39 0 1 2 3 4 5 6
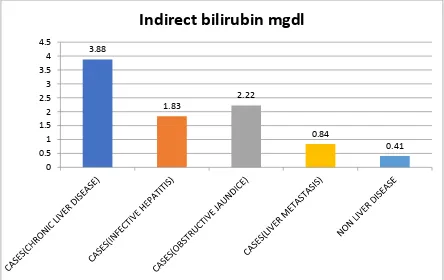
66 Table 10 INDIRECT BILIRUBIN mg/dl NO.OF LIVER DISEASE PATIENTS
NO. OF NON LIVER DISEASE PATIENTS TOTAL >0.8 <0.8 49 26 5 70 54 96
TOTAL 75 75 150
Above table shows the indirect bilirubin is raised in 65.3% of liver disease patient and also 6.7% in non liver disease patients.
SENSITIVITY TO DIAGNOSE LIVER DISEASE – 65.3% SPECIFICITY TO DIAGNOSE LIVER DISEASE – 93.3%
3.88 1.83 2.22 0.84 0.41 0 0.5 1 1.5 2 2.5 3 3.5 4 4.5
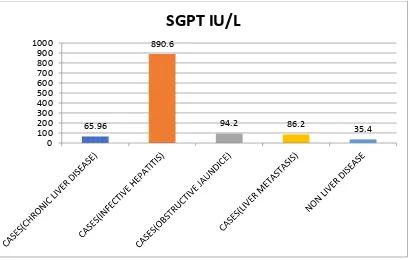
67 Table 11
SGPT IU/L NO.OF LIVER DISEASE PATIENTS NO.OF NON LIVER DISEASE PATIENTS TOTAL >40 <40 45 30 13 62 58 92
TOTAL 75 75 150
Above table shows that SGPT is raised in 60% of liver disease and 17.3% of non liver disease patients.
SENSITIVITY TO DIAGNOSE LIVER PATIENTS: 60%
SPECIFICITY TO DIAGNOSE LIVER PATIENTS: 82.7%
65.96
890.6
68 Table 12
SGOT U/L NO.OF LIVER
DISEASE PATIENTS NO.OF NON LIVER DISEASE PATIENTS TOTAL >38 <38 65 10 21 54 86 64
TOTAL 75 75 150
Above table shows that SGOT is raised in 86.7% of patients with liver disease and 13.3% of patient with non liver disease
SENSITIVITY TO DIAGNOSE LIVER DISEASE: 86.7%
SPECIFICITY TO DIAGNOSE LIVER DISEASE: 72.0%
69 Table 13
ALP IU/L NO.OF LIVER
DISEASE PATIENTS NO.OF NON LIVER DISEASE PATIENTS TOTAL >130 <130 40 35 11 64 51 99
TOTAL 75 75 150
Above table shows that ALP is raised in 53,33% patient of liver disease and in 14.7% patients of non liver disease patients
SENSITIVITY TO DIAGNOSE LIVER DISEASE – 53.33%
SPECIFICITY TO DIAGNOSE LIVER DISEASE – 85.33%
70 Table 14 TOTAL PROTEIN g/dl NO.OF LIVER DISEASE PATIENTS
NO. OF NON LIVER DISEASE PATIENTS TOTAL <6.5 >6.5 57 18 9 66 66 84
TOTAL 75 75 150
Above table shows that Total protein is decreased in 76% of patients with Liver disease and 13.63% of patients with non liver diseases
SENSITIVITY TO DIAGNOSE LIVER DISEASE – 76%
SPECIFICITY TO DIAGNOSE LIVER DISEASE – 88%
6.11 6.22 6.21 6.24
6.87 5.6 5.8 6 6.2 6.4 6.6 6.8 7
71 Table 15
SERUM ALBUMIN g/dl
NO. OF LIVER DISEASE PATIENTS
NO. OF NON LIVER DISEASE PATIENTS TOTAL <3.5 >3.5 63 12 16 59 79 71
TOTAL 75 75 150
Above table shows that Serum albumin is decreased in 84% of liver disease patients and 21.33% of patients with non liver disease patients
SENSITIVITY TO DIAGNOSE LIVER DISEASE PATIENT- 84%
SPECIFICITY TO DIAGNOSE LIVER DISEASE PATIENT – 78.7%
2.89 3.27 3.18 3.08
3.78 0 0.5 1 1.5 2 2.5 3 3.5 4
72
Table 16: COMPARISON OF MEANS OF LABORATORY
PARAMETERS IN CHRONIC LIVER DISEASE GROUP: (Patients are grouped according to CTP scoring system)
N Mean
Std. Deviat ion
Std. Error
95% Confidence Interval for Mean
Minimu m Maximu m Lower Bound Upper
Bound f value p value
Sr
cholinesterase UL
A 10 5490.
60 628.6 8 198.8 1 5040.8 7 5940.3 3 4823.0
0 6780.00
105.936 0.000
B 16 4111.
56 587.8 2 146.9 5 3798.3 4 4424.7 9 3367.0
0 5797.00
C 24 2247.
54 650.3 6 132.7 5 1972.9 2 2522.1 7 1342.0
0 3394.00
Tot
al 50
3492. 64 1440. 82 203.7 6 3083.1 6 3902.1 2 1342.0
0 6780.00
Total bilirubin mg/dl
A 10 1.74 0.57 0.18 1.34 2.14 .90 2.30
11.068** p<00.001
B 16 3.91 4.10 1.03 1.73 6.10 .60 12.00
C 24 15.62 13.14 2.68 10.07 21.17 1.20 38.80
Tot
al 50 9.10 11.27 1.59 5.89 12.30 .60 38.80
Direct bilirubin mg/dl
A 10 1.15 0.46 0.14 0.82 1.48 .40 1.60
12.304** p<00.001
B 16 1.78 1.92 0.48 0.75 2.80 .10 7.00
C 24 8.98 7.42 1.51 5.84 12.11 .50 23.70
Tot
al 50 5.11 6.42 0.91 3.28 6.93 .10 23.70
Indirect bilirubin mg/dl
A 10 0.59 0.17 0.05 0.47 0.71 .30 .80
8.222** p<00.001
B 16 1.80 2.17 0.54 0.65 2.95 .20 7.30
C 24 6.64 6.46 1.32 3.91 9.37 .60 19.40
Tot
al 50 3.88 5.33 0.75 2.37 5.40 .20 19.40
SGPT IU/L
A 10 48.80 47.87 15.14 14.55 83.05 17.00 146.00
.473 .626
B 16 67.19 69.79 17.45 30.00 104.37 13.00 250.00
C 24 72.29 66.51 13.58 44.21 100.37 20.00 250.00
Tot
al 50 65.96 63.78 9.02 47.83 84.09 13.00 250.00
SGOT IU/L
A 10 77.00 43.66 13.81 45.77 108.23 27.00 172.00
.746 .480
B 16 116.0
6 66.43 16.61 80.67 151.46 32.00 261.00
C 24 116.1
7
114.7
0 23.41 67.73 164.60 10.00 496.00
Tot
al 50
108.3
0 90.15 12.75 82.68 133.92 10.00 496.00
ALP IU/L
A 10 101.0
0 34.41 10.88 76.39 125.61 62.00 164.00
1.121 0.335
B 16 132.5
0 43.94 10.98 109.09 155.91 79.00 256.00
C 24 119.9
2 62.01 12.66 93.73 146.10 36.00 309.00
Tot
al 50
120.1
6 52.33 7.40 105.29 135.03 36.00 309.00
[image:73.595.87.572.171.765.2]73
TOTAL PROTEIN g/dl
B 16 6.21 0.59 0.15 5.90 6.53 5.10 7.30
C 24 5.89 0.75 0.15 5.57 6.21 4.00 7.10
Tot
al 50 6.11 0.68 0.10 5.92 6.31 4.00 7.30
Sr albumin g/dl
A 10 3.62 0.32 0.10 3.39 3.85 3.30 4.30
38.750** p<00.001
B 16 3.09 0.40 0.10 2.87 3.30 2.20 3.70
C 24 2.46 0.36 0.07 2.31 2.61 1.70 3.00
Tot
al 50 2.89 0.58 0.08 2.73 3.06 1.70 4.30
74
MULTIPLE COMPARISONS
Bonferroni Dependent Variable (I) CTPscore (J) CTPscore Mean Difference (I-J)
Std. Error Sig. 95% Confidence Interval
Lower Bound Upper Bound Sr cholinesterase U/L
A B 1379.03750
* 252.69237 .000 751.6795 2006.3955
C 3243.05833* 235.93876 .000 2657.2945 3828.8222
B A
-1379.03750* 252.69237 .000
-2006.3955 -751.6795
C 1864.02083* 202.31582 .000 1361.7325 2366.3092
C
A
-3243.05833* 235.93876 .000
-3828.8222 -2657.2945
B
-1864.02083* 202.31582 .000
-2366.3092 -1361.7325
Total bilirubin mg/dl
A B -2.17250 3.82360 1.000 -11.6653 7.3203
C -13.87667* 3.57010 .001 -22.7401 -5.0132
B A 2.17250 3.82360 1.000 -7.3203 11.6653
C -11.70417* 3.06133 .001 -19.3045 -4.1038
C A 13.87667
* 3.57010 .001 5.0132 22.7401
B 11.70417* 3.06133 .001 4.1038 19.3045
Direct bilirubin mg/dl
A B -.62500 2.13966 1.000 -5.9371 4.6871
C -7.82500* 1.99780 .001 -12.7849 -2.8651
B A .62500 2.13966 1.000 -4.6871 5.9371
C -7.20000* 1.71310 .000 -11.4531 -2.9469
C A 7.82500
* 1.99780 .001 2.8651 12.7849
B 7.20000* 1.71310 .000 2.9469 11.4531
Indirect bilirubin mg/dl
A B -1.21000 1.88746 1.000 -5.8960 3.4760
C -6.05167* 1.76232 .004 -10.4270 -1.6764
B A 1.21000 1.88746 1.000 -3.4760 5.8960
C -4.84167* 1.51118 .007 -8.5935 -1.0899
C A 6.05167
* 1.76232 .004 1.6764 10.4270
B 4.84167* 1.51118 .007 1.0899 8.5935
TOTAL PROTEIN g/dl
A B .27750 .26181 .884 -.3725 .9275
C .59833 .24445 .055 -.0086 1.2052
B A -.27750 .26181 .884 -.9275 .3725
C .32083 .20961 .398 -.1996 .8412
C A -.59833 .24445 .055 -1.2052 .0086
B -.32083 .20961 .398 -.8412 .1996
Sr albumin g/dl
A B .53250
* .14723 .002 .1670 .8980
C 1.15750* .13747 .000 .8162 1.4988
B A -.53250
* .14723 .002 -.8980 -.1670
C .62500* .11788 .000 .3323 .9177
C A -1.15750
* .13747 .000 -1.4988 -.8162
B -.62500* .11788 .000 -.9177 -.3323
75 Interpretation:
The above table depicts the CTP group’s percentage .The group C has maximum (48%) percentage comparing to group A,B .
26%
32%
48%
0% 10% 20% 30% 40% 50% 60%
A B C
CTP SCORE
76
CORRELATION BETWEEN SERUM CHOLINESTERASE AND PARAMETERS OF LFT:
CASES(CHRONIC LIVER DISEASE)
Serum cholinesterase U/L
N Minimum Maximum Mean
Standard
Deviation r
Direct bilirubin mg/dl
>0.3 48 1342.00 6780.00 3467.10 1462.94
-.473**
<0.3 2 3687.00 4524.00 4105.50 591.85
Indirect bilirubin
mg/dl
>0.8 29 1342.00 5797.00 2810.90 1064.74
-.396**
<0.8 21 1377.00 6780.00 4434.10
1376.
38
SGPT IU/L
>40 21 1342.00 5797.00 3283.38 1284.48
-.156
<40 29 1377.00 6780.00 3644.17 1548.49
SGOT IU/L
>38 40 1342.00 6780.00 3563.75 1495.61
-.129
<38 10 1450.00 5387.00 3208.20 1223.55
ALP IU/L <130 30 6780.00 1377.00 3501.00 1617.00 0,04
>130 20 5797.00 1342.00 3472.15 1166.23
Serum albumin g/dl
>3.5 5 3510.00 6780.00 5279.80 1232.84
.704**
3.0-3.5 20 1617.00 6124.00 4252.30 1107.62
<3.0 25 1342.00 4588.00 2527.48 947.22
Total bilirubin mg/dl
>1.1 45 1342.00 6124.00 3306.24 1354.62
-.452**
<1.1 5 3687.00 6780.00 5170.20 1156.24
**P<0.001
Serum cholinesterase showed moderate negative correlation with serum bilirubin
Strong positive Correlation with albumin at p value <0.001
Correlation with Total bilirubin, Direct bilirubin, Indirect bilirubin is negative at p value
<0.001
77
Scatter diagram showing strong Positive correlation between serum cholinesterase and
serum albumin in chronic liver disease group.
Scatter diagram showing moderate negative correlation between serum cholinesterase
78
CORRELATION OF SERUM CHOLINESTERASE AND PARAMETERS OF
LFT IN INFECTIOUS HEPATITIS GROUP:
Cases ( Infective hepatitis)
Serum cholinesterase UL
N Minimum Maximum Mean
Standard
Deviation
Direct bilirubin mg/dl >0.3 10 3100.00 6454.00 4488.50 1092.14 -.840**
<0.3 0
Indirect bilirubin mg/dl >0.8 9 3100.00 6454.00 4381.33 1101.20 -.920**
<0.8 1 5453.00 5453.00 5453.00
SGPT IU/L >40 10 3100.00 6454.00 4488.50 1092.14 .587
<40 0
SGOT IU/L >38 10 3100.00 6454.00 4488.50 1092.14 .667*
<38 0
ALP IU/L <130 0 0.648
>130 10 6454.00 3100.00 4488.50 1092.14
Serum albumin g/dl >3.5 1 5600.00 5600.00 5600.00 .680*
3.0-3.5 9 3100.00 6454.00 4365.00 1081.79
<3.0 0
Total bilirubin mg/dl >1.1 10 3100.00 6454.00 4488.50 1092.14 -.928**
<1.1 0
**p<0.001 *p<0.05
Serum cholinesterase has moderate to strong positive correlation with serum albumin and SGOT at p value <0.05
Serum cholinesterase has strong negative correlation with Total bilirubin, Direct bilirubin, Indirect bilirubin at p value <0.001
correlation with SGPT and ALP are statistically not significant
79 Scatter diagram
showing Positive correlation between serum albumin and serum
cholinesterase in Infective hepatitis
group
80
CORRELATION OF SERUM CHOLINESTRASE WITH PARAMETERS OF LFT IN OBSTRUCTIVE JAUNDICE GROUP:
Cases ( obstructive jaundice)
Serum cholinesterase U/L
N Minimum Maximum Mean
Standard
Deviation
Direct bilirubin
mg/dl
>0.3 10 2879.00 6232.00 4595.40 1241.04
-.820**
<0.3 0
Indirect bilirubin
mg/dl
>0.8 10 2879.00 6232.00 4595.40 1241.04
-.550
<0.8 0
SGPT IU/L
>40 10 2879.00 6232.00 4595.40 1241.04
.194
<40 0
SGOT IU/L
>38 10 2879.00 6232.00 4595.40 1241.04
-.130
<38 0
ALP IU/L <130 0 -0.408
>130 10 6232.00 2879.00 4595.00 1241.04
Serum albumin g/dl
>3.5 0
.963**
3.0-3.5 8 3620.00 6232.00 4983.00 1055.41
<3.0 2 2879.00 3211.00 3045.00 234.76
Total bilirubin mg/dl
>1.1 10 2879.00 6232.00 4595.40 1241.04
-.850**
<1.1 0
**p<0.001
Serum cholinesterase has strong positive correlation with serum albumin at p
value <0.001 Serum cholinesterase has strong negative correlation with Total and
Direct bilirubin at p value <0.001. Correlation with other variables are statistically not
81
CORRELATION OF SERUM CHOLINESTERASE WITH PARAMETERS OF
LFT IN LIVER METASTASIS:
Cases(Liver metastasis) Serum cholinesterase U/L
N Minimum Maximum Mean
Standard Deviation Directbilirubin
mg/dl
>0.3 5 2324.00 5349.00 4153.80 1178.73 -.762
<0.3 0
Indirect bilirubin mg/dl
>0.8 1 2324.00 2324.00 2324.00 -.869
<0.8 4 3732.00 5349.00 4611.25 676.35
SGPT IU/L >40 4 2324.00 4832.00 3855.00 1121.30 -.708
<40 1 5349.00 5349.00 5349.00
SGOT IU/L >38 5 2324.00 5349.00 4153.80 1178.73 -.861
<38 0
ALP IU/L <130 5 5349.00 2324.00 4153.00 1178.73 -0.31
>130 0
Serum albumin g/dl >3.5 0 .994**
3.0-3.5
3 4532.00 5349.00 4904.33 413.28
<3.0 2 2324.00 3732.00 3028.00 995.61
Total bilirubin mg/dl >1.1 4 2324.00 5349.00 3984.25 1288.75 -.821
<1.1 1 4832.00 4832.00 4832.00
**p value<0.001
Serum cholinesterase has strong positive correlation with serum albumin at p
82
CORRELATION OF SERUM CHOLINESTERASE WITH SEVERITY OF
CHRONIC LIVER DISEASE ACCORDING TO CHILD TURCOTTE PUGH
SCORING:
+
Serum cholinesterase U/L
Count Minimum Maximum Mean
Standard Deviation
r VALUE
CTP SCORE
A 10 4823.00 6780.00 5490.60 628.68
-0.857** B 16 3367.00 5797.00 4111.56 587.82
C 24 1342.00 3394.00 2247.54 650.36
**p value<0.001
Serum cholinesterase has strong negative correlation with CTP score and it is
statistically significant. (i.e severity of chronic liver disease increase with decrease in
serum cholinesterase.
Mean Serum cholinesterase CTP score
5490.60±628.68 A
4111.56±587.82 B
83
84 DISSCUSSION:
Our study was conducted to estimate the level of serum cholinesterase and other liver function test( i.e serum albumin, Total protein, SGPT, SGOT, ALP, Total bilirubin, Indirect bilirubin, Direct bilirubin) to 150 cases ( fulfilling the inclusion and exclusion criteria) admitted during period of August 2017 to January 2018.
The patients were divided into two groups:
a. GROUP I – Liver disease patients b. GROUP II- Non liver disease patients
Analysis was done to study the comparison of serum cholinesterase and other liver function tests between Hepatic and non-hepatic cases.
Analysis was also done to study the correlation between levels of serum cholinesterase and levels of serum albumin, serum bilirubin, and severity of cirrhosis of liver ( CTP scoring system) using pearson’s correlation coefficient
Following Observations were made from our study:
i. AGE DISTRIBUTION:
Out of 150 patient, majority were in the 41-50 years age group (28%)
ii. SEX DISTRIBUTION:
85
COMPARISON OF MEANS OF LABORATORY PARAMETRS IN BOTH GROUPS:
In the study, the level of serum cholinesterase was significantly lower in liver disease patients comparing non-liver patients. Mean of non - liver patients being 6494.21± 1269.16U/L and mean of liver disease patients being 3816.53± 1414.51 U/L, which is highly significant, p value<0.001. Similarly, Total bilirubin, direct bilirubin, Indirect bilirubin, SGPT and SGOT, ALP was significantly higher in liver disease when comparing to non-liver disease patient.
Cholinesterase levels decrease in 66.7% of liver disease patients and in only 2.7% of non-liver disease patients. Total protein levels were lowered in both groups of patients,76% in liver disease patients while in non-liver disease patients it was 88%.
Serum albumin was not only low in liver disease patients (84%), but also in non-liver disease patients (21.33%). Sensitivity – 84%, specificity – 78.7%, at 3.5g/dl.
In our study, it is clearly showed that assay of cholinesterase level has sensitivity of 89.9% and specificity of 97.33%, at 4500 U/L
SERUM CHOLINESTERASE IN VARIOUS CHILD PUGH SCORE GROUPS
In chronic liver disease group, patient is classified according to CTP scoring system. The result shows that cholinesterase tends to decrease in three grades Mean Serum cholinesterase CTP score 5490.60±628.68 A
86
2247.54±650.36 C
The result is in agree with findings of Gu and Zhong 39. Their data
demonstrated that cholinesterase in the three grades were :
(Child A – 5978 ± 535 u/l)
(Child B – 3957 ± 454 U/l)
(Child C – 2267 ± 332 u/l)
and also agrees with FANPING MENG,XIAOJUAN YIN48,where their sample size is
866 cirrhotic patients and the results are
(child A- 5368±1657.32 U/L)
(child B-2943.06±1212.84U/L)
(child C-1832.51±710.68 U/L)
The child pugh score employs five clinical measures of liver disease, among which
ascites and hepatic encephalopathy are subjective measures. Compared with the Child
Pugh score, cholinesterase is easier and more objective in evaluating the liver reserve
function of cirrhotic patients.
In our study in cirrhotic patients, cholinesterase was positively correlated with
albumin and negatively correlated with total bilirubin, confirming that those substances
were synthesized in the liver and reduced in liver dysfunction due to reduced synthesis.
r value(pearson coefficient) for correlation between serum choilnesterase and serum
albumin is 0.702, r value(pearson coefficient) for correlation between serum
cholinesterase and CTP scoring system is - 0.857 . This shows that serum cholinesterase
87
with albumin is positive. Correlation with CTP score system is negative. i.e serum
cholinesterase decreases with increasing severity of chronic liver disease.
In their study Gu and Zhong, demonstrated that three cirrhotic patients (two child B
and one child A score patient) suffered hepatic encephalopathy following portal
azygous disconnection operation, with cholinesterase levels of <2,000 u/l. Thus, author
suggested that cirrhotic patients with cholinesterase of <2,000 u/l may have higher risk
of failure.
Data from study conducted by khan40 pointed that 100% patients with cirrhosis
had lower serum cholinesterase level and he also showed that there was close relationship between the severity of cirrhosis and level of serum cholinesterase .
William burnett found serum cholinesterase is useful both as a liver function test and in diagnosis of jaundice.
Ramachandran et al found median serum ChE in chronic liver disease patients was 1590 IU/L (110-8143) compared to non-liver disease patients 7886IU/L (2022-21673), p<0.001. Serum ChE levels below 3506 had a 98.7% sensitivity and 80.3% specificity in predicting cirrhosis found serum ChE is an excellent biom arker of cirrhosis with good sensitivity and specificity42
The finding of present study correlate well with finding of previous studies of . Ruchi Gokani et al46 (2014), Vihan C et al47 (2014), S Venkata Rao et
88 INFECTIVE HEPATITIS GROUP:
Serum cholinesterase has moderate to strong positive correlation with serum albumin and SGOT at p value <0.05. Serum cholinesterase has strong negative correlation with Total bilirubin, Direct bilirubin, Indirect bilirubin at p value <0.001. Correlation with SGPT and ALP are statistically not significant. SGPT and SGOT are raised significantly when comparing to other groups (i.e. Chronic
liver disease ,obstructive jaundice and liver metastasis)
OBSTRUCTIVE JAUNDICE:
Serum cholinesterase has strong positive correlation with serum albumin at p
value <0.001Serum cholinesterase has strong negative correlation with Total and Direct
bilirubin at p value <0.001. Correlation with other variables are statistically not
significant. ALP is raised significantly when comparing to other groups (Chronic liver
disease, infective hepatitis and liver metastasis)
LIVER METASTASIS:
89
90 CONCLUSION:
From our study, the following results were concluded:
The most commonly observed etiology for chronic liver diseases is alcohol.
In our study, serum cholinesterase were decreased in liver disease patients (mean value of chronic liver disease – 3492.64±1440.82 U/L, Infective hepatitis – 4488.5±1092.14 U/L, Obstructive jaundice – 4595.4 ± 1241.04 U/L, Liver metastasis- 4153.8 ± 1178.73 U/L, Non liver disease patients – 6494.21 ± 1269.16 U/L).
Serum cholinesterase below 4500u/l has good specificity comparing to serum albumin in diagnosing liver disease patients.
There was significant positive correlation between serum albumin and serum cholinesterase level in all cases of liver disease patients.
There was significant negative correlation between serum bilirubin and serum cholinesterase level in all liver disease patients except liver metastasis in our study.
Significant correlation was found between serum cholinesterase and CTP scoring in chronic liver disease patients. Levels were lower among patients in CHILD PUGH class C.
91
LIMITATIONS
1. It is a single centered study. We need multicentric study involving patients of different geographical areas to have a better analysis.
2. Sample sizes of sub-groups of liver disease patients (CLD(n50), infective hepatitis(n10), obstructive jaundice(n10) and liver metastasis(n5)) were small
3. congenitally cholinesterase deficient community people (e.g. arya vysya chettiar in southern India) were not included in exclusion criteria.
4. Liver biopsy/el