IJEDR1601015
International Journal of Engineering Development and Research (www.ijedr.org)89
Optimization of Machining Parameters during CNC
turning of Aluminium 6061 with CNMG EN-TM
(H20TI) insert using Response Surface Methodology
(RSM)
Jasvir Singh1, Harvinder Singh2, Gagandeep Singh Dhindsa3 1,3 Asst. Prof. CEC Landran
2Asst. Professor, UCOE, Punjabi University, Patiala
________________________________________________________________________________________________________
Abstract - During this work, the effects of various machining parameters such as feed rate,cutting speed, and depth of cut on surface roughness were experimentally observed during dry turning process. Aluminium 6061 alloy is machined using CNMG 120408 EN-TM (H20TI) CNC turning inserts. Response Surface Methodology (RSM) is used to design the experiment, to get regression equation and for optimization of the input parameters. Surface plots and Contour plots were generated by using RSM to check the interaction of input parameters on the surface roughness of the component. From the analysis of the experimental result it found that feed rate has maximum effect on surface roughness and cutting speed and depth of cut has minimum effect on surface roughness. The range of machining parameters are 0.1-0.2 mm/rev,124-207 m/min, and 0.05-0.8 mm for feed rate, cutting speed and depth of cut respectively. Best values of parameters are0.1 mm/rev, 165.5m/min and 0.85mm for feed rate,cutting speed and depth of cut respectively.
Keywords - Dry turning, Response Surface Methodology (RSM), ANOVA, Al 6061.
________________________________________________________________________________________________________
I.INTRODUCTION
Now a days , in manufacturing industry alloys are preferred over the pure metals. This is because of better properties of the alloys such as good machining properties, high strength to weight ratio, better thermal and mechanical properties, good toughness, good machining properties etc. From them aluminium 6061 alloy is one. It is mostly used in the aerospace industry, cycle industry, valves, couplings and marine fittings. For the manufacturing of cylindrically symmetrical products turning process is used.
In the modern manufacturing industry surface finish of the product is most important with high material removal rate (MRR). To get high surface finish various processes are done on the product such as grinding, buffing and polishing. But these process are very costly and time consuming. To reduce the manufacturing time and cost we are trying to get maximum surface finish by only turning process.Because turning is the first most machining operation to get finished surface. Automated and flexible manufacturing system is used in the industries.CNC machines are used because they are capable of achieving repeatability and high accuracy. There are many factors that affect the surface roughness of the product for example cutting speed, feed rate, depth of cut, coolant used, tool geometry, chattering, material properties of work piece and cutting tool used.
IJEDR1601015
International Journal of Engineering Development and Research (www.ijedr.org)90
range. CVD coated carbide tool have lower tool wear than PVD coated carbide tools [7].Makadia A. J. et al (2013) experimented on AlSl 410 steel with the ceramics tool inserts by performing turning operation. ANOVA and RSM technique was used as the parameter optimizing technique and for mathematical modeling. They found that feed rate is significant factor influencing surface roughness. Cutting speed, feed rate and depth of cut and nose radius should be 255.5rpm, 0.1mm/rev, 0.3mm and 1.2mm respectively for optimum result [8].Das S. R. et al (2013) performed the turning of AlSl4340 steel with CVD multilayer coated carbide tool inserts. Factorial design and ANOVA was used as the optimizing technique. They found that feed rate is significant factor influencing surface roughness. Cutting speed was set at 150m/min, feed rate 0.05mm/rev to get optimum result [9].Lin C. L. et al (2013) did the turning of AlSl4340 steel by taking CVD multilayer coated carbide tool. Grey relation and ANOVA were used as the optimizing techniques. They investigated that the feed rate is the most significant cutting factor for affecting multilayer performance characteristics [10].Das B. et al (2013) performed the turning operation on Al-5Cu alloy by using high speed steel tool. By the experiments they got a result that roughness increases with increase in feed tare. After reaching certain value it starts decreasing [11].Sahoo A. K. et al (2013) performed the turning operation on Al/SiCp reinforced metal by using multilayer tin coated carbide inserts. They used Taguchi method, Regression Analysis and Grey Relation for the mathematical modeling and parameter optimization. They investigated that feed rate is found to be the most significant parameter for surface roughness. Cutting speed of (180m/min), feed rate of (0.05mm/rev) and depth of cut at (0.4mm) are optimal parameters [12]. II.DESIGNOFEXPERIMENTFirst step in the research is to design the experiment. Taguchi orthogonal array and Response Surface Methodology (RSM) is commonly used to design the experiment. We design the experiments using CCD method of Response Surface Methodology (RSM) in the coded form using minitab16.1 software.RSM is a combination of mathematical and statistical technique. It gives mathematical relation between input parameters and output parameters. It saves time and efforts by reducing the number of experiments. If we are taking k no. of factors than no. of experiments designed by RSM is equal to 2k+2k+6. For example we are considering 3 factors than RSM design 20 experiment as 23+2*3+6=20.It automatically divides the range of every factor into five levels. Table 1shows the input variables and their levels.
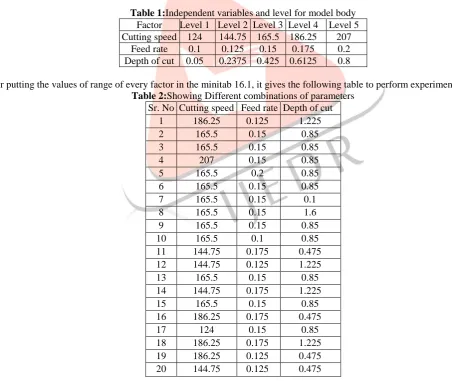
Table 1:Independent variables and level for model body Factor Level 1 Level 2 Level 3 Level 4 Level 5 Cutting speed 124 144.75 165.5 186.25 207
Feed rate 0.1 0.125 0.15 0.175 0.2 Depth of cut 0.05 0.2375 0.425 0.6125 0.8
After putting the values of range of every factor in the minitab 16.1, it gives the following table to perform experiment. Table 2:Showing Different combinations of parameters
Sr. No Cutting speed Feed rate Depth of cut
1 186.25 0.125 1.225
2 165.5 0.15 0.85
3 165.5 0.15 0.85
4 207 0.15 0.85
5 165.5 0.2 0.85
6 165.5 0.15 0.85
7 165.5 0.15 0.1
8 165.5 0.15 1.6
9 165.5 0.15 0.85
10 165.5 0.1 0.85
11 144.75 0.175 0.475
12 144.75 0.125 1.225
13 165.5 0.15 0.85
14 144.75 0.175 1.225
15 165.5 0.15 0.85
16 186.25 0.175 0.475
17 124 0.15 0.85
18 186.25 0.175 1.225
19 186.25 0.125 0.475
20 144.75 0.125 0.475
III.EXPERIMENTALWORK
IJEDR1601015
International Journal of Engineering Development and Research (www.ijedr.org)91
Figure 1: CNC turning machineFigure 2: Lens supporting tool
IV.RESULTANDDISCUSSION
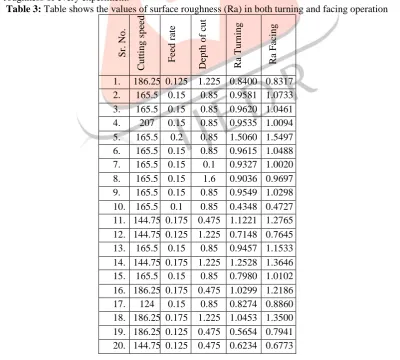
After the experimentation surface roughness is checked of both the turned and faced surface on the Taylor/Hobson contact type profilometer having the stylus radius of 2μm. Average surface roughness (Ra) is taken for the analysis. Table 3 showing the result of surface roughness of every experiment.
Table 3: Table shows the values of surface roughness (Ra) in both turning and facing operation
Sr.
No
.
C
u
ttin
g
s
p
ee
d
Feed
r
ate
Dep
th
o
f
cu
t
R
a
T
u
rn
in
g
R
a
Facin
g
IJEDR1601015
International Journal of Engineering Development and Research (www.ijedr.org)92
To understand the effect of input parameters on the surface finish experimental results are used to develop the empirical relation using Response Surface Methodology (RSM). Analysis of results gives us regression equations for both turning and facing operation. These equations correlate the response variables with the input parameters. In these equations linear, square and interaction of the input variables are counted. These equations are quadratic in nature.Ra turning process (μm) =
0.930902 − 0.00419565 ∗ 𝑠 + 0.256870 ∗ 𝑓 + 0.0339141 ∗ 𝑑 − 0.0196706 ∗ 𝑠2+ 0.00859599 ∗ 𝑓2− 0.00987718 ∗ 𝑑2
− 0.0458625 ∗ 𝑠 ∗ 𝑓 + 0.00848750 ∗ 𝑠 ∗ 𝑑 − 0.0274 ∗ 𝑓 ∗ 𝑑 Ra facing process (μm) =
1.05838 + 0.0234339 ∗ 𝑠 + 0.289407 ∗ 𝑓 + 0.0213064 ∗ 𝑑 − 0.0275581 ∗ 𝑠² − 0.00510744 ∗ 𝑓² − 0.0140700 ∗ 𝑑² − 0.0321875 ∗ 𝑠 ∗ 𝑓 − 0.000662500 ∗ 𝑠 ∗ 𝑑 + 0.0117125 ∗ 𝑓 ∗ 𝑑
Analysis of Variance (ANOVA) is used to study the effect of the input parameters on the response variable. Which shows the effect of individual parameters, their squares and their interactions on the response variable. The ANOVA table is given bellow for both turning and facing operations.
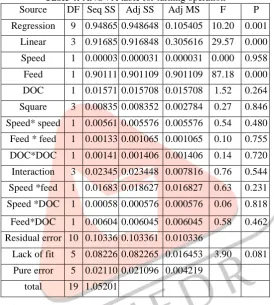
Table 4: ANOVA table for turning operation
Source DF Seq SS Adj SS Adj MS F P Regression 9 0.94865 0.948648 0.105405 10.20 0.001
Linear 3 0.91685 0.916848 0.305616 29.57 0.000 Speed 1 0.00003 0.000031 0.000031 0.000 0.958 Feed 1 0.90111 0.901109 0.901109 87.18 0.000 DOC 1 0.01571 0.015708 0.015708 1.52 0.264 Square 3 0.00835 0.008352 0.002784 0.27 0.846 Speed* speed 1 0.00561 0.005576 0.005576 0.54 0.480 Feed * feed 1 0.00133 0.001065 0.001065 0.10 0.755 DOC*DOC 1 0.00141 0.001406 0.001406 0.14 0.720 Interaction 3 0.02345 0.023448 0.007816 0.76 0.544 Speed *feed 1 0.01683 0.018627 0.016827 0.63 0.231 Speed *DOC 1 0.00058 0.000576 0.000576 0.06 0.818 Feed*DOC 1 0.00604 0.006045 0.006045 0.58 0.462 Residual error 10 0.10336 0.103361 0.010336
Lack of fit 5 0.08226 0.082265 0.016453 3.90 0.081 Pure error 5 0.02110 0.021096 0.004219
total 19 1.05201
This ANOVA table shows the effect of input parameters on the surface roughness at the surface generated by turning operation. The effect on response variable of individual parameters and their interactions is inversely proportional to the p value corresponding to it. Lower the p value higher the effect on the surface roughness and vise versa. In this table minimum p value is 0 which is corresponding to the feed rate, it means feed rate shows maximum effect on the surface finish. Maximum value of p is corresponding to the cutting speed it means speed has minimum effect on the surface roughness when turning operation is performed on a material,
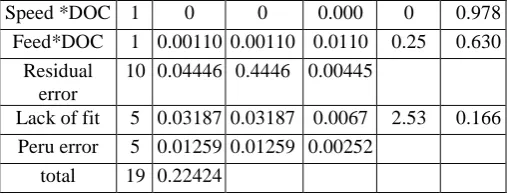
Table 5: ANOVA table for facing operation Source DF Seqss Adjss Adj MS F P Regression 9 1.17978 1.17978 0.13109 29.49 0 Linear 3 1.15755 1.15755 0.38585 86.79 0 Speed 1 0.00750 0.00750 0.00750 0.69 0.223
IJEDR1601015
International Journal of Engineering Development and Research (www.ijedr.org)93
Speed *DOC 1 0 0 0.000 0 0.978
Feed*DOC 1 0.00110 0.00110 0.0110 0.25 0.630 Residual
error
10 0.04446 0.4446 0.00445
Lack of fit 5 0.03187 0.03187 0.0067 2.53 0.166 Peru error 5 0.01259 0.01259 0.00252
total 19 0.22424
This ANOVA table describes that feed rate has maximum effect on the surface roughness as p value corresponding to it is 0. And interaction of cutting speed and depth of cut (at constant feed rate) has minimum effect on surface roughness on faced end as the p value is coming maximum.
In minitab surface and contour plots can be generated that shows how interactions of two factors affect the surface roughness in 3D graphs and 2D graphs. Surface graphs are 2D graphs and contour graphs are 3D graphs. Contour and surface plots for different interaction are discussed below.
Figure 3: contour and surface plots of Ra turning (µm) vs DOC, feed
These graphs represents that surface roughness is minimum when both feed rate and depth of cut is minimum. Change indepth of cut has not significant role in the change of surface roughness but with change in the feed rate there is a significant change in the surface roughness. Surface roughness is maximum when feed rate and depth of cut is maximum.
Figure 4: contour and surface plots of Ra turning (µm) vs DOC, speed
IJEDR1601015
International Journal of Engineering Development and Research (www.ijedr.org)94
Figure 5: contour and surface plots of Ra turning (µm) vs feed, speedThese graphs show that surface roughness is minimum when both cutting speed and feed rate are minimum. In this graph dark blue color represents the minimum surface roughness. When cutting speed is minimum and feed rate is maximum then surface roughness is maximum as the dark green region represents maximum surface roughness. This graphs represent that feed rate shows greater effect on the surface roughness than cutting speed.
Figure 6: contour and surface plots of Raa facing (µm) vs feed, speed
In these graphs the effect of interaction ofcutting speed and feed rate is shown. Surface roughness is minimum when cutting speed and feed rate are minimum and maximum when feed rate is maximum and cutting speed ranges from minimum to middle range. These graphs show that feed rate has more effect on surface roughness than cutting speed during the facing operation.
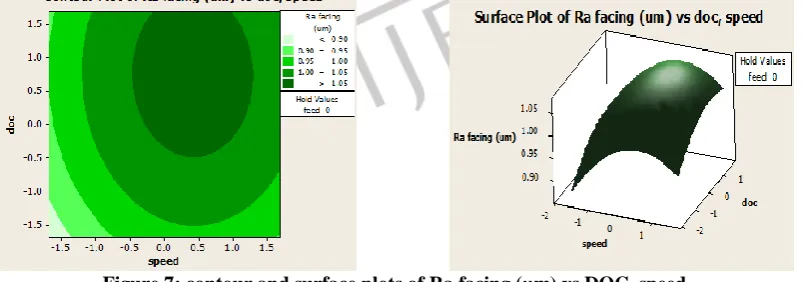
Figure 7: contour and surface plots of Ra facing (µm) vs DOC, speed
IJEDR1601015
International Journal of Engineering Development and Research (www.ijedr.org)95
Figure 8: contour and surface plots of Ra facing (µm) vs DOC, feed
These graphs show that feed rate has more effect than depth of cut on surface roughness during the facing operation. Surface roughness is minimum when feed rate is minimum for the entire range of depth of cut and maximum when feed rate is maximum.
1.68179 1.00000 0.00000 -1.00000 -1.68179 1.50 1.25 1.00 0.75 0.50 1.68179 1.00000 0.00000 -1.00000 -1.68179 1.68179 1.00000 0.00000 -1.00000 -1.68179 1.50 1.25 1.00 0.75 0.50 speed M ea n feed doc
Main Effects Plot for Ra facing (um)
Data Means
Figure 9: Main effect plots for Ra facing (µm)
This represents that feed rate shows maximum effect on surface roughness during facing as the line shows maximum deviation from the center line. Line representing the cutting speed is straight are nearly overlaps the mean line this shows that speed has minimum effect on surface roughness. Similarly depth of cut also has minimum effect on surface roughness during facing operation. 1.68179 1.00000 0.00000 -1.00000 -1.68179 1.50 1.25 1.00 0.75 0.50 1.68179 1.00000 0.00000 -1.00000 -1.68179 1.68179 1.00000 0.00000 -1.00000 -1.68179 1.50 1.25 1.00 0.75 0.50 speed M e a n feed doc
Main Effects Plot for Ra turning (um)
Data Means
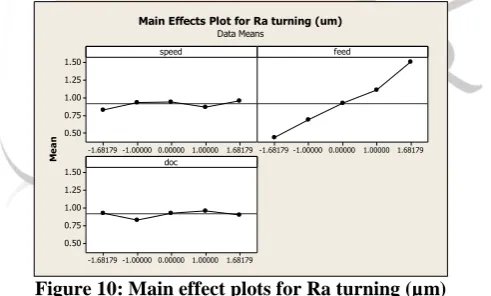
Figure 10: Main effect plots for Ra turning (µm)
This main effect plot for Ra turning shows that cutting speed and depth of cut has minimum effect of surface roughness during turning operation. And feed rate has maximum effect on surface roughness.
V.CONCLUSIONS
In this paper Response Surface Methodology was used to see the influence of the input parameters on the surface roughness of the aluminium 6061 alloy during turning and facing operation& to optimize the process. A mathematical quadratic equation is developed for surface roughness. The results are as bellow:
1. Feed rate is the main significant factorfor surface roughness. Depth of cut and cutting speed has no significant effect on surface roughness.
2. Contour and surface plots was used for determining the optimal conditions to obtain required surface roughness.
3. Response Surface Methodology shows that optimal values for the lowest surface roughness are 165.5 m/min, 0.1mm/rev, 0.85 mm for cutting speed, feed rate and depth of cut respectively.
VI.REFERENCES
IJEDR1601015
International Journal of Engineering Development and Research (www.ijedr.org)96
[2] Aouici H. et al, “Analysis of surface roughness and cutting force components in hard turning with CBN tool: Predictionmodel and cutting conditions optimization”, Measurement 45 (2012) 344–353
[3] Suresh R. et al, “Some studies on hard turning of AISI 4340 steel using multilayer coated carbide tool”, Measurement 45 (2012) 1872–1884
[4] Barik C.R. et al, “Parametric effect and optimization of surface roughness of EN31 in CNC dry turning”, International journal of lean thinking volume 3, Issue 2 (December 2012)
[5] Ganesan H. et al, “Optimization of machining techniques in CNC turning centre using Genetic algorithm”, Arab J SciEng (2013) 38:1529-1538
[6] Gulhane U.D. et al, “Analysis of influence of shaping process parameters on MMR and Surface Roughness of Al6061 using Taguchi method”, International Journal of Applied Research and Studies Vol. 2 Issue 4, 2278-9480
[7] Syed Azuan S.A., “Effect of dry machining on tool wear during turning Al6061 by using different type of PVD and CVD coated carbide inserts”, Australian journal of basic and applied science 7(4): 90-93
[8] Makadia A.J. et al, “Optimization of machining parameters for turning operations based on response surface methodology”, Measurement 46(2013)1521-1529
[9] Das S.R. et al, “ Effect of machining parameters on surface roughness in machining of hardened AISI 4340 steel using coated carbide inserts”, ISSN 2028-9324 Vol.2 No.4 Apr.2013, pp 445-453
[10] Lin C.L. , “Use of the Taguchi method and Grey relation analysis to optimize turning operation with multiple performance characteristics”, Material and Manufacturing processes 19:2, 209-220
[11] Das B. et al, “Analysis of surface roughness on machining of Al-5Cu alloy in CNC lathe machine”, IJRET eISSN: 2319-1163 Vol.02 Issue: 09