White Rose Research Online URL for this paper: http://eprints.whiterose.ac.uk/77199/
Version: Accepted Version
Article:
Baker, Daniel Hart orcid.org/0000-0002-0161-443X and Cass, John (2013) A dissociation of performance and awareness during binocular rivalry. Psychological Science. pp. 2563-2568. ISSN 1467-9280
https://doi.org/10.1177/0956797613496824
[email protected] https://eprints.whiterose.ac.uk/
Reuse
Items deposited in White Rose Research Online are protected by copyright, with all rights reserved unless indicated otherwise. They may be downloaded and/or printed for private study, or other acts as permitted by national copyright laws. The publisher or other rights holders may allow further reproduction and re-use of the full text version. This is indicated by the licence information on the White Rose Research Online record for the item.
Takedown
If you consider content in White Rose Research Online to be in breach of UK law, please notify us by
A dissociation of performance and
awareness during binocular rivalry
Daniel H. Baker1 & John R. Cass2
1. Department of Psychology, University of York, York, UK, email: [email protected] 2. School of Psychology, University of Western Sydney, Australia
Abstract
When conflicting stimuli are presented to equivalent locations in each eye we experience binocular rivalry, a phenomenon characterised by alternations in conscious awareness of each eye’s image. Attempts at objective measurement using monocular probe detection methods show that sensitivity is reduced during periods of reported suppression. But are observers really able to detect stimuli that are perceptually invisible (due to suppression), or does the probe presentation itself reverse rivalry dominance? Here, we measure both performance and confidence at multiple probe contrasts, and find evidence for high performance with reduced awareness during suppression that is not due to probe‐induced switches in dominance. This dissociation points to the existence of blindsight‐like behaviour in normal observers.
Keywords: binocular rivalry, visual awareness, suppression
Introduction
A long‐standing issue in the empirical investigation of human consciousness concerns the extent to which information is processed outside of awareness (see Hassin, 2013 for a recent review). Binocular rivalry, in which the perception of different images shown to the two eyes alternates over time, is a widely used tool that permits the dissociation of stimulus and percept to address such questions. During rivalry, one eye’s image is visible for a period, with the other eye’s image being suppressed from awareness. A common finding is that sensitivity to probe stimuli (e.g. changes in luminance or contrast) presented to the suppressed eye is poorer than for probes presented to the dominant eye. But given that probes shown to the suppressed eye are supposedly invisible, how are subjects able to do this task at all?
previous study has looked for such a dissociation of performance and awareness directly during probed continuous rivalry.
An alternative explanation is that presentation of the probe itself disrupts the suppression of the invisible image, and causes a reversal of rivalry dominance. This would allow the image in the suppressed (probed) eye to become visible, rendering an explanation of observers’ high performance trivial. By this account, since the probe is not invisible, there should be no reduction in confidence relative to performance. Of course, a sufficiently high contrast probe will inevitably reverse dominance (Kim, Grabowecky, & Suzuki, 2006; Wolfe, 1984), so exploring this possibility requires detailed quantitative measurements across a range of probe contrasts.
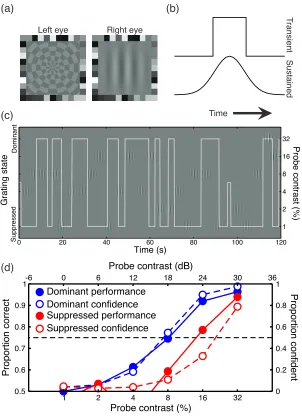
To resolve these outstanding issues, we measured sensitivity to contrast increment probes (at six different contrast levels) presented to a single eye during both the dominance and suppression periods of rivalry (Figure 1a). Observers continuously reported the state of rivalry alternations (e.g. Figure 1c), and gave both a performance judgement (Alais, Cass, O’Shea, & Blake, 2010) about each probe’s location (left or right) and a subjective binary rating of their confidence in this response (high or low). We reasoned that high performance accuracy but low confidence would be evidence for a ‘blindsight’‐like effect, so we compared both confidence and performance thresholds during dominance and suppression. To test the reversal hypothesis, we calculated the probability of a rivalry alternation occurring immediately following a probe presentation. Two different temporal waveforms (Figure 1b) were used to modulate probe onsets and offsets to examine whether transients influence dominance reversals.
Method
Apparatus & Stimuli
All stimuli were presented on a Clinton Monoray monitor using a VSG2/5 (Cambridge Research Systems Ltd., Kent, UK) installed in a PC. To enable dichoptic presentation of stimuli, we used ferro‐electric shutter goggles (FE‐01, CRS, UK) that were synchronised with the 120Hz refresh rate of the monitor.
Viewed through the goggles, the display had a mean luminance of 15cd/m2, and
was gamma corrected using a photometer.
We used very similar rivalry stimuli to previous work (Alais et al., 2010; Watanabe, Paik, & Blake, 2004) to facilitate comparisons between studies (see Figure 1a). A sine‐wave grating stimulus was always shown to the right eye and
had a contrast of 25%, where contrast is defined as C% = 100(Lmax‐
Lmin)/(Lmax+Lmin), where L is luminance. We also express contrast in decibels (CdB
= 20log10(C%)). The grating had a spatial frequency of 2.5c/deg and was
from 7.5% to 15%. Both stimuli were surrounded by a binocular fusion lock, an example of which is shown in Figure 1a.
We applied a contrast increment to either the left or the right side of the grating at random intervals throughout the experiment. The contrast increments ranged from 1% to 32% in multiples of two (6 levels). There were two temporal envelopes for the probe (see Figure 1b): a step function of 160ms duration and a smooth Gaussian envelope with a full width at half height of 160ms. We refer to these as the transient and sustained conditions respectively.
Left eye Right eye
(a) Time T ra n si e n t Su st a in e d (b) (c)
0 20 40 60 80 100 120
Time (s) 1 2 4 8 16 32 Pro b e co n tra st (% ) D o mi n a n t Su p p re sse d G ra ti n g st a te
1 2 4 8 16 32
Probe contrast (%) 0.5 0.6 0.7 0.8 0.9 1 Pro p o rt io n co rre ct
-6 0 6 12 18 24 30 36
Probe contrast (dB)
[image:4.595.148.450.220.637.2]0 0.2 0.4 0.6 0.8 1 Dominant performance Dominant confidence Suppressed performance Suppressed confidence Pro p o rt io n co n fid e n t (d)
Procedure
Observers viewed the display through the goggles, which were mounted in a chin and head rest 114cm from the monitor. They reported the rivalry state continuously during trials using a mouse in their left hand. Each probe presentation was indicated by a beep, after which observers used the left and right arrow keys (with their right hand) to indicate which side of the grating they believed the probe was presented on. They then reported their confidence in this response (high or low) using the up and down arrow keys. Both of these responses were acknowledged by beeps. The next probe was presented between three and five seconds after the observer’s confidence response. Each block consisted of 60 probe presentations, divided equally between the 6 probe contrasts. Observers completed 12 blocks for each of the two temporal conditions (transient and sustained), taking around 2‐3 hours per observer.
We analysed the data in several ways. First, we assigned probe presentations to periods of dominance or suppression based on the rivalry state reports. Because of the latency between a rivalry transition and the observer’s report of it, we offset the probe times by one second. We examined slightly longer and shorter latencies, and considered setting latencies independently for each observer, but none of these manipulations affected our main findings.
Sigmoidal functions (cumulative log‐Gaussians) were then fitted to the psychometric data (e.g. Figure 1d) during dominance and suppression. Since the performance task was two alternative forced choice (2AFC), these functions ranged from 50% to 100% correct, with threshold defined as the contrast level that produced 75% correct performance (the midpoint of the function). The confidence data required a function that ranged from 0% confident to 100% confident, with threshold given at the midpoint of 50% confident.
The suppression effect was defined as the ratio of performance thresholds (expressed in % contrast) between suppression and dominance epochs (this is often referred to as the ‘depth of suppression’). We then calculated an index of Suppression Induced Confidence Loss (SICL index). To do so, it was necessary to account for differences in the criterion for confidence judgements across observers. This was achieved by calculating the ratio of the confidence to performance thresholds during both dominance and suppression, and then taking the ratio of these two ratios. This factors out any fixed criterion effects, revealing the change in confidence (relative to sensitivity) between dominance and suppression. A SICL index of 1 indicates that observers were equally confident during dominance and suppression, whereas values >1 would imply a reduction of confidence during suppression.
each probe contrast. We normalized the probabilities to those for the 1% probe contrast, and then averaged across observers.
Finally, we reproduced the temporal analysis of Alais et al. (Alais et al., 2010) for the 8% probe contrast. The response data from each probe presentation were binned according to the time during a period of dominance or suppression that the probe occurred, relative to the total length of the period (6 bins). We pooled the data within each bin across the two temporal conditions (which appeared similar on individual inspection) and across observers to produce the average plot in Figure 2e.
Observers
The experiment was completed by 8 observers (5 male) ranging in age from 22 to 47. All had normal or corrected‐to‐normal vision, with no known binocular abnormalities. Two observers were the authors. The remaining observers were not aware of the aims of the experiment, and ranged from highly psychophysically experienced to relatively inexperienced. Other than the authors, none of the observers had previously taken part in a binocular rivalry experiment.
Results
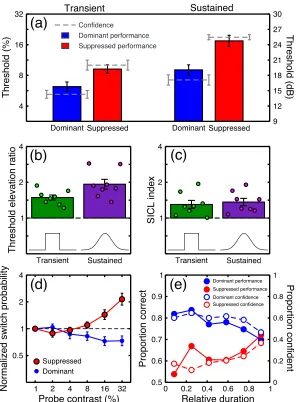
All observers produced performance and confidence data that were increasing monotonic functions of probe contrast (e.g. Figure 1d). We fitted curves to these functions and estimated thresholds at the midpoints, which are summarised in Figure 2a for performance (bars) and confidence (dashed lines). Although there were idiosyncracies owing to individual criterion differences in the (subjective) confidence task (not shown), on average confidence thresholds were lower than performance thresholds during dominance (blue bars and dashed lines) and higher during suppression (red bars and dashed lines).
We found a significant effect of rivalry state on the contrast threshold for
detecting the probe (t(15)=8.54, p=0.0001, two‐tailed, r = 0.91), similar in
magnitude to previous reports (Watanabe et al., 2004). On average, thresholds were 1.69 times higher during suppression than during dominance (Figure 2b). Our measure of the loss of confidence during suppression (SICL index) – calculated by taking the ratio of confidence to performance thresholds for each rivalry state, and then calculating the ratio of these values across suppression
and dominance – was significantly greater than one (t(15)=5.55, p=0.0124, two‐
tailed, r = 0.82; separate analyses of the transient and sustained conditions were
also significant at p<0.05), and amounted to a factor of 1.33 (Figure 2c). So,
during suppression observers could perform better than they realised relative to comparable conditions during dominance. (An alternative way of analysing these data is to assess the interaction term of a 2x2 repeated measures ANOVA on the thresholds for confidence and performance. This was also highly significant
(F1,15=30.8, p<0.0001). Furthermore, our effects remained significant when the
Dominant Suppressed Dominant Suppressed 4
8 16 32
Threshold (%
)
9 12 15 18 21 24 27 30
Transient Sustained
1 2 4
Threshold elevation ratio
Transient Sustained
1 2 4
SICL index
1 2 4 8 16 32 Probe contrast (%) 0.5
1 2 4
Normalized switch probability
Suppressed Dominant
0 0.2 0.4 0.6 0.8 1 Relative duration 0.5
0.6 0.7 0.8 0.9 1
Proportion correct
0 0.2 0.4 0.6 0.8 1
Dominant performance Suppressed performance Dominant confidence Suppressed confidence
Threshold (dB)
(e)
Transient Sustained
(a)
(b)
(c)
(d)
Proportion confidentConfidence
Dominant performance Suppressed performance
Figure 2: (a) Thresholds for performance (bars) and confidence (dashed lines) averaged across observers (N=8), with error bars showing ±1SEM. (b) Threshold elevation effects, calculated by taking the ratio between dominance and suppression (red and blue bars in panel a). Circular symbols correspond to individual observers, with bars giving the average (±1SEM). (c) The SICL index, presented in the same format as panel b. See text for details. (d) Normalized switch probabilities as a function of probe contrast during suppression (red) and dominance (blue). Results in the transient and sustained conditions were similar, so we averaged across observer and temporal condition (N=16). Error bars show ±1SEM. (e) Performance (solid lines, left axis) and confidence (dashed lines, right axis) scores during dominance (blue) and suppression (red), as a function of probe presentation time relative to the length of the period of dominance. Data are for the 8% probe contrast, pooled across observer and temporal condition.
It has previously been shown that the slope of the psychometric function for orientation discrimination becomes shallower during rivalry suppression (Ling & Blake, 2009). We compared psychometric slopes (the inverse of the spread parameter of the fitted cumulative log‐Gaussian) across dominance and suppression for our contrast disrimination task, but found no differences for
either performance or confidence (all p>0.1). This is most likely because the
[image:7.595.150.450.71.473.2]
We calculated the probability of a switch occuring during the 1 second following probe presentation (Figure 2d). Probes did not cause rivalry switches from the mask to the grating until the probe contrast was above 8%. This is important because in the transient condition, the average threshold during suppression was around 8% (Figure 2a). This implies that probes were reliably detected during periods of suppression, but not because they caused a reversal of dominance that would have rendered them trivially visible.
Discussion and Conclusions
A recent study (Alais et al., 2010) demonstrated that sensitivity varies throughout a period of dominance or suppression. In principle, this might be due to increases in the probability of probe‐induced switches towards the end of a period of dominance. Since the 8% probe contrast did not increase switch probability, we performed a time‐course analysis (Alais et al., 2010) at this contrast to see if this finding could be replicated in a condition with probes at 8% contrast, a value below the level at which probes themselves induce switches (Figure 2d). As predicted, sensitivity decreased towards the end of a period of dominance, but increased towards the end of a period of suppression (filled symbols, Figure 2e). Confidence judgements followed a similar pattern (open symbols). This lends support to the view (Alais et al., 2010; McDougall, 1901) that binocular rivalry is driven by reciprocal inhibition between ocular dominance channels, and that switches in perceptual state are driven by adaptation.
Our confidence judgements constitute a Type II signal detection measure, a technique that has long been used (e.g. Peirce & Jastrow, 1885) to investigate the relationship between objective performance and subjective awareness. Such measures have been elaborated in various interesting ways to investigate visual consciousness for a variety of tasks (e.g. Kanai et al., 2010). For example, in the post decision wagering paradigm (Persaud, McLeod, & Cowey, 2007) subjects place a bet on the accuracy of their performance (Type I) decision. Whilst such techniques could in principle be applied to binocular rivalry, we elected to keep our confidence rating as simple as possible (i.e. a binary judgement) to minimise the cognitive demands on the subject, who was simultaneously reporting the rivalry state. The richer data afforded by more elaborate methods might be used in future studies using non‐continuous rivalry (e.g. flash suppression) techniques. To provide closer linkage with clinical blindsight studies (Goodale et al., 1991), it might also be fruitful to use guided motor tasks, such as eye movements or pointing, instead of button presses to log observer responses.
is important that stimulus conditions for future studies on performance during suppression are carefully selected to avoid this confound.
Declaration of conflicting interests
The authors declared that they had no conflicts of interest with respect to their authorship and/or the publication of this article.
Funding
Supported by EPSRC Grant EP/H000038/1 and ARC grant DP0774697.
References
Alais, D., Cass, J., O’Shea, R. P., & Blake, R. (2010). Visual Sensitivity Underlying Changes in Visual Consciousness. Curr Biol, 20(15), 1362–1367. doi:10.1016/j.cub.2010.06.015
Goodale, M. A., Milner, A. D., Jakobson, L. S., & Carey, D. P. (1991). A neurological dissociation between perceiving objects and grasping them. Nature, 349(6305), 154–6.
doi:10.1038/349154a0
Hassin, R. R. (2013). Yes It Can: On the Functional Abilities of the Human Unconscious.
Perspectives on Psychological Science, 8(2), 195–207. doi:10.1177/1745691612460684 Kanai, R., Walsh, V., & Tseng, C. (2010). Subjective discriminability of invisibility: a framework for
distinguishing perceptual and attentional failures of awareness. Conscious Cogn, 19(4), 1045–57. doi:10.1016/j.concog.2010.06.003
Kim, Y.‐J., Grabowecky, M., & Suzuki, S. (2006). Stochastic resonance in binocular rivalry. Vision Res, 46, 392–406.
Kolb, F. C., & Braun, J. (1995). Blindsight in normal observers. Nature, 377(6547), 336–8. doi:10.1038/377336a0
Ling, S., & Blake, R. (2009). Suppression During Binocular Rivalry Broadens Orientation Tuning. Psychological Science, 20(11), 1348–1355. doi:10.1111/j.1467‐9280.2009.02446.x McDougall, W. (1901). Some new observations in support of Thomas Young’s theory of light‐ and
colour‐vision (I.). Mind, 10, 52–97.
Meese, T. S., Georgeson, M. A., & Baker, D. H. (2006). Binocular contrast vision at and above threshold. J Vis, 6, 1224–1243.
Morgan, M. J., Mason, A. J., & Solomon, J. A. (1997). Blindsight in normal subjects? Nature, 385(6615), 401–2. doi:10.1038/385401b0
Peirce, C. S., & Jastrow, J. (1885). On small differences in sensation. Memoirs of the National Academy of Sciences, 3, 73 – 83.
Persaud, N., McLeod, P., & Cowey, A. (2007). Post‐decision wagering objectively measures awareness. Nature Neuroscience, 10(2), 257–261. doi:10.1038/nn1840
Watanabe, K., Paik, Y., & Blake, R. (2004). Preserved gain control for luminance contrast during binocular rivalry suppression. Vision Res, 44, 3065–71.
Wolfe, J. M. (1984). Reversing ocular dominance and suppression in a single flash. Vision Res, 24(5), 471–8.