University of Southern Queensland
Faculty of Engineering and Surveying
Vehicle Energy Usage
A dissertation submitted by
Mr Andrew Bellars
Student number : 0039732689
In fulfillment of the requirements of
Abstract
The waste heat from exhaust gases and cooling systems of internal combustion engines can be an important heat source to provide additional power and improve engine overall efficiency.
Developments and efficiency improvements in thermal electric generator technology has made recycling of this previously ignored energy source a viable proposition.
In this research project a design of an exhaust gas thermal electric generator is proposed. A computer simulation using CFD software ANSYS16.1 is conducted to estimate the expected performance of the system.
It is proposed that the Thermal electric generator output be used to charge the vehicle battery and thereby replace the conventional vehicle charging system. Additionally due to the continuous nature of the electrical power output it is proposed that electrical power also be utilized to power a
hydrogen generation unit which will allow a controlled amount of hydrogen / oxygen mixture back into the engine under light throttle and lean burn conditions.
University of Southern Queensland
Faculty of Health, Engineering and Sciences
ENG4111/ENG4112 Research Project
Limitations of Use
The Council of the University of Southern Queensland, its Faculty of Health, Engineering & Sciences, and the staff of the University of Southern Queensland, do not accept any responsibility for the truth, accuracy or completeness of material contained within or associated with this dissertation.
Persons using all or any part of this material do so at their own risk, and not at the risk of the Council of the University of Southern Queensland, its Faculty of Health, Engineering & Sciences or the staff of the University of Southern Queensland.
Candidate certification
I certify that the ideas, designs and experimental work, results, analyses and conclusions set out in this dissertation are entirely of my own effort, except where otherwise indicated and acknowledged.
I further certify that the work is original and has not been previously submitted for assessment in any other course or institution, except where specifically stated.
Student name: Andrew Bellars Student number: 0039732689
_____________________ Signature
Acknowledgements
I take this opportunity to express my gratitude to Dr Ray Malpress for all his help and support in enabling me to present this dissertation.
Table of Contents
Abstract ... i
Candidate certification ... iii
Acknowledgements ... iv
Chapter 1 ... 1
Introduction ... 1
1.1 Introduction ... 1
1.1.1 Consequential effects of design ... 2
1.1.2 Risk assessment ... 2
1.1.3 Installation risk management plan ... 3
1.1.4 Timeline ... 5
Chapter 2 ... 6
Vehicle system energy waste ... 6
2.1 Introduction ... 6
2.1.1 Cooling systems ... 6
2.1.2 Torque convertor ... 6
2.1.3 Braking systems ... 8
2.3 Thermal efficiency of internal combustion engines ... 10
2.3.1 Carnot efficiency ... 10
2.3.2 Otto cycle ... 12
Chapter 3 ... 16
Thermoelectric technology ... 16
3.1 Introduction ... 16
3.2 Thermoelectric Generator (TEG) ... 17
3.2.1 Conversion efficiency ... 21
3.2.2 Maximum performance parameters ... 24
3.2.3 Thermal and Electrical contact resistances for TEG ... 26
Chapter 4 ... 31
Exhaust waste heat thermal generator ... 31
4.1 Introduction ... 31
4.2 Exhaust gas thermal generator ... 32
4.2.1 TEG component selection ... 33
4.2.2 Exhaust gas thermal generator configuration and performance ... 37
4.2.3 Hot source heat exchanger design ... 38
4.2.5 Thermal Generator design proposal ... 41
4.3 Thermal Analysis ... 42
4.3.1 Simulation operating conditions ... 43
4.3.2 Theory and boundary conditions ... 44
4.3.3 Model setup parameters ... 45
4.3.4 Results of thermal analysis ... 45
4.3.6 Results of analysis ... 51
4.3.6 Analytical analysis ... 53
4.3.7 Comparison between CFD and analytical analysis ... 58
4.3.8 Analysis conclusion ... 59
Chapter 5 ... 60
Application ... 60
5.1 Introduction ... 60
5.1.1 Estimation of electrical system loading ... 61
5.2 Battery charging system ... 66
5.3 Hydrogen generator ... 66
5.3.1 Benefits of hydrogen addition ... 66
5.3.3 Output analysis ... 75
Chapter 6 ... 79
Conclusion ... 79
List of tables
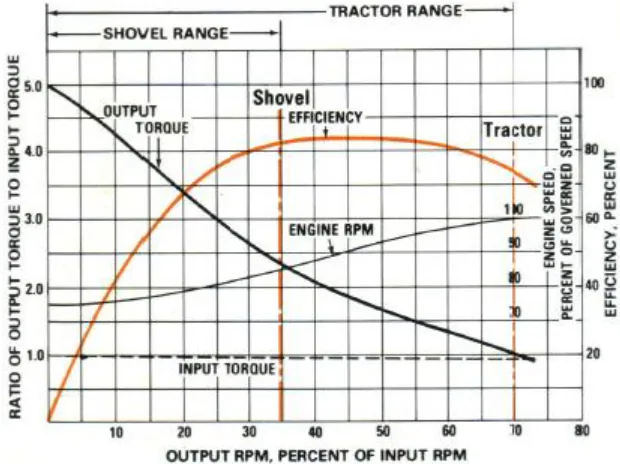
Table 1 Torque converter efficiency curve (JM clutches and converters) 7
Table 2 Efficiency vs compression ratio curve for Otto cycle engine (http://home.iitk.ac). 15
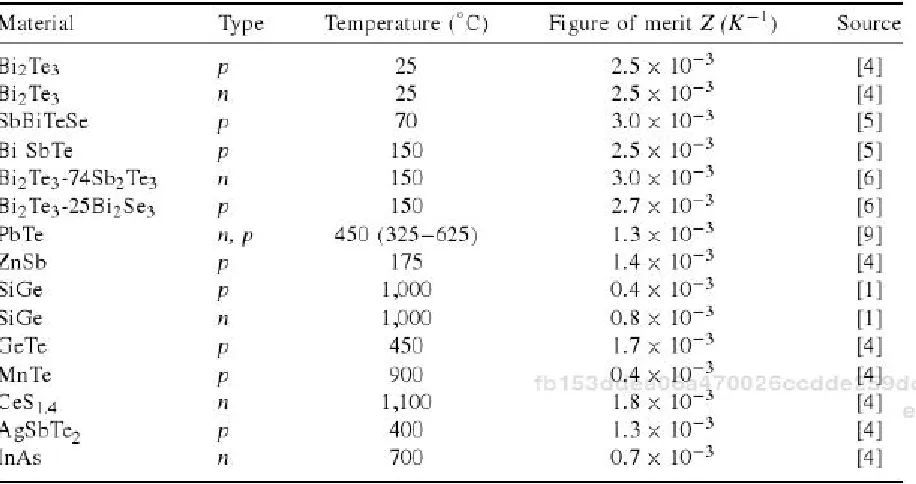
Table 3 Figures of merit for common semiconductor materials (Lee, Ho Sung, 2010) 18
Table 4 TEG characteristics chart with 𝑍𝑇 = 1 and 𝑇𝑐/𝑇ℎ = 0.5 (Lee, Ho Sung, 2010). 25
Table 5 Maximum conversion efficiency and maximum power efficiency (Lee, Ho Sung, 2010). 26
Table 6 Performance specifications (Thermal Electronics Corporation) 34
Table 7 Typical engine operating conditions based on 1200cc engine 44
Table 8 Simulation model setup parameter 45
Table 9 Output values on urban cycle 46
Table 10 Output values on suburban cycle 48
Table 11 Output values on maximum power cycle 50
Table 12 Urban driving simulation results 52
Table 13 Suburban driving simulation results 52
Table 14 Maximum power simulation results 52
Table 15 Heater core hole / area comparison 53
Table 17 Output comparison between analytical analysis and CFD 58
Table 18 Estimated electrical power requirements for a typical vehicle 60
Table 19 Expected future electrical systems (Rashid 2011) 61
Table 20 Common electrical loads and corresponding estimated use in 24 hour cycle 62
Table 21 Net power output for electrical loading on suburban cycle 65
List of figures
Figure 1 Heat flow diagram (http://user.physics) ... 9
Figure 2 Carnot engine cycle (http://hyperphysics) ... 11
Figure 3 Idea Otto engine cycle (http://web.mit.edu) ... 12
Figure 4 Thermocouple (Lee, Ho Sung, 2010) ... 16
Figure 5 Thermoelectric couple with dissimilar p and n elements (Lee, Ho Sung, 2010) ... 18
Figure 6 Thermoelectric generator (Lee, Ho Sung, 2010) ... 22
Figure 7 Configuration of a real thermoelectric couple (Lee, Ho Sung, 2010) ... 26
Figure 8 Power per unit area and conversion efficiency vs thermoelement length (Lee, Ho Sung, 2010) ... 30
Figure 9 45 Watt liquid to liquid TEG operating on DT 115℃ (http://espressomilkcooler.com/about/) ... 31
Figure 10 Exhaust gas temperature chart for Ford Explorer (McDonald & Jones, 2000) ... 33
Figure 11 Hybrid TEG1-PB-12611-6.0 module (Thermal Electronics Corporation) ... 35
Figure 12 TEG1-PB-12611-6.0 module physical dimensions (Thermal Electronics Corporation) .. 35
Figure 13 TEG1-PB-12611-6.0 module performance parameters (Thermal Electronics Corporation) ... 36
Figure 15 Thermal generator ... 39
Figure 16 Aluminum cooling ducts ... 40
Figure 17 Assembled model of thermal generator ... 41
Figure 18 Fluid and Solid domains of model with 2 planes of symmetry. ... 42
Figure 19 Fluid domain of model with 2 planes of symmetry ... 43
Figure 20 Temperature of hot side of TEG on urban cycle ... 46
Figure 21 Internal fluid wall temperature on urban cycle ... 47
Figure 22 Temperature of hot side of TEG on suburban cycle ... 48
Figure 23 Internal fluid wall temperature on suburban cycle ... 49
Figure 24 Temperature of hot side of TEG on maximum power cycle ... 50
Figure 25 Internal fluid wall temperature on maximum power cycle ... 51
Figure 26 Output comparison between analytical analysis and simulation ... 58
Figure 27 Net power output for Average electrical loading with driving on suburban cycle. ... 63
Figure 28 Net power output for Heavy electrical loading with driving on suburban cycle. ... 64
Figure 29 Net power output for Extreme electrical loading with driving on suburban cycle. ... 65
Figure 30 Apparent turbulent flame speed as a function of equivalence ratio (Cassidy 1977) ... 67
Figure 31 Indicated thermal efficiency as a function of equivalence ratio (Cassidy 1977) ... 68
Figure 33 Variation in brake thermal efficiency with 𝐻2/𝑂2 addition (Bari and Mohammad Esmaeil
2008) ... 70
Figure 34 Variation in brake specific fuel consumption with 𝐻2/𝑂2 addition (Bari and Mohammad
Esmaeil 2008) ... 70
Figure 35 Variation in HC emissions with 𝐻2/𝑂2 percentage (Bari and Mohammad Esmaeil 2008)
... 71
Figure 36 Variation in 𝑁𝑂𝑥 emissions with 𝐻2/𝑂2 percentage (Bari and Mohammad Esmaeil 2008)
... 72
Figure 37 Variation in CO emissions with 𝐻2/𝑂2 percentage (Bari and Mohammad Esmaeil 2008)
... 72
Figure 38 Heat power distribution without TEG driven hydrogen generator. ... 78
Chapter 1
Introduction
1.1
Introduction
With energy sustainability at the forefront of public and national concerns there is a pressing need to develop a better understanding of clean, safe alternative energy sources. Additionally our finite fossil fuel reserve need to be consumed as efficiently and sparingly as possible (Da Rosa, Aldo V, 2012). Internal combustion engines are a major consumer of our planets finite fossil fuel reserves. In California, approximately one-half of all the fuel reserves consumed, are for transportation – cars, planes, trucks, motorcycles, trains and buses. Of all the oil used in this state about three-quarters goes into making petrol and diesel fuel for vehicles (The Energy story, 2012).
As a result extensive research and development is devoted to finding alternative fuels for our engines and develop technology to improve the efficiency of current systems. There is much promise in electrical technology, however battery systems and electrical storage device development has limited the use of this technology so far. Electric motors are inherently more efficient than a heat engines. An electric motor could also be considered to be more environmentally friendly. This would depend on how the electric power is generated in the first instance. Solar power being somewhat emission free. Coal powered power stations, although they may have higher thermal efficiencies than an internal combustion (IC) engines, by the time power is relayed to the vehicle, this advantage is eroded (Da Rosa, Aldo V, 2012).
IC engines operating on easy to handle liquid fuel have been a very convenient power source over the last 120 years. This is likely to continue for many years to come. Emission levels have been a concern but could be largely offset by the use of renewable fuels such as Ethanol or Hydrogen, combined with well-developed and efficient emission control devices.
The main disadvantage of an IC engine is the relatively poor thermal efficiency. Of the total heat that is supplied to an engine in the form of fuel only 25% to 35% is converted into usable
mechanical work. The remainder of this heat is wasted in discharged exhaust gasses or dissipated by the engine cooling systems (Yunus & Cengel, 2002). Effectively only 25 cents in every dollar spent on fuel is actually used to create power and 75 cents is completely wasted and discarded as wasted heat energy. Approximately 40% of this wasted thermal energy is discarded into the exhaust system. Statistics released by the ministry of public security in China showed that there were more than 240 million vehicles operating in China in 2012. This amounted to an annual fuel consumption of more than 270 million tons. The amount of wasted heat discharged into the exhaust system in 2012 in China alone amounted to a massive 107.6 million tons of fuel (Shengqiang B et al, 2014). Obviously a large percentage of the world’s available fossil fuel reserves have already been depleted in this inefficient manner.
thermal heat waste that is available for potential further use is quantified. Techniques for transforming thermal energy to electrical energy are discussed and analyzed with particular attention on the Seebeck effect thermal electric generators (TEG).
In this report a design of a thermal electric generator layout using the wasted thermal energy from an exhaust system is proposed. The design includes a solid model as well as an analytical and CFD analysis of the system. Possible designs to extract electrical power from the cooling system and vehicle torque convertor are discussed. It is proposed that the electrical power generated could be used to replace the vehicle charging system as well as power an electrolysis based Hydrogen production cell to improve vehicle fuel consumption.
1.1.1
Consequential effects of design
While it is anticipated that the thermal electric generator will increase overall thermal efficiency of an automotive internal combustion engine system, it is imperative that consideration be given to the consequential and ethical effects on society as a whole as well as the recyclability of the new component.
It is anticipated that the thermal electric generator will consist predominantly of aluminum alloy, which is readily available in all countries and easy to recycle. Thermal electric generator
components are typical semiconductor materials and will need to be recycled in a similar manner to any other automotive electronic component.
The auto-electrical industry is a well-established industry with an extensive network of part suppliers, manufacturers and tradesman. If thermoelectric charging systems were to become a viable alternative to the conventional vehicle charging systems then many people may find their industry and employment opportunities dwindling. However the auto-electrical industry is also very dynamic and as many opportunities diminish, other arise. In recent times the focus of those involved in auto-electrical repairs has changed from being predominantly involved in starting and charging system repairs to more engine and body electronic related repairs and diagnosis. Starter motors and alternators have largely become cheaper to replace with a new part than to repair. The main component of the auto-electrical industry that could be effected would be the component
manufacturers. As already mentioned there would be many opportunities in the manufacture of thermal electric generators and the drop off in demand for conventional charging system
components would also diminish gradually. Additionally even though the thermal electric generator will have no moving parts and should be more durable than a conventional alternator, they will still operate in a harsh thermally fluctuating and corrosive environment. As with any other automotive component they will have a serviceable life. This may generate more employment opportunities for other related automotive industries such as exhaust fitters.
1.1.2
Risk assessment
Additional safety concerns will need to be considered in the design of an exhaust thermal
combines readily with metals. Hydrogen piping and plumbing needs to be constructed of materials that are suitable. This material would normally be stainless steel which is relatively expensive. Hydrogen generation cell output needs to be carefully monitored and controlled. Excessive
production and/or storage could lead to explosion and fire hazard. Particular consideration needs to be given to the effects of an accident and/ collisions on the hydrogen cell.
While hydrogen has particular safety issues that need to be considered, it is still a fuel just like petrol, diesel and LPG and if all precautions are taken it can be considered as similar risk to any other fuel source. For the purposes of this project the quantity of hydrogen produced will be very small.
Effects of thermal generator on the efficient operation of the catalytic convertor need to be carefully considered and compliance with emission control regulations maintained. Visible emissions may be produced if the exhaust gasses are reduced to a temperature below the condensation point of the 𝐻2𝑂 in the exhaust gasses. Careful consideration needs to be given as to how these can best be avoided or absorbed. This may not be an issue for individual vehicles moving at higher speed but numerous vehicles in slow traffic conditions may produce an excessive accumulation of visible steam vapor.
Heat and electrical wiring in close proximity may be a potential cause of electrical short circuit and fire hazard.
Risk associated with conducting this project can be considered as minimal as it is not anticipated that any component will be manufactured or tested.
1.1.3
Installation risk management plan
CE markings for hydrogen devices symbolize that the component conforms to the particular directive for the particular application. It is essential due to the nature of the device and public liability that a vehicle on board hydrogen generating device conforms to the prescribed
requirements. Hydrogen systems shall comply with the following directives in order to gain CE marking status.
Machinery directive; 98/37/EC
Equipment and protection systems intended for use in potentially explosive atmosphere; 94/9/EC
Pressure equipment directive; 97/23/EC
Low voltage directive; 73/23/EEC
Electromagnetic compatibility directive; 89/336/EEC
Simple pressure vessel directives; 87/404/EEC and 90/448/EC
1.1.3.1
Machinery directive summary 98/37/EC
The manufacturer has to assess the risks of its system in normal and abnormal uses, and during running and maintenance operations.
Materials and products shall not endanger exposed persons health and safety.
Machinery shall be designed so as to facilitate its safe handling, packaging and storage.
Control systems shall be safe and reliable.
Safety shall be taken into account.
o For the design, localization, signals of the control devices.
o For the starting, restarting and modification of the running.
o For the stopping procedures, normal and emergency.
Prescription given to ensure safety of device in case of power failure.
Moving parts and equipment shall be designed to avoid hazards. Where hazards persist adequate guards or protective devices shall be fitted.
1.1.3.2
Hydrogen generator design layout principles
Hydrogen generator to be located where there is minimum risk of hydrogen/air accumulation.
Appropriate insulation or shielding to minimize absorbing of heat to the device.
Appropriate control of hydrogen generator to ensure hydrogen generation only can occur during required operational conditions.
Appropriate instruments and warning devices to monitor generator correct operation.
Risk management chart based on anticipated hydrogen production of 0.5kg/hour
People at risk Risk level
General hydrogen storage and production in vehicle during normal use
Vehicle occupants low
Hydrogen during accident Vehicle occupants / pedestrians
low
Heat and electric wiring Vehicle occupants low Visible emissions Other vehicle operators low
Corrosion Vehicle occupants low
1.1.4
Timeline
Timeline for project completion.
Project allocation due11 March 2015
Project specifications due18 March 2015
Preliminary report submission date 03 June 2015.
Complete detailed solid model completed 30 August 2015
Heat simulation analysis on aluminum core completed 30 August 2015
Preparation for project presentation to peers 30 August 2015
Partial draft dissertation 16 September 2015
Chapter 2
Vehicle system energy waste
2.1
Introduction
Most vehicle system inefficiencies present themselves as wasted heat energy. The most noticeable of these are the waste heat from the vehicle exhaust and cooling systems. This project will focus primarily on the recycling of the wasted thermal energy from the exhaust system, however similar techniques could be applied to other areas of thermal heat loss to recycle the thermal energy. Other areas of significant thermal energy loss in a vehicle include:
2.1.1
Cooling systems
In a perfect world the engine cooling system would not be necessary. We would simply make our engines out of materials that produce minimal friction and have infinitely low thermal conductivity. Heat from combustion would not be able flow into our engine materials which would be good insulators and be able to withstand extreme temperatures without any component failure. Unfortunately despite extensive research in the application of ceramic materials in engine components design, at this present time engine material remain primarily Steel and Aluminum alloys. Steel and Aluminum alloys both have relatively high thermal conductivity and are susceptible to failure at extreme temperature. The only advantage of these materials being that they are readily available and easily cast into complex shapes. As a result the heat generated and dissipated in the cooling system is a direct result of component and material inefficiencies. As much as 30% of the available heat energy in the fuel is dissipated and wasted in the cooling system. In money term this is 30 cents in every dollar spent on fuel completely wasted. At this present moment in time no vehicle manufacturer has a production vehicle that recycles this wasted heat energy. The only major use of the cooling system heat has been to drive the vehicle cabin heating system.
2.1.2
Torque convertor
Table 1 Torque converter efficiency curve (JM clutches and converters)
Table 1 shows a typical torque converter efficiency vs rpm curve (JM clutches and converters). Most modern torque converters have a lock up clutch which lock the turbine and impellor together when they are at similar speeds or coupling point. This would only occur during cruising conditions. Under these conditions there is no slip and therefore 100% transfer of power and no heat generated other than due to component friction.
Most driving situations are not cruising and the torque convertor clutch is most often disengaged. The results of this slip is heat generated into the transmission fluid. How much heat depends on how much slip and turbulence is occurring during a specific driving situation. Some of the factors that affect the amount of heat generated, include towing, driving speed, climbing steep mountains or hills, wind effect and weight being carried. Overheating is the number one cause of failure in
automatic transmissions so controlling this heat generation is very critical to the life of the
transmission. A general figure of 15% average power loss through a torque converter is considered reasonable on current model vehicles. There are promising developments to reduce this heat loss to a negligible level rather than recycle the wasted thermal energy produced. A thermal generator using the wasted heat from a torque converter may only have an application as an aftermarket kit on an older type less efficient torque converter.
Older type automatic transmissions were only 3 speed units and relied on the slip of the torque converter to smoothen out the big jump between the gear ratios. Modern day automatic
transmissions have numerous gear ratio with 8 gears now standard on BMW and many other cars (ZF8HP). The closer the gear ratios, the less the need for torque converter slip. Torque converter designs are now moving towards being used to simply replace the conventional clutch. The torque converter will get the vehicle moving and the lock up clutch will engage shortly after that. The following is predicted by Middelman and Wagner (2010) of the Schaeffler group in there paper ‘Torque converters as a system’.
Number of gear ratios of automatic transmissions will continue to increase.
Additionally engine designs are moving to higher torque, lower rotational speeds and reduced number of cylinders in the never ending drive to improve fuel consumption. This results in higher torsional vibration excitation due to lower number of cylinders coupled with lower excitation frequencies. Higher turbocharging pressures with corresponding torque increase also lead to increased excitation amplitudes (Faust H, 2014). These factors lead to an increased dampening requirements on the torque convertor and lock up clutch assembly. Centrifugal pendulum type absorbers running in oil have been developed in recent years and facilitate early lock up even at very low engine speed (Faust H, 2014)
Thermal waste in torque converters could be reduced to a negligible level as the above mentioned technologies continue to improve.
2.1.3
Braking systems
When we purchase fuel for our vehicles we are effectively purchasing the heat that that fuel can produce. In other words the calorific value of the fuel is what is actually potentially useful to us. If we consider the calorific value of a fuel as 45 MJ/kg and lose 75% of that energy to the exhaust
system, cooling system and driveline. This leaves us with 11.25 MJ/kg of heat energy that we have actually managed to convert into kinetic energy. This kinetic energy of the vehicle has been
achieved by expensive complex components, and a process which is inherently inefficient. After all this hard work and effort to get the vehicle moving, if the we suddenly need to stop then a
conventional braking system simply converts this hard earned kinetic energy back to heat.
Obviously this is a fairly wasteful process and any form of recovery of this wasted energy would be beneficial.
Heat is a degraded form of energy and it is more difficult to convert to other forms of energy without large losses. Mechanical and electrical energy are “noble” forms of energy and it is theoretically possible to transfer one into the other without loss (Da Rosa, Aldo V, 2012, pp 92). Any braking system energy recovery system would therefore be much more efficient if it could convert the mechanical kinetic energy directly into electrical energy or another form of mechanical potential energy without having to go through any heat transfer process. In recent years many vehicle manufacturers have made commercially available regenerative braking systems for their vehicles. Development of this technology continues at a steady rate and regenerative braking systems could be standard features on vehicles shortly.
2.2
Thermodynamic fundamentals and energy quality
available to do useful work is also of a lesser quality even though the quantity is the same. Hence the second law of thermodynamic which states that processes occur in a certain directions and that energy has quality as well as quantity. This introduces the concept that not all energy transformation processes are reversible. Heat can only flow in the direction of the temperature gradient unless work is done to reverse the flow. The quality of energy is also degraded as the energy
transformation process occurs. Quantity of energy is always conserved but the quality of energy is not. Wasting energy is really the process of allowing energy to change to a less useful form without getting any work done. High quality thermal energy at high temperature has high work output potential and is more desirable than an abundance of low temp thermal energy. No thermodynamic process can occur unless it satisfies both the first and second law of thermodynamics.
Converting work into varies forms of energy is generally easily done, however converting varies forms of energy into work is often not as easy and particularly so for heat energy. For example it is possible to convert 100% of work energy into heat energy but the reverse is not possible. Heat engines of varies types are designed to convert heat energy into work. Although the operating principles and cycles may be different from one heat engine to the next, all heat engines receive heat from a high temperature source and convert part of this heat into work. The remaining waste heat is rejected to a low temperature sink. A portion of the work output of a heat engine is
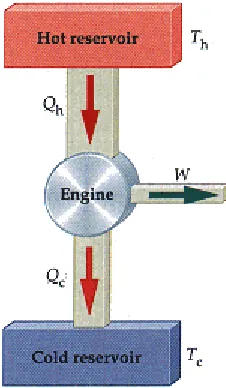
[image:23.595.243.356.446.640.2]consumed internally to maintain a continuous cycle of operation (Cengel, Boles, 2002, pp 249). The second law of thermodynamics can be expressed in varies statements. One of which is the Kelvin-Planck statement which states, “It is impossible for any device that operates on a cycle to receive heat from a single reservoir and produce a net output of work”. Heat engines that operate on a continuous cycle must exchange heat with a high temperature source and a low temperature sink. As a result of these physical limitations no heat engine can have a thermal efficiency of 100%, it is a necessary part of their operation that heat is always rejected to the environment.
Figure 1 Heat flow diagram (http://user.physics)
2.1
𝑷𝒆𝒓𝒇𝒐𝒓𝒎𝒂𝒏𝒄𝒆 = 𝑫𝒆𝒔𝒊𝒓𝒆𝒅 𝒐𝒖𝒕𝒑𝒖𝒕 𝑹𝒆𝒒𝒖𝒊𝒓𝒆𝒅 𝒊𝒏𝒑𝒖𝒕
2.2
𝑻𝒉𝒆𝒓𝒎𝒂𝒍 𝒆𝒇𝒇𝒊𝒄𝒊𝒆𝒏𝒄𝒚 =𝑵𝒆𝒕 𝒘𝒐𝒓𝒌 𝒐𝒖𝒕𝒑𝒖𝒕 𝑻𝒐𝒕𝒂𝒍 𝒉𝒆𝒂𝒕 𝒊𝒏𝒑𝒖𝒕
Letting
𝑄𝑖𝑛 = amount of heat absorbed during combustion (kJ). 𝑄𝑜𝑢𝑡 = amount of heat rejected (kJ).
𝑊𝑜𝑢𝑡 = work output (power output) (kJ).
𝑊𝑛𝑒𝑡 = work input required to complete cycle (compression) (kJ)
and
2.3
𝑾𝒏𝒆𝒕 = 𝑾𝒐𝒖𝒕 − 𝑾𝒊𝒏 kJ then
2.4
𝑻𝒉𝒆𝒓𝒎𝒂𝒍 𝒆𝒇𝒇𝒊𝒄𝒊𝒆𝒏𝒄𝒚 =𝑾𝒏𝒆𝒕 𝑸𝒊𝒏
2.3
Thermal efficiency of internal combustion engines
Heat engines operate on cycles where work is done on the working fluid during part of the cycle and work is done by the fluid in another part of the cycle. The difference between the two being the net work output (𝑊𝑛𝑒𝑡 equation 2.3). The cycle efficiency is maximised by having processes that require the least amount of 𝑊𝑖𝑛 and the maximum amount of 𝑊𝑜𝑢𝑡. Theoretically this could be achieved by having an engine that operates completely on reversible cycles. Reversible processes cannot be achieved in practice but only form a basis to establish a maximum possible theoretical upper limit with which to compare real engines.
The Carnot cycle is a completely reversible cycle first proposed by French engineer Sadi Carnot in 1824. The cycle consists of four reversible engine cycles two of which are adiabatic and the other two isothermal.
Figure 2 Carnot engine cycle (http://hyperphysics)
The first process (1-4) begins with the isothermal compression (compression at constant
temperature). During this stage heat is rejected from the working fluid as the fluid is compressed and work is done on the fluid. The second process (4-3) is adiabatic compression (no heat is allowed to leave the fluid) and the fluid temperature increases from 𝑇𝑐 to 𝑇ℎ. During process three (3-2) heat is added to the fluid and expansion occurs in an isothermal manner. Work is done by the fluid due to the heat addition. During process four (2-1) heat addition stops and expansion occurs in an adiabatic manner until temperature Tc is reached.
The end result is the pressure – volume (P-V) diagram show in figure 2. The work done by the cycle is the area enclosed by the four processes. The efficiency of the Carnot engine is therefore the maximum that a heat engine can achieve when operating between set temperature limits 𝑇ℎ and 𝑇𝑐.
2.5
𝑪𝒂𝒓𝒏𝒐𝒕 𝒆𝒇𝒇𝒊𝒄𝒊𝒆𝒏𝒄𝒚 = 𝟏 − 𝑻𝒄 𝑻𝒉
2.3.2
Otto cycle
The Carnot engine cycle represents the maximum efficiency that can be achieved by a heat engine. However this engine cycle has no real practical application as the cycle is extremely slow to
complete. Other engine cycles, such as the Otto cycle, are of more practical value even though they cannot achieve the same theoretical efficiency limits of the Carnot cycle.
The Otto cycle is the ideal cycle for a petrol fuelled reciprocating piston engine. The cycle was first proposed by Beau de Rochas in 1862. Nikolaus A. Otto successfully built the first conventional four stroke petrol engine in 1876 based on this cycle. In practical operation engine cycles are very complex to evaluate. To reduce the analysis to a manageable level, the following approximations are made, commonly known as air-standard assumptions:
The working fluid is air, which continuously circulates in a closed loop.
The air behaves as an ideal gas.
All processes in the cycle are internally reversible.
The combustion process is idealised as a heat addition process from an external source.
The exhaust process is replaced by a heat rejection process that restores the working air to the original temperature.
Figure 3 Idea Otto engine cycle (http://web.mit.edu)
exhaust valve opening and releasing the relatively high pressure and hot exhaust gases to
atmosphere through the exhaust pipe. The next two stoke of the piston are only necessary only for cylinder filling and scavenging. The exhaust stroke (1-5) occurs as the piston moves up the bore with the exhaust valve open pushing the exhaust gases out. The intake stroke (5-1) occurs as the piston moves back down the bore with the inlet valve open and allowing a fresh charge of air/fuel mixture into the engine. The work done during the cycle is the area enclosed in figure 3 by the process 1-2, 2-3, 3-4 and 4-1.
Given:
2.6
𝑸𝒊𝒏 = 𝑪𝒗(𝑻𝟑- 𝑻𝟐)
And
2.7
𝑸𝒐𝒖𝒕 = 𝑪𝒗(𝑻𝟒- 𝑻𝟏)
And
2.8
𝑻𝟏 𝑻𝟐
= (𝑽𝟐 𝑽𝟏
)𝒌−𝟏
Where 𝐶𝑣 is the specific heat capacity of air at 25℃ at constant volume, and 𝐶𝑝 is the specific heat capacity of air at 25 ℃ at constant pressure. 𝑘 is the ratio of specific heat capacities 𝐶𝑝
𝐶𝑣 .
2.9
𝑻𝒉𝒆𝒓𝒎𝒂𝒍 𝒆𝒇𝒇𝒊𝒄𝒊𝒆𝒏𝒄𝒚 (𝑶𝒕𝒕𝒐) =𝑾𝒏𝒆𝒕 𝑸𝒊𝒏
2.10
2.11
𝑻𝒉𝒆𝒓𝒎𝒂𝒍 𝒆𝒇𝒇𝒊𝒄𝒊𝒆𝒏𝒄𝒚 (𝑶𝒕𝒕𝒐) = 𝟏 − 𝟏 (𝑽𝑽𝟏
𝟐) 𝒌−𝟏
Letting 𝑉1
𝑉2 equal compression ratio (𝑟)
Then
2.12
𝑻𝒉𝒆𝒓𝒎𝒂𝒍 𝒆𝒇𝒇𝒊𝒄𝒊𝒆𝒏𝒄𝒚 (𝑶𝒕𝒕𝒐) = 𝟏 − 𝟏 (𝒓)𝒌−𝟏
Equation 2.12 shows that the thermal efficiency of an Otto cycle engine depends on the
compression ratio (𝑟) of the engine and the specific heat ratio of the working fluids (𝑘). The higher the compression ratio and the value of 𝑘 the greater the efficiency. In practical engines air is used as the working fluid so the value of 𝑘 is set to that of air. The compression ratio (𝑟) can be increased to improve the efficiency and therefore the power output however the compression ratio is also limited by the auto ignition point of the air-fuel mixture. A compression ratio of 12:1 will produce a theoretical maximum efficiency of 63%. This is the maximum possible efficiency that can be
achieved by an Otto cycle engine with a compression ratio of 12:1. This efficiency is well below that of the Carnot engine cycle which is based on the difference in temperature between the 𝑇3 and 𝑇1. The Otto cycle thermal efficiency of 63% with a compression ratio 12:1 represents the maximum possible efficiency for this engine under absolutely perfect idealised conditions. It can never be achieved in the real world. It does however give a theoretical target with which to compare real engines. Even if 63% thermal efficiency were achieved this would still mean that 37% of our initial input heat energy would have to be discharged to the environment as thermal waste.
We conclude that every heat engine must waste some heat energy (𝑄𝑜𝑢𝑡) by transferring it to a low temperature heat sink in order to compete the engine cycle (figure1). The quality of this rejected heat energy is also of a lower value due to it being at a much lower temperature. This thermal energy is a necessary waste product of our engine cycle. It is important to note that the heat rejected by an engines radiator is heat generated from component and material inefficiencies. The heat rejected by the exhaust system is the thermal waste that is necessary to complete the engine cycle.
Chapter 3
Thermoelectric technology
3.1
Introduction
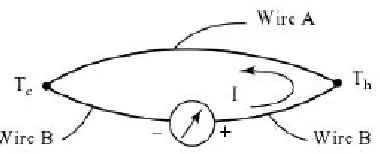
[image:30.595.204.394.342.419.2]Thermoelectric technology is the study of devices that can convert thermal energy directly into electric energy or visa versa. In 1821 Thomas J.Seebeck discovered that an electromotive force could be generated from a circuit of two dissimilar wires when one of the junctions were heated as shown in Figure 4. This is called the Seebeck effect. This principle, also called a thermocouple, is used extensively in temperature sensor technology.
Figure 4 Thermocouple (Lee, Ho Sung, 2010)
The potential difference produced across the junction is proportional to the temperature difference between the hot (𝑇ℎ) and cold (𝑇𝑐) junctions.
3.1
𝑽 = 𝜶∆𝑻
Where ∆𝑇 = 𝑇ℎ - 𝑇𝑐 and 𝛼 is called the Seebeck coefficient or thermopower.
While Seebeck was the first to notice the Seebeck effect much work was done at a later stage by Jean Peltier and William Thomson to define the physics of thermoelectricity. Thermoelectric effects consist of three effects: Seebeck effect, Peltier effect and the Thomson effect. Although the
reliable than any other heat to electric conversion techniques. This high reliability has seen
favorable applications in areas such as industrial instrumentation, military, medical, aerospace and portable or remote power generation.
In recent years with increasing concern regarding environmental issues, extensive research into nonconventional technologies of converting heat into electricity have been accelerated.
Thermoelectric power generation has emerged as a promising technology to this end. Particularly in the area of converting low quality waste heat energy directly into electricity. When the heat energy used to drive a thermal generator is wasted or readily available, it is in fact free. The fact that the energy conversion process efficiency is very low becomes less of an issue. If the fuel/heat source were very expensive then this low efficiency process would not be ideal. These factors make thermal generation an ideal process for converting the unavoidable waste thermal energy from a heat engine into electricity or even another fuel source to be consumed by the engine, thereby increasing the overall efficiency of the engine cycle.
3.2
Thermoelectric Generator (TEG)
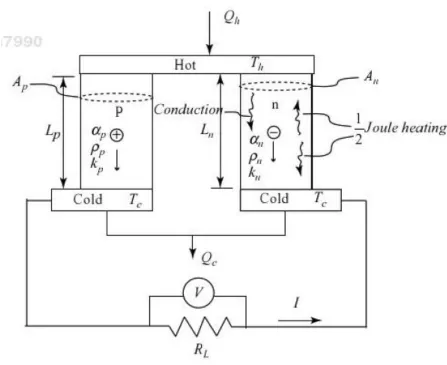
A thermoelectric generator is a power generator without moving parts. It is silent in operation and relatively reliable. The thermoelectric module consists of p-type and n-type semiconductor materials connected as shown in Figure 5. The semiconductor elements are connected thermally in parallel and electrically in series. The p and n elements may be of similar or dissimilar materials. The performance of thermoelectric devices is measured by a figure of merit (𝑍) for which the units are 1/℃.
3.2
𝒁 = 𝜶 𝟐 𝝆𝒌
where 𝛼 = Seebeck coefficient, 𝑉/℃
𝜌 = electrical resistivity, Ohm.cm
Figure 5 Thermoelectric couple with dissimilar p and n elements (Lee, Ho Sung, 2010)
A high figure of merit (𝑍) is desirable for high performance and efficiency. A high Seebeck coefficient, low thermal conductivity and low electrical resistivity are needed to achieve this. Reducing thermal conductivity will not benefit the heat flow through the materials therefore it is preferable to rather reduce electrical resistivity as much as possible and maximize the Seebeck coefficient. Table 3 show some values of the figure of merit (𝑍) for some popular semiconductor materials. Bithmuth telluride (𝐵𝑖2𝑇𝑒3) and its alloys are widely used for thermoelectric cooling (TEC), while Lead telluride (𝑃𝑏𝑇𝑒) is commonly used for thermoelectric generators (TEG) (Lee, Ho Sung, 2010, pp 105). A dimensionless figure of merit (𝑍𝑇𝑎𝑣𝑒) is also commonly used with 𝑇𝑎𝑣𝑒 being the average temperature of the hot and cold junction.
The p and n junction as shown in Figure 5 can be manufactured of similar or dissimilar materials. It is customary to use similar materials on a particular thermocouple, however most commercially available thermocouples are of dissimilar materials in an effort to maximize the figure of merit (𝑍) (Lee, Ho Sung, 2010, pp. 106).
Value of Seebeck coefficient (𝛼), electrical resistivity (𝜌) and thermal conductivity (𝑘) for the
combined p and n semiconductor material are obtained as follow
3.3. a
𝜶 = 𝜶̅̅̅̅ − 𝜶𝒑 ̅̅̅̅ 𝒏
3.3 b
𝝆 = 𝝆̅̅̅̅ + 𝝆𝒑 ̅̅̅̅ 𝒏
3.3 c
𝒌 = 𝒌̅̅̅̅ + 𝒌𝒑 ̅̅̅̅𝒏
For similar materials
3.4 a
𝜶𝒑 ≈ 𝜶𝒏
3.4 b
𝝆𝒑 ≈ 𝝆𝒏
3.4 b
𝒌𝒑 ≈ 𝒌𝒏
For dissimilar materials the material figure of merit (𝑍) for an optimum geometry is calculated using the following equations. For similar materials equation 3.2 applies.
3.5
𝒁 = (𝜶𝒑− 𝜶𝒏) 𝟐 [(𝒌𝒑𝝆𝒑)
𝟏 𝟐+ (𝒌
𝒏𝝆𝒏) 𝟏 𝟐 ]
𝟐
or
3.5 a
where
3.5 b
𝑲𝑹 = [(𝒌𝒑𝝆𝒑) 𝟏 𝟐+ (𝒌
𝒏𝝆𝒏) 𝟏 𝟐 ]
𝟐
Where 𝑅 is the overall internal electrical resistance of the p and n elements and 𝐾 is the overall thermal conductance.
3.5 c
𝑲 = 𝒌𝑨 𝑳
And for dissimilar materials
3.5 d
𝑲 = 𝒌𝒑𝑨𝒑 𝑳𝒑
+𝒌𝒏𝑨𝒏 𝑳𝒏
3.5 e
𝑹 = 𝝆𝑳 𝑨
3.5 d
𝑹 = 𝝆𝒑𝑳𝒑 𝑨𝒑
+ 𝝆𝒏𝑳𝒏 𝑨𝒏
For optimum geometry the following relationships apply.
3.5 c
𝑲𝑹 = (𝒌𝒑𝑨𝒑 𝑳𝒑
+ 𝒌𝒏𝑨𝒏 𝑳𝒏
) (𝝆𝒑𝑳𝒑 𝑨𝒑
+ 𝝆𝒏𝑳𝒏 𝑨𝒏
)
And
3.5 d
𝑳𝒏/𝑨𝒏 𝑳𝒑/𝑨𝒑
= (𝝆𝒑𝒌𝒏 𝝆𝒏𝒌𝒑 )
3.2.1
Conversion efficiency
Equations 3.5 and 3.5d are useful in the design of thermoelectric coupling for both the selection of materials to maximize 𝑍 and obtain the optimum geometries of the dissimilar p and n junction semiconductor material (Lee, Ho Sung, 2010, pp. 106). Similar materials have the same base material and therefore the same geometries in the p and n junctions. The analysis is simplified as 𝐿𝑝= 𝐿𝑛 and 𝐴𝑝= 𝐴𝑛. Additionally the heat flow into the hot junction is made up of three
components: the heat associated with the Seebeck effect, the half of joule heating and thermal conduction. As a result the heat flow into the hot junction is defined by equation 3.6.
3.6
𝑸𝒉 = 𝜶𝑻𝒉𝑰 − 𝟎. 𝟓𝑰𝟐𝑹 + 𝑲(𝑻𝒉+ 𝑻𝒄)
Where 𝐼 is the current flow through the hot junction as shown in Figure 6. The power generated across the load is given by:
3.6 a
𝑾 = 𝑰𝟐𝑹 𝑳
The conversion efficiency of the thermal generator is given by:
3.6 b
ɳ𝒕 = 𝑾 𝑸𝒉
Heat rejected at cold junction from first law of thermodynamics:
3.6 c
Figure 6 Thermoelectric generator (Lee, Ho Sung, 2010)
The open circuit voltage is given by Ohms law:
3.7
𝑽𝒐𝒄= 𝑰(𝑹𝑳+ 𝑹) and equation 3.1
𝑽 = 𝜶∆𝑻
Combining equation 3.7 and 3.1 to obtain an equation for the current flow (𝐼).
3.7 a
𝑰 = 𝜶∆𝑻 (𝑹𝑳+ 𝑹)
3.8
ɳ𝒕=
𝑹𝑳 𝑹 (𝟏 −
𝑻𝒄 𝑻𝒉) (𝟏 + 𝑹𝑹 ) − 𝟎. 𝟓 (𝟏 − 𝑳 𝑻𝑻𝒄
𝒉) + 𝟏
𝟐𝒁𝑻̅ (𝟏 + 𝑹𝑳
𝑹 ) 𝟐
(𝟏 + 𝑻𝑻𝒄 𝒉)
From equation 3.8 it can be seen that the conversion efficiency is a function of three dimensionless values namely 𝑅𝐿/𝑅, 𝑍𝑇̅ and 𝑇𝑐/𝑇ℎ. To obtain the maximum conversion efficiency, equation 3.8 is differentiated with respect to 𝑅𝐿/𝑅, and the derivative set to zero. This yields the optimum 𝑅𝐿/𝑅 ratio for maximum conversion efficiency.
3.8 a
𝑹𝑳
𝑹 = (𝟏 + 𝒁𝑻̅) 𝟏 𝟐
Similarly differentiating power equation 3.6a with respect to 𝑅𝐿/𝑅 and setting the derivative to zero yield the 𝑅𝐿/𝑅 ratio of 1 for maximum power conversion.
3.8 b
𝑹𝑳= 𝑹
Substituting these valves back into the equation 3.8 yield an equation for maximum efficiency.
3.8 c
ɳ𝒎𝒂𝒙 𝒆𝒇𝒇𝒊𝒄𝒊𝒆𝒏𝒄𝒚=
(𝟏 − 𝑻𝑻𝒄
𝒉) (𝟏 + 𝒁𝑻̅) 𝟏 𝟐− 𝟏 (𝟏 + 𝒁𝑻̅)𝟏𝟐+ 𝑻𝒄
𝑻𝒉 and maximum power
3.8 d
ɳ𝒎𝒂𝒙 𝒑𝒐𝒘𝒆𝒓=
(𝟏 − 𝑻𝑻𝒄 𝒉) 𝟐
𝒁𝑻̅ (𝟏 + 𝑻𝒄
𝑻𝒉) + 𝟐 − 𝟏 𝟐 (𝟏 −
3.2.2
Maximum performance parameters
The performance parameters ratios are the ratios of the actual performance compared the maximum performance. These values are important in thermocouple design and component selection. The values of obvious interest are power, volt and amps. It can also be noted from equation 3.8 that the only externally controllable dimension is the 𝑅𝐿/𝑅 ratio. The other two
dimensions being the 𝑍 value and the temperature of the hot and cold junction. The 𝑍 value being a function of the semiconductor material and the temperature gradient being set by the external environment. The performance of thermoelectric generators is therefore heavily dependent on the load resistance (𝑅𝐿), the internal resistance (𝑅) being a property of the semiconductor material and the module geometry. The performance parameters of power, voltage and amps are plotted in Table 4. The value of 𝑍𝑇̅ and 𝑇𝑐/𝑇ℎ in equation 3.8 being set to 1 and 0.5 respectively.
Maximum power ratio with 𝑍𝑇̅ = 1 and 𝑇𝑐/𝑇ℎ = 0.5
3.9
𝑾 𝑾𝒎𝒂𝒙
= 𝟒 𝑹𝑳
𝑹
(𝑹𝑹 + 𝟏)𝑳 𝟐
Maximum current ratio with 𝑍𝑇̅ = 1 and 𝑇𝑐/𝑇ℎ = 0.5
3.9 a
𝑰 𝑰𝒎𝒂𝒙
= 𝑹 𝟏 𝑳 𝑹 + 𝟏
Maximum current ratio with 𝑍𝑇̅ = 1 and 𝑇𝑐/𝑇ℎ = 0.5
3.9 b 𝑽 𝑽𝒎𝒂𝒙 = 𝑹𝑳 𝑹 𝑹𝑳
Table 4 TEG characteristics chart with 𝑍𝑇̅ = 1 and 𝑇𝑐/𝑇ℎ = 0.5 (Lee, Ho Sung, 2010).
As shown in Table 4 the performance of thermoelectric generators vary greatly with load resistance. It is therefore critical to arrange the load resistance sensibly to achieve optimum performance. Optimum performance can be considered to be between maximum power and maximum conversion efficiency points. In the case of Table 4 this would mean a 𝑅𝐿/𝑅 ratio between 1 and 1.414.
Some interesting observation from Table 4 are that the maximum power occurs at 𝑅𝐿/𝑅 = 1. This is exactly as predicted by equation 3.8b. This is also the point at which the 𝑉/𝑉𝑚𝑎𝑥 and the 𝐼/𝐼𝑚𝑎𝑥 curves intersect. Table 5 shows the variation in the maximum conversion efficiency point and
Table 5 Maximum conversion efficiency and maximum power efficiency (Lee, Ho Sung, 2010).
3.2.3
Thermal and Electrical contact resistances for TEG
[image:40.595.88.534.117.436.2]In the design of real thermoelectric devices consideration must be made for the thermal and electrical resistances of the component junctions.
Figure 7 shows the configuration of a practical thermoelectric couple where n-type and p-type thermoelements are connected in series by highly conductive metal strips. The thermocouples are connected electrically in series and thermally in parallel between thermally conducting but
electrically insulating ceramic plates. In the equations presented so far the electrical and thermal resistances have been neglected as they are relatively small. However in the design and selection of practical thermoelectric generator (TEG) they would need to be considered.
The following is an overview of the equations used and basic derivation. The equations used are as presented by Lee Ho Sung 2010.
Heat flowing in the hot junction is given by:
3.10
𝑸𝟏 = 𝑨𝒌𝒄
𝒍𝒄
(𝑻𝟏− 𝑻𝟏𝒄) and
3.11
𝑸𝟏 = 𝜶𝑰𝑻𝟏𝒄− 𝟏 𝟐𝑰
𝟐𝑹 + 𝑨𝒌
𝒍 (𝑻𝟏𝒄− 𝑻𝟐𝒄)
Heat flowing out of cold junction is given by:
3.12
𝑸𝟐 = 𝑨𝒌𝒄
𝒍𝒄
(𝑻𝟐𝒄− 𝑻𝟐) and
3.13
𝑸𝟐 = 𝜶𝑰𝑻𝟐𝒄− 𝟏 𝟐𝑰
𝟐𝑹 + 𝑨𝒌
𝒍 (𝑻𝟏𝒄− 𝑻𝟐𝒄)
where
𝛼 = 𝛼𝑝− 𝛼𝑛 Seebeck coefficient of thermoelements. 𝑘 = 𝑘𝑝+ 𝑘𝑛 Thermal conductivity of the thermoelements.
𝑘𝑐 is the thermal contact conductivity of both the ceramic plates and the contact thermal contacts. 𝑙 is the thermoelement length.
The overall electrical resistance of a thermocouple (𝑅) is made up of the resistance of the thermocouple material (𝑅𝑚) and the resistance over the electrical strip and contacts(𝑅𝑐).
3.14
𝑹 = 𝑹𝒎+ 𝑹𝒄= 𝝆𝒍
𝑨 + 𝝆𝒄
𝑨 = 𝝆𝒍
𝑨(𝟏 + 𝝆𝒄 𝝆𝒍 ) =
𝝆𝒍 𝑨 (𝟏 +
𝒔 𝒍 )
Therefore,
3.15
𝑹 = 𝑹𝒎 (𝟏 + 𝒔 𝒍)
where
𝜌 = 𝜌𝑝+ 𝜌𝑛 Electrical material resistivity. 𝜌𝑐 Electrical contact resistivity. 𝑠 = 𝜌𝑐
𝜌
𝑅 = 𝜌𝑙 𝐴
By substituting equations 3.10 to 3.15 into each other and applying appropriate algebra a
relationship is developed between the real and ideal temperature differences (Lee, Ho Sung, 2010, pp. 154). Additionally maximum power (𝑅𝑙= 𝑅) is assumed which produces an equation for
current(𝐼), power (𝑊𝑛) and volts (𝑉𝑛) in terms of real temperature and thermal/electrical resistance. 3.16
𝑰 = 𝑨𝜶(𝑻𝟏− 𝑻𝟐) 𝟐𝝆𝒍 (𝟏 + 𝒔𝒍) (𝟏 + 𝟑𝒓𝒍𝒍𝒄) where
𝑟 = 𝑘 𝑘𝑐 and
3.17
𝑾𝒏=
𝒏𝑨𝜶𝟐(𝑻𝟏− 𝑻𝟐)𝟐 𝟒𝝆𝒍 (𝟏 +𝒔𝒍) (𝟏 + 𝟑𝒓𝒍𝒍𝒄)
𝟐
3.18
𝑽𝒏=
𝒏𝜶(𝑻𝟏− 𝑻𝟐) 𝟐 (𝟏 + 𝟑𝒓𝒍𝒍𝒄) and
3.19
ɳ𝒓𝒆𝒂𝒍=
𝟏 −𝑻𝑻𝟐 𝟏 𝟐
𝒁𝑻𝒂𝒗𝒆(𝟏 + 𝑻𝟐 𝑻𝟏) (𝟏 +
𝒔
𝒍) (𝟏 + 𝟑𝒓 𝒍𝒄
𝒍) + 𝟐 (𝟏 + 𝟑𝒓 𝒍𝒄
𝒍) 𝑻𝟏𝒄
𝑻𝟏 − 𝟏 𝟐 (𝟏 −
𝑻𝟐 𝑻𝟏)
and as 𝑟 → 0 and 𝑠 → 0 so ɳ𝒓𝒆𝒂𝒍→ ɳ𝒎𝒂𝒙 𝒑𝒐𝒘𝒆𝒓
3.20
ɳ𝒎𝒂𝒙 𝒑𝒐𝒘𝒆𝒓=
(𝟏 − 𝑻𝑻𝒄 𝒉) 𝟐
𝒁𝑻̅ (𝟏 + 𝑻𝒄
𝑻𝒉) + 𝟐 − 𝟏 𝟐 (𝟏 −
𝑻𝒄 𝑻𝒉)
The effects of the thermal and electrical contact resistances are shown in Figure 8 below. As can be seen that the power output and the conversion efficiency are dependent on the thermoelement length. Long thermoelement lengths result in higher conversion efficiency where shorter thermoelements result in higher power per unit area. As a result optimal design of a particular thermoelement is a compromise between high efficiency and large power outputs. The main objectives of thermoelectric module design is to determine a set of design parameters which best meet the specifications at minimal costs.
The design theory’s and equations presented so far form a useful understanding of the operation and design of a thermoelectric module. It is not practical in most situations to design a
thermoelectric module specifically for a particular application. Unless of course it is intended that there are going to be a very significant number of units manufactured to offset this initial specific design cost. In most situations, especially initially, the process would be to best select what is commercially available to suit the application. For commercially available thermoelectric modules appropriate values of contact resistance are 𝑠~0.1 and 𝑟~0.2.
The theoretical work presented in this report based mainly on Lee, Ho Sung, 2010, Thermal design shows good agreement with the experimental work conducted by DM. Rowe, G.Min, 1998,
Chapter 4
Exhaust waste heat thermal generator
4.1
Introduction
Thermal waste is an unavoidable consequence of operating a heat engine. This thermal waste can be found in the cooling system, which is a direct result of component and material inefficiencies or dumped into the exhaust system which is a requirement of operating on an engine cycle. The thermal waste is a major component of the available thermal energy. Average efficiencies of a conventional heat engine are in the range of 25 to 35%. This leaves a large amount of wasted thermal energy (75%) which is divided up approximately evenly between the exhaust system and the cooling system. Up until fairly recently this wasted thermal energy has been completely ignored because of its lower quality and potential to do further work. Thermal generator technology may not have been available or refined to a useable level to be able to use this wasted heat. Recent
developments in nanotechnology have made thermal electric generators (TEG) a viable method of extracting some use out of this wasted resource. Although the efficiencies of TEG are relatively low at this stage, they appear to be hugely underutilized and it is expected that this technology will become more and more common.
[image:45.595.204.391.495.638.2]This project is aiming specifically at designing a thermal generator that uses the hot exhaust gases to generate electrical power. The principles and theory used are in no way limited to hot exhaust gases. The project could have been just as easily about designing a radiator that can generate electrical power.
Figure 9 45 Watt liquid to liquid TEG operating on DT 115℃ (http://espressomilkcooler.com/about/)
4.2
Exhaust gas thermal generator
In designing a thermal generator to be placed in a modern vehicle exhaust system some factors need to be considered to ensure that the new component does not interfere with any current vehicle systems. One of the main components in a vehicle exhaust system is the catalytic convertor. A modern day catalytic convertor consists of two stages namely a reduction catalyst and an oxidation catalyst. The reduction catalyst is the first stage of the catalytic convertor and in this section the oxides of nitrogen 𝑁𝑂𝑥 are broken up into their core components of Oxygen (02) and Nitrogen(𝑁2). This occurs by a reaction between Platinum, Rhodium and heat. In the second stage the unburnt hydrocarbon fuel (𝐻𝐶) and partially burnt carbon-monoxide(𝐶𝑂) are oxidized with the oxygen that was released in the first stage. Platinum, Palladium and heat are required for the second stage to complete the reaction.
The important factors to consider are that a catalytic convertor needs heat and a certain
temperature range to operate efficiently. Additionally the downstream temperature of a correctly operating catalytic convertor is marginally higher than the upstream temperature due to the oxidation that occurs in the second stage. It would therefore make sense to place a thermal generator device immediately downstream of a catalytic convertor. Catalytic convertors are placed as close to the exhaust manifold as possible to ensure that they reach there operating (light up) temperature as soon as possible. These factors work in well with the fact that a thermal generator will work better the hotter the exhaust gasses are. Additional efficiency could also be achieved by heat wrapping the exhaust manifolds or treating them with some sort of ceramic coating. The aim of the wrap or coating would be to minimize the heat loss of the exhaust gasses in the engine bay prior to arrival at the catalytic convertor. This should reduce catalytic convertor warm up time and
improve thermal generator ∆𝑇. Conventional exhaust systems are designed to dissipate as much heat as possible from the exhaust gasses prior to discharging to atmosphere. In the case of an exhaust gas thermal generator this would not be the case. It would be preferred to insulate the exhaust gasses upstream of the generator and extract as much heat as possible as the gasses flow through the generator.
Insulation of the exhaust gasses as they leave the engine could potentially cause overheating problems for the catalytic convertor. Early model catalytic convertors were susceptible to
overheating issues and degradation due to high temperatures and thermal cycling with time. In latter model engines the catalytic convertor is no longer the limiting factor in exhaust gas temperature control but rather the exhaust valve and exhaust port materials (McDonald and Jones, 2000). If an exhaust system were to be insulated upstream of the TEG to maximize the temperature of the exhaust gasses entering the TEG then the effects of this on the catalytic convertor needs to be carefully considered.
Figure 10 (McDonald & Jones, 2000) shows a typical exhaust gas temperature range for a petrol engine. The data presented formed part of the work by McDonald and Jones into the factors effecting the life cycle of a catalytic convertor. It can be seen that a reasonable temperature range for exhaust gas downstream of the catalytic convertor is in the range of 300℃ to 750℃.
of the catalytic convertor due to the after burn effect of the oxidation section of the catalytic convertor.
If the heat exchanger units operate as efficiently as hoped and expected then the exhaust gasses could be cooled to a temperature below the boiling point of 𝐻2𝑂. This would mean that the latent heat of the vaporization could be utilized to enhance the efficiency of the system. 𝐻2𝑂, which is a major component of exhaust gasses, would no longer be discharged to atmosphere as superheated steam but as water particle and steam vapor. This may give rise to other issues related to visible emissions which would need to be considered.
Figure 10 Exhaust gas temperature chart for Ford Explorer (McDonald & Jones, 2000)
4.2.1
TEG component selection
A unique new class of thermoelectric module is now available through Thermal Electronics
Corporation which could be used in the design of an exhaust system thermal generator. The module is a BiTe-PbTe hybrid (TEG1-PB-12611-6.0). The module features two optimized thermoelectric semi-conductors of N-type material and P-type material to form a hybrid thermoelectric generator module of improved performance and temperature stability. The modules are designed with high temperature bonding materials that allow them to withstand temperatures of up to 360°C. As long as the TEG thermoelectric power module is placed into a system, whereby the hot side is at a higher temperature than the cold side, DC power will be produced. The TEG1-PB class of module is able to operate continuously in higher temperatures than traditional thermoelectric power modules made from BiTe material only. The ceramic surfaces are covered with graphite sheets, which displaces the need for thermal grease. These novel TEG modules work best in the 200°C to 360°C temperature range and offer superior power output at temperatures above 260°C on the hot side, compared to standard BiTe modules. The P and N-type semi-conductors used in these new hybrid TEG modules offer the best performance and cost efficiencies of any module commercially
available (Thermal Electronics Corporation).
Table 6 Performance specifications (Thermal Electronics Corporation)
Module TEG1-PB-12611-6.0
Hot side temperature (℃) 350 Cold side temperature (℃) 30 Matched load resistance (𝛺) 0.97 Matched load voltage (𝑉) 4.6 Matched load current (𝐴) 4.7 Matched load power (𝑊) 21.7 Heat flow across module (𝑊) ≈310 Heat flow density (𝑊 𝑐𝑚−2) ≈9.88
Life expectancy 14 years
@ 280℃
12 years @ 320℃
Figure 11 Hybrid TEG1-PB-12611-6.0 module (Thermal Electronics Corporation)
Figure 13 TEG1-PB-12611-6.0 module performance parameters (Thermal Electronics Corporation)
4.2.2
Exhaust gas thermal generator configuration and performance
The thermal generators are mounted on the hot source of dimensions 112 × 112 × 504 mm. On each flat surface there would be 2 rows of 9 thermal generators. All thermal generators in the row are connected in series and then in parallel with all other rows.
Overall voltage of each row 𝟒. 𝟔 × 𝟗 = 𝟒𝟏. 𝟒 𝒗𝒐𝒍𝒕𝒔
Overall amperage of rows connected in parallel 𝟒. 𝟕 × 𝟖 = 𝟑𝟕. 𝟔 𝒂𝒎𝒑𝒔
Net power output 𝟒𝟏. 𝟒 × 𝟑𝟕. 𝟓 = 𝟏𝟓𝟓𝟐 𝒘𝒂𝒕𝒕𝒔
Heat flow across each module 𝟑𝟏𝟎 𝒘𝒂𝒕𝒕𝒔
Total heat flow on hot side 𝟑𝟏𝟎 × 𝟗 × 𝟖 = 𝟐𝟐𝟑𝟐𝟎 𝒘𝒂𝒕𝒕𝒔
From equation 3.6b
ɳ𝒕 = 𝑾 𝑸𝒉
ɳ𝒕= 𝟏𝟓𝟓𝟐 𝟐𝟐𝟑𝟐𝟎
𝑻𝒉𝒆𝒓𝒎𝒂𝒍 𝒆𝒇𝒇𝒊𝒄𝒊𝒆𝒏𝒄𝒚 = 𝟕%
Total heat flow on cold side from equation 3.6c
𝑸𝒄= 𝑸𝒉− 𝑾
𝑸𝒄 = 𝟐𝟐𝟑𝟐𝟎 − 𝟏𝟓𝟓𝟐
4.2.3
Hot source heat exchanger design
The hot side heat exchanger core consists of an Aluminum block of dimensions 112 × 112 × 504 mm. 25 holes of 10 mm diameter are drilled through the 504 mm length. Through these holes the engine exhaust gases will flow. Aluminum is the material recommended by Thermal Electronics Corporation for applications up to 400℃. The low weight and excellent thermal conductivity of Aluminum together with an acceptable melting point of 660℃ make Aluminum suitable material for this application.
The square shape of the heat exchanger core is necessary mainly because all available thermal generators are made flat and need to go on a flat surface. The main objective is to maximize the surface area contact with the thermal generators, and the square shape does that best, without having to resort to fins. The 25 holes of 10 mm diameter serve to maximize the area of contact between hot exhaust gases and the heat exchanger core.
The total area of the heat exchanger core in contact with thermal generators is 0.2258 𝑚2. The total area of the exhaust gases in contact with the heat exchanger core is 0.396 𝑚2.
Figure 14 Heat exchanger aluminum core
Figure 15 Thermal generator
4.2.4
Cold sink heat exchanger design
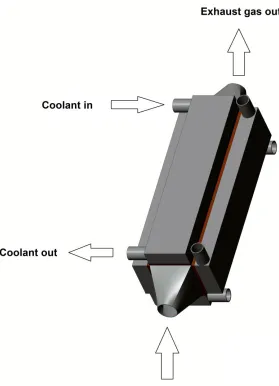
4.2.5 Thermal Generator design proposal
[image:55.595.103.382.161.547.2]The proposed prototype thermal generator layout is shown in figure 17.
4.3
Thermal Analysis
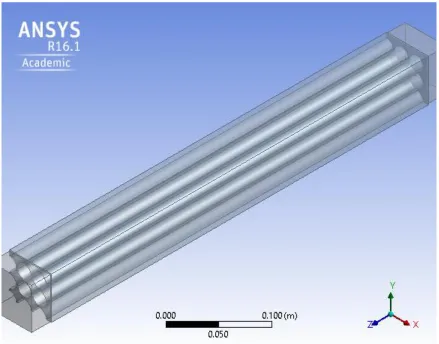
A basic thermal analysis was conducted on the proposed TEG design using ANSYS 16.1 Academic Edition. The model was simplified with two plains of symmetry and substitution of the coolant
[image:56.595.79.518.224.568.2]cooling tubes and thermal electric generators by an equivalent convection cooling coefficient.
Figure 19 Fluid domain of model with 2 planes of symmetry
4.3.1 Simulation operating conditions
The exhaust gas mass flow rate, exhaust gas temperature and temperature difference between the hot and cold side of the thermal electric generator are key variables which are dependent on the engine size, configuration and operating conditions. Exhaust gas is a mixture of multiple gas
Table 7 Typical engine operating conditions based on 1200cc engine
Driving cycle Exhaust gas (g/s) Exhaust gas temperature (K)
Urban 5.7 573.15
Suburban 14.4 673.15
Maximum power 80.1 873.15
4.3.2
Theory and boundary conditions
The computing domain consists of both solid and fluid portions. The temperature and flow fields of interest are obtained by solving a set of mathematical equations with respect to computational fluid and solid domains. In the fluid domain the equations of mass, momentum and energy conservation are solved to model fluid flow, heat and mass transfer. For the solid domain only the equation of heat transfer is solved.
Continuity equation:
𝝏𝝆
𝝏𝒕
+ 𝛁. (𝝆𝑼) = 𝟎
Momentum equation:
𝝏(𝝆𝑼)
𝝏𝒕
+ 𝛁(𝝆𝑼𝑼) = −𝛁𝒑 + 𝛁𝝉 + 𝑺
𝑴Energy equation:
𝝏(𝝆𝒉
𝒕𝒐𝒕)
𝝏𝒕
−
𝝏𝒑
𝝏𝒕
+ 𝛁(𝝆𝑼𝒉
𝒕𝒐𝒕) = 𝛁(𝝀𝛁𝑻) + 𝛁(𝑼𝝉) + 𝑼𝑺
𝑴+ 𝑺
𝑬𝝏(𝝆𝑯)
𝝏𝒕
+ 𝛁(𝛒𝑼
𝒔𝒉) = 𝛁(𝝀𝛁𝑻) + 𝑺
𝑬Where:
𝜌 = density
𝜏 = stress tensor
𝜆 = Thermal conductivity of solid
𝑈 = velocity
At exhaust gas pressure of atmospheric and temperatures of 600 ℃ the speed of sound is 515 m/s. This is much greater than the flow velocity. The flow field can therefore be considered as
incompressible. The 𝑘-epsilon turbulence model was used to simulate the exhaust gas flow as it is the industrial standard for many commercial CFD models. Exhaust gas inlet velocity and
temperature was set to the value of the respective driving cycles as shown in Table 7.
4.3.3
Model setup parameters
Table 8 Simulation model setup parameter
Material Type
Fluid Nitrogen 𝑁2
Solid Aluminum T6061
Velocity (m/s) Temperature (K) Pressure (Gauge) pa
Urban 4.87 573.15 0
Suburban 14.4 673.15 0
Maximum power 100.23 873.15 0
Urban cycle
[image:60.595.50.532.70.410.2]Figure 20 Temperature of hot side of TEG on urban cycle
Table 9 Output values on urban cycle
TEG hot side average temperature 339 K
Outlet gas temperature 467 K
Heat flow out of cooling surface 1302 w
Suburban cycle
[image:62.595.52.531.82.403.2]Figure 22 Temperature of hot side of TEG on suburban cycle
Table 10 Output values on suburban cycle
TEG hot side average temperature 407 K
Outlet gas temperature 543 K
Heat flow out of cooling surface 3210 w