Environmental Sensor Networks:
A revolution in the earth system science?
Jane K. Hart
a,⁎
, Kirk Martinez
b,1a
School of Geography, University of Southampton, SO17 1BJ, UK
bSchool of Electronics and Computer Science, University of Southampton, Southampton, SO17 1BJ, UK
Received 10 March 2005; accepted 8 May 2006 Available online 7 July 2006
Abstract
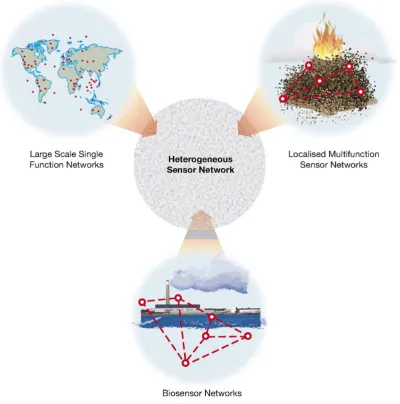
Environmental Sensor Networks (ESNs) facilitate the study of fundamental processes and the development of hazard response systems. They have evolved from passive logging systems that require manual downloading, into‘intelligent’sensor networks that comprise a network of automatic sensor nodes and communications systems which actively communicate their data to a Sensor Network Server (SNS) where these data can be integrated with other environmental datasets. The sensor nodes can be fixed or mobile and range in scale appropriate to the environment being sensed. ESNs range in scale and function and we have reviewed over 50 representative examples.Large Scale Single Function Networkstend to use large single purpose nodes to cover a wide geographical area.Localised Multifunction Sensor Networkstypically monitor a small area in more detail, often with wireless ad-hoc systems.Biosensor Networksuse emerging biotechnologies to monitor environmental processes as well as developing proxies for immediate use. In the future, sensor networks will integrate these three elements (Heterogeneous Sensor Networks). The communications system and data storage and integration (cyberinfrastructure) aspects of ESNs are discussed, along with current challenges which need to be addressed. We argue that Environmental Sensor Networks will become a standard research tool for future Earth System and Environmental Science. Not only do they provide a‘virtual’connection with the environment, they allow new field and conceptual approaches to the study of environmental processes to be developed. We suggest that although technological advances have facilitated these changes, it is vital that Earth Systems and Environmental Scientists utilise them. © 2006 Elsevier B.V. All rights reserved.
Keywords:wireless sensor networks; environmental monitoring; cyberinfrastructure
1. Introduction
Recent technological developments in the miniatur-isation of electronics and wireless communication technology have led to the emergence of Environmental Sensor Networks (ESN). These will greatly enhance
monitoring of the natural environment and in some cases open up new techniques for taking measurements or allow previously impossible deployments of sensors. ESNs are typically arrays of devices containing sensors and interconnected using a radio network. These systems allow the study of fundamental processes in the environment, as well as providing vital hazard warnings (e.g. flood alerts). This is particularly important in remote or dangerous environments where many essential processes have rarely been studied due to their inaccessibly. We predict that ESNs will produce a
⁎ Corresponding author. Tel.: +44 2380 593295.
E-mail addresses:[email protected](J.K. Hart), [email protected](K. Martinez).
1
Tel.: +44 23 8059 5499.
revolution in all aspects of earth system and environ-mental sciences similar to that generated by the use of satellite remote sensing in the 1970s.
The development of ESN requires a unique combi-nation of technological and environmental understand-ing (Computer Science and Telecommunications Board,
2001; Chong and Kumar, 2003; Martinez et al., 2004).
This facilitates studies of environments and processes in a new way which will require new technologies, new software, as well as new larger scale models of environmental behaviour. There are many potential benefits to society, by improving public access to pure research and hazard alerts. This seems vital in a world where unpopular changes may be needed to alleviate the worst effects of pollution or abrupt climate change. In this paper, we describe Environmental Sensor Networks, their role within the geosciences, current challenges, and we envision a future where ESNs make up a significant component of environmental research.
This paper presents the first review of sensor networks for earth science readers. It describes their history, representative sensor network systems and their future evolution.
2. The evolution from logging to Environmental Sensor Networks
Environmental Sensor Networks have evolved from automated loggers that record data at specific intervals and require manual downloading by a maintenance team. Some of the earliest examples of automated environ-mental monitoring include analogue loggers such as early paper plotters measuring barometric pressure. The first automatic weather station was installed in 1939 sponsored by the Bureau of Aeronautics, US Navy (Brooks, 1940; Wood, 1946). It consisted of a Stevenson Screen type arrangement mounted above a cabin which housed the electronics. This cabin was 6 ft × 6 ft × 6 ft (2 m × 2 m × 2 m) and weighed 1 ton, and was powered by a 1000-watt 115-V petrol generator (80-gallon fuel tank enough for 4 months with 8 observations every 24 h). The data was transmitted back by radio.Wood (1946)
predicted the need for a multimedia approach to remote data collection when he suggested that although the automatic stations are good“a skilled observer can, by looking at the sky, gain a comprehensive picture of the state of the weather…. The televising of the entire sky at an automatic station, so that a meteorologist at a central station may“see”the weather at a remote place, is not beyond the realm of possibility”.
Loggers have been used in many environments to collect data, e.g. subglacial environments (Fischer and
Clark, 2001), periglacial (Matsuoka and Humlum,
2003), fluvial (Butcher and Thornes, 1978) and soils (Grismer, 1992). The evolution from passive logging to an active ESN can be illustrated by the Argus video system for nearshore monitoring (Holman et al., 2003) which began as simply video recording in 1992 but is now using the intelligent processing of images since data reduction is necessary within the sensor network because otherwise video data would overload the communications infrastructure.
3. What is an Environmental Sensor Network?
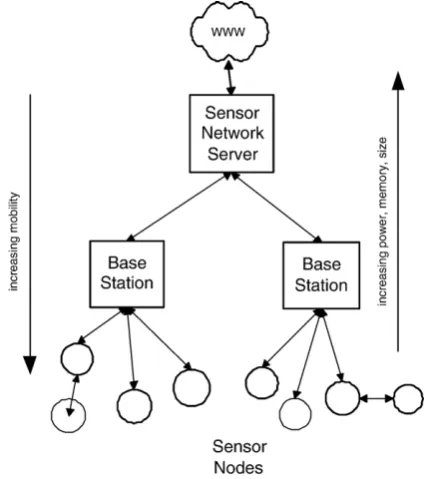
An Environmental Sensor Network comprises an array of sensor nodes and a communications system which allows their data to reach a server (Fig. 1). The sensor nodes gather data autonomously and a data network is usually used to pass data to one or more base stations, which forward it to a Sensor Network Server (SNS). Some systems send commands to the nodes in order to fetch the data, while others allow the nodes to send data out autonomously.
[image:2.544.289.502.421.661.2]Sensor networks can be wired together, and there are a number of very significant projects (particularly those underwater) that use this method (e.g. Leo-15 Coastal Cabled Observatory—Glenn et al., 2006; NEPTUNE project—Phibbs and Lentz, 2006). However, for many applications the aim is to move towards wireless sensor
networks, as cables are often impractical, obtrusive and can disturb the environment being monitored. Where the sensor nodes dynamically intercommunicate in order to establish a network this is termed an ad-hoc network. Different types of data are collected by the sensor nodes. This includes application specific environmental para-meters as well as generic data such as meteorological or differential Global Positioning System (dGPS). These data can be in different forms, digital and analogue, spatial and temporal, alphanumeric or image, fixed or moving. At the SNS level the data can be visualised and analysed within a Geographic Information System (GIS), combined with a satellite image and/or map, and published via the Web to give users seamless access to information.
Moving up the hierarchy from sensor nodes through to the Sensor Network Server the systems generally increase in computational power, data storage and power availability. The sensor nodes can store data, make decisions about what data to pass on (e.g. local area summary) and even make decisions about when and what to sense (when conditions are appropriate). The mobility of sensor nodes or base stations may be high and require location systems. If a large number of sensor nodes are needed then they would typically be organised as an ad-hoc set of clusters with representative nodes communicating a group's data to base stations. There may also be intercommunication between the
SNS and sensor nodes (process response), e.g. if an oil spill happens or weather forecast suggests a storm will occur then the nodes can switch on or change their behaviour.
Chong and Kumar (2003)suggest that the
develop-ment of sensor networks in general requires technolo-gies from three different research areas: sensing, communication and computing. Environmental Sensor Networks are a subset of sensor networks which are specifically tuned to an environmental application (Martinez et al., 2004). Before any system is designed and installed, a detailed understanding of the physical environment and deployment is required. The systems must be designed to withstand specific conditions, such as temperature, weather, pressure or vibration. The importance of the data collected, as well as their interpretation also needs to be understood. This will dramatically affect the design of the communications and data protection.
[image:3.544.70.483.429.654.2]Environmental processes vary dramatically in space and time and any monitoring system needs to operate at the scale of the process as well as being integrated with larger scale data from maps, air photographs and satellite images. The new data collected from ESNs will be greater in volume and coverage than most current process studies and will need analysis within a GIS and/or cyberinfrastructure system. We suggest that ESN's are the next step in the understanding of the
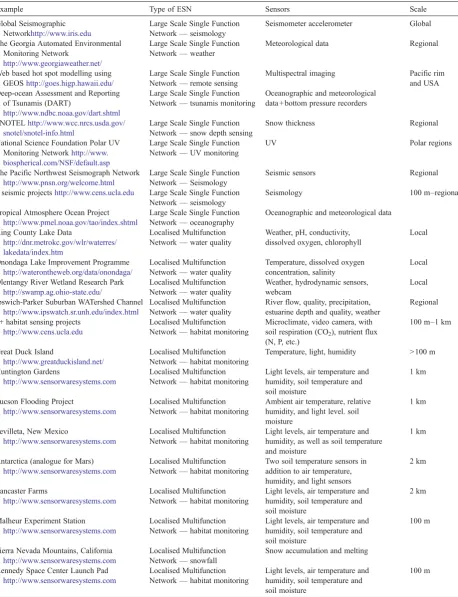
Table 1
Some examples of different Environment Sensor Network; their type, sensors and scale
Example Type of ESN Sensors Scale
Global Seismographic Networkhttp://www.iris.edu
Large Scale Single Function Network—seismology
Seismometer accelerometer Global
The Georgia Automated Environmental Monitoring Network
http://www.georgiaweather.net/
Large Scale Single Function Network—weather
Meteorological data Regional
Web based hot spot modelling using GEOShttp://goes.higp.hawaii.edu/
Large Scale Single Function Network—remote sensing
Multispectral imaging Pacific rim and USA Deep-ocean Assessment and Reporting
of Tsunamis (DART)
http://www.ndbc.noaa.gov/dart.shtml
Large Scale Single Function Network—tsunamis monitoring
Oceanographic and meteorological data + bottom pressure recorders
SNOTELhttp://www.wcc.nrcs.usda.gov/ snotel/snotel-info.html
Large Scale Single Function Network—snow depth sensing
Snow thickness Regional
National Science Foundation Polar UV Monitoring Networkhttp://www. biospherical.com/NSF/default.asp
Large Scale Single Function Network—UV monitoring
UV Polar regions
The Pacific Northwest Seismograph Network http://www.pnsn.org/welcome.html
Large Scale Single Function Network—Seismology
Seismic sensors Regional
5 seismic projectshttp://www.cens.ucla.edu Large Scale Single Function Network—seismology
Seismology 100 m–regional
Tropical Atmosphere Ocean Project http://www.pmel.noaa.gov/tao/index.shtml
Large Scale Single Function Network—oceanography
Oceanographic and meteorological data
King County Lake Data
http://dnr.metrokc.gov/wlr/waterres/ lakedata/index.htm
Localised Multifunction Network—water quality
Weather, pH, conductivity, dissolved oxygen, chlorophyll
Local
Onondaga Lake Improvement Programme http://waterontheweb.org/data/onondaga/
Localised Multifunction Network—water quality
Temperature, dissolved oxygen concentration, salinity
Local
Olentangy River Wetland Research Park http://swamp.ag.ohio-state.edu/
Localised Multifunction Network—water quality
Weather, hydrodynamic sensors, webcam
Local
Ipswich-Parker Suburban WATershed Channel http://www.ipswatch.sr.unh.edu/index.html
Localised Multifunction Network—water quality
River flow, quality, precipitation, estuarine depth and quality, weather
Regional
8+ habitat sensing projects http://www.cens.ucla.edu
Localised Multifunction Network—habitat monitoring
Microclimate, video camera, with soil respiration (CO2), nutrient flux (N, P, etc.)
100 m–1 km
Great Duck Island
http://www.greatduckisland.net/
Localised Multifunction Network—habitat monitoring
Temperature, light, humidity > 100 m
Huntington Gardens
http://www.sensorwaresystems.com
Localised Multifunction Network—habitat monitoring
Light levels, air temperature and humidity, soil temperature and soil moisture
1 km
Tucson Flooding Project
http://www.sensorwaresystems.com
Localised Multifunction Network—habitat monitoring
Ambient air temperature, relative humidity, and light level. soil moisture
1 km
Sevilleta, New Mexico
http://www.sensorwaresystems.com
Localised Multifunction Network—habitat monitoring
Light levels, air temperature and humidity, as well as soil temperature and moisture
1 km
Antarctica (analogue for Mars) http://www.sensorwaresystems.com
Localised Multifunction Network—habitat monitoring
Two soil temperature sensors in addition to air temperature, humidity, and light sensors
2 km
Lancaster Farms
http://www.sensorwaresystems.com
Localised Multifunction Network—habitat monitoring
Light levels, air temperature and humidity, soil temperature and soil moisture
2 km
Malheur Experiment Station http://www.sensorwaresystems.com
Localised Multifunction Network—habitat monitoring
Light levels, air temperature and humidity, soil temperature and soil moisture
100 m
Sierra Nevada Mountains, California http://www.sensorwaresystems.com
Localised Multifunction Network—snowfall
Snow accumulation and melting
Kennedy Space Center Launch Pad http://www.sensorwaresystems.com
Localised Multifunction Network—habitat monitoring
Light levels, air temperature and humidity, soil temperature and soil moisture
Table 1 (continued)
Example Type of ESN Sensors Scale
Cal Poly Pomona, College of Agriculture http://www.sensorwaresystems.com
Localised Multifunction Network—habitat monitoring
Light levels, air temperature and humidity, soil temperature and soil moisture
100 m
XYZ On A Chiphttp://www.cbe. berkeley.edu/research/ briefs-wirelessxyz.htm
Localised Multifunction Network—HVAC monitoring
Airflow measurement and indoor temperature
Building scale
WAVIS (wave-current informationsystem) http://www.wavcis.lsu.edu/aboutus.asp
Localised Multifunction Network—Oceanography
Wave height, period, direction of propagation, water level, surge, near surface current speed and direction and meteorological conditions, webcam
Regional
MySound
http://www.mysound.uconn.edu/index.html
Localised Multifunction Network—oceanography
Water quality, weather, wave data, webcam Regional
Chesapeake Bay Observatory System http://www.cbos.org
Localised Multifunction Network—oceanography
Weather, salinity, wave speed, wave direction and conductivity
Regional
SECOAShttp://envisense.org/secoas.htm Localised Multifunction Network—ocean conditions
Location, wave heights 1 km
Argus (15 installed worldwide) http://www.planetargus.com/
Localised Multifunction Network—coastal erosion
Video camera 5 cameras
1 km Floodnethttp://envisense.org/
floodnet/floodnet.htm
Localised Multifunction Network—flood warning
Water depth 1 km
CORIEhttp://www.ccalmr.ogi.edu/CORIE/ Localised Multifunction Network—fluvial observations and flood warning
Water temperature, conductivity, pressure, velocity, acoustic backscatter, wind speed and direction,
air temperature and relative humidity, longwave and shortwave radiation
20 km
NWIS web water datahttp://water.usgs.gov/ Localised Multifunction Network—flood warning
Surface water, ground water and water quality
Regional
Volcán Tungurahua Projecthttp://www.eecs. harvard.edu/~werner/projects/volcano/
Localised Multifunction Network—volcanic processes
Wireless infrasonic sensor array > 10 km
GlacsWebwww.glacsweb.org Localised Multifunction Network—glacial processes
Weather, location, tilt, pressure, temperature
> 100 m
Smart Gas-MIR space station air quality Persaud et al., 1999
Biosensor Network—air quality 20 element conducting polymer array > 100 m
Ferrera Air Pollution MonitoringCarotta et al., 2001
Biosensor Network—air quality CO, NO, NO2, O3 > 100 m
Cranfield University Sewage Works Bourgeois et al., 2003
Biosensor Network—water contaminants
12 conducting polymer sensors > 100 m
4 contaminant transport monitoring projects http://www.cens.ucla.edu
Biosensor Network—soil and water contaminants
Soil moisture and soil CO2sensors, nitrate flux
100 m
2 marine microorganisms projects http://www.cens.ucla.edu
Biosensor Network—monitoring algae
Immuno-based flow cytometry Autonomous mobile robots AWACSS
http://barolo.ipc.uni-tuebingen.de/awacss/
Biosensor Network—monitoring water contaminants
Estrogens and progestogens in sediment and water
> 100 m
UK Environmental Change Network http://www.ecn.ac.uk/
Heterogeneous Network Weather, land and lake surface water discharge, camera
Regional
National Environmental Monitoring Initiative http://www.epa.gov/cludygxb/html/ choices.htm
Heterogeneous Network— inventory of monitoring sites
Wide range Regional
National Ecological Observatory Network http://www.neoninc.org/
Heterogeneous Network Ecological monitoring National
The Global Earth Observation System GEOSShttp://www.noaa.gov/eos.html
Heterogeneous Network Wide range Global
SensorNethttp://www.sensornet.gov/ Heterogeneous Network— Incident management system
Wide range National
Coastal Ocean Observation Laboratory http://marine.rutgers.edu/cool/ LEO/LEO15.html
Heterogeneous Network Satellites, aircrafts, ships, fixed/ relocatable moorings, and autonomous underwater vehicles used to measure a wide range of oceanographic properties
Local
[image:5.544.48.498.87.674.2]environment, and a key component of environmental analysis.
4. Sensor nodes
Sensor network nodes typically have a set of design goals including sensor integration, data quality, size, cost, robustness and power management. Low power use is essential as well otherwise they do not run without constant battery maintenance. Low maintenance is a design goal as these systems should work independently without much intervention. Due to the harsh nature of most of the host environments, they are designed to be robust — from their weatherproof containers to the error-tolerance of their communications networks. Finally they are usually designed to blend into the environment in order to take undisturbed readings as well as minimise human interference. Similarly they should avoid the use of components which would pollute the environment if there is a risk of loss. Low cost can allow a large number to be deployed however in many cases their individual cost is less significant than the deployment cost and importance of the data. The nature of sensor nodes is controlled by the deployment area and the commercial availability of sensor nodes. For some applications deploying many small groups of sensors over a larger area is the best way to obtain representative data, while for others node costs will be limited by the sensor costs or large numbers are simply not required.
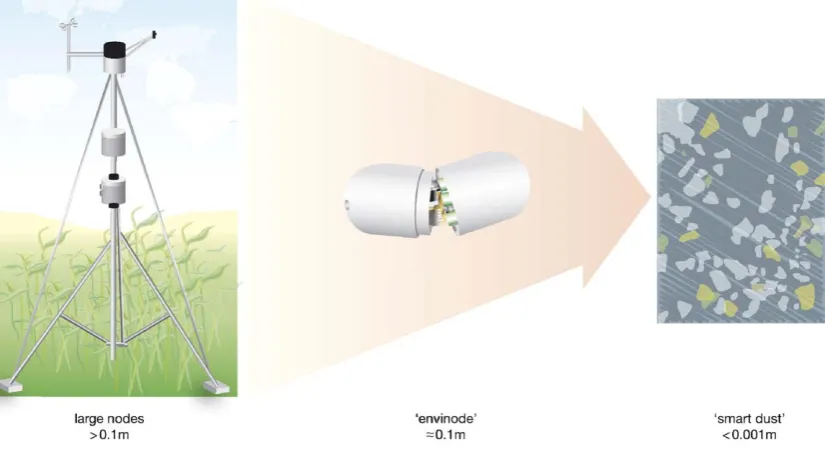
Different applications require specific node sizes and geographic coverage. It has been argued that in the future there will be an evolution from large static nodes to‘smart dust’(Fig. 2). A typical large scale node would be that used in the Global Seismographic Network
(www.iris.edu). This network comprises 136 stations
across the globe in 59 countries, which was established in 1986 by the Incorporated Research Institute for Seismology (IRIS). The sensors include a principal broadband seismometer with auxiliary seismometer and strong motion accelerometer. These nodes are around 50 × 50 cm and are in fixed locations. The data from
these are hosted on the Internet and provides real-time access to the seismic data from all over the world (Butler et al., 2004).
Smart dust is a futuristic concept to build tiny
wireless nodes which often use microelectromechani-cal sensors (MEMS) on a cubic millimetre smicroelectromechani-cale
(Kahn et al., 2000; Warneke and Pister, 2004). The
idea is that thousands of these micro sensors will be scattered around the environment to sense different variables. Tiny nodes will also emerge which do not use MEMS at all, but use miniaturisation to reduce cost and ease deployment. However, small is not always better, Delin et al. (2005) have argued that capability and environmental robustness are more critical than size, and many environmental processes have scale constraints.
However, most nodes are intermediate in scale between the large scale and smart dust. They are usually built specifically for an environment under investiga-tion. Ideally they are built to be embedded in the environment (camouflaged and coupled). We propose to call this style of node an envinode. For example, the GlacsWeb project (Martinez et al., 2004) which is sensing glacier behaviour, uses sensors embedded in a probe shaped like a clast (Fig. 2). Berkeley's habitat modelling at Great Duck Island, which is analysing bird nesting habits, uses camouflaged nodes in the bird's burrows (Szewczyk et al., 2004).
Nodes do not necessarily need to be static. Not only can they be moved by the environment but can be actively moved by aerial tramways (Rahimi et al., 2004), robotic vehicles (at different scales including small sub-kilogram intelligent tele-robots—Melodia et al., 2005), aeroplanes (Argrow et al., 2005), micro-submarines (Ryan et al., 2002) and satellites (Delin, 2002; Chien et al., 2005) for example.
5. Examples of Environmental Sensor Networks
Environmental Sensor Networks vary in their scale and function. Since the aim of an ESN is to automatically sense the environment, we have taken
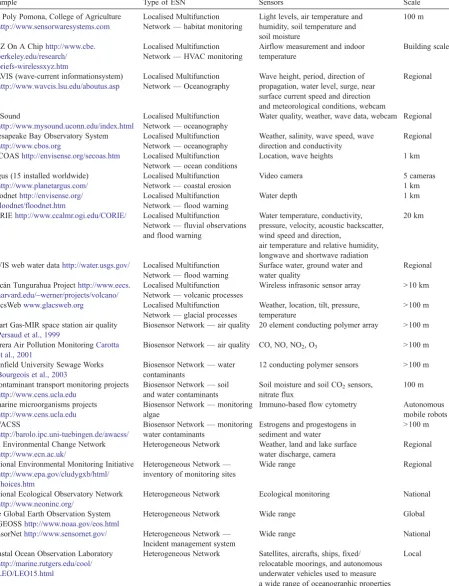
Table 1 (continued)
Example Type of ESN Sensors Scale
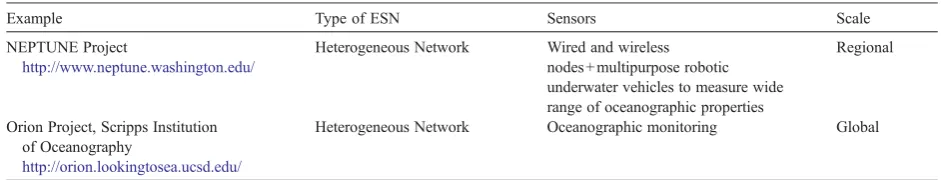
NEPTUNE Project
http://www.neptune.washington.edu/
Heterogeneous Network Wired and wireless nodes + multipurpose robotic underwater vehicles to measure wide range of oceanographic properties
Regional
Orion Project, Scripps Institution of Oceanography
http://orion.lookingtosea.ucsd.edu/
[image:6.544.38.509.80.170.2]a very broad view on what comprises such a network. Here we describe the properties of some different types of systems, which are summarised below and in
Table 1 and Fig. 3. This list is by no means
compre-hensive, but illustrates a range of over 50 current examples.
5.1. Large Scale Single Function Networks
These tend to cover large geographic areas, take measurements for a single purpose and large, expensive nodes. These comprise (usually large) nodes that normally measure one or more variables and have been networked together. The simplest of these are weather stations, and more complex examples include
the Global Seismographic Network described above. They are normally attached to mains power, wired, and often size is not important.
The Georgia Automated Environmental Monitoring Network is a typical weather sensor network. The data are collected every 1 s and summarized at 15 min intervals and at midnight a daily summary is calculated. The data are processed immediately and disseminated via the Internet (Hoogenboom, 1993) and analysed within a cyberinfrastructure system (Li et al., 2004).
[image:7.544.70.471.271.676.2]Another example is the Snowpack Telemetry (SNO-TEL) project which uses meteor burst communications technology to collect and communicate data in near-real-time (http://www.wcc.nrcs.usda.gov/snotel/snotel-info. html). VHF radio signals are reflected at a steep angle
off the ionosphere. There are 600 SNOTEL sites in 11 western states including Alaska. These sites are generally located in remote high-mountain watersheds where access is often difficult or restricted. They are designed to operate unattended and without maintenance for a year and are battery powered with solar cell recharge. Similar to this programme is the NSF Polar Programs UV Monitoring Network consisting of 7 sites at the poles (Bernhard et al., 2003).
Some networks produce hazards warnings. The Hawaii Institute of Geophysics and Planetology has a system that automatically processes GOES satellite data within half an hour of acquisition to monitor volcanic hot spots. This includes: images enhanced to show hot spot activity, maps to show location, radiance logs and graphs also providing a hot spot email notice. The fact that this integrates data from three geo-stationary satellites can class the system as a sensor network in the broader sense. Similarly, the successful“Deep-ocean Assessment and Reporting of Tsunamis (DART) system” (Gonzalez et al., 1998; Bernard, 2004) will have 30 extra moored buoys to be installed in the Pacific and Caribbean as a Tsunamis early warning system to be operational by 2007.
The Pacific Northwest Seismograph Network repre-sents a more detailed version of the Global Seismogra-phic Network. This comprises over 150 seismic stations which relay their data to computers which automatically determine earthquake locations and magnitudes and rapidly provide essential information. The Rapid Alert for Cascadia Earthquakes (RACE) system broadcasts earthquake location, magnitude, and shaking estimates within minutes to sites throughout the region via pagers attached to PC mapping packages. The earthquake alert information is also available immediately on the PNSN web pages: http://www.ess.washington.edu/SEIS/ PNSN/. Similar to this are five seismic projects installed by University of California, Los Angeles, one of which uses a wireless sensor network (Xu et al., 2004).
Most of these projects use simple “star” networks rather than ad hoc networks, but many have expensive nodes and deployments, which could be adapted to use the more adaptive networks described below. An example of this is the Tropical Atmosphere Ocean Project (TAO) which collects real-time data from 70 moored ocean buoys in the Pacific Ocean to study El Niño processes (McPhaden, 2004). The system was begun during the 1970s, and today the data are transmitted by satellite to the Internet. However, now that the infrastructure of fixed buoys exists, adapting them to support local sensor networks may be easier than deploying a brand new sensor network.
5.2. Localised Multifunction Sensor Networks
These networks typically comprise smaller nodes to monitor the environment. These nodes normally mea-sure relatively straightforward generic properties (tem-perature, humidity etc) which can be used in a variety of applications, however, these are more likely to be ad-hoc systems and use‘intelligent’networking.
Typically these systems measure straightforward envi-ronmental and meteorological properties. Good examples would be the water quality monitoring systems in Kings County run by the USA's Department of Natural Re-sources and Parks' (http://dnr.metrokc.gov/wlr/waterres/
lakedata/index.htm) and the Onondaga Lake
Improve-ment project run by the local Onondaga County De-partment of Water Environment Projection, Syracuse, USA (http://www.lake.onondaga.ny.us/ol33.htm). Ano-ther example is the Olentangy River Wetland Research Park (Day et al., 2003) which is an artificial wetland monitored with meteorological and underwater hydrody-namic sensors. Similarly the Ipswich-Parker Suburban WATershed Channel (IPSWATCH) project monitors water quality in the rivers and estuarine waters of Mas-sachusetts (http://www.ipswatch.sr.unh.edu/index.html).
More complex sensor networks have been developed by the Centre for Embedded Network Sensing at University of California, Los Angeles (UCLA) which has over eight projects in different environments (Szewczyk et al., 2004) and NASA's JPL laboratory which has developed over nine deployments (Delin et al., 2005) (now available at SensorWare Systems). These are wireless ad-hoc sensor networks. These cost-effective nodes measure generic parameters such as incoming solar radiation, air temper-ature and humidity, soil tempertemper-ature and soil moisture. They are mostly installed within a small area (up to 2 km2), and report back to a central base station either directly or via a relay. Numbers of nodes deployed range from less than 10 to over 60 at the Great Duck Island project (Szewczyk et al., 2004). One of the advantages of these systems is the relative simplicity of the installation and sensor nodes, which are based on commercially available motes
(Crossbow: http://www.xbow.com). Delin (2002) and
Some ESNs have been more finely tuned to certain applications. Their sensors are more customized and are more likely to be held within a more specialised enclo-sure. Some example projects that study oceanographic processes include the WAVCIS (wave–current informa-tion system) project (Stone et al., 2003), the“Monitoring Your Sound”(MYSound) project (Codiga et al., 2000) and another is the Chesapeake Bay Observatory System (www.cbos.org). A more complex system is found in the SEACOS: Self-organizing Collegiate Sensor Networks project which uses sea-bed sensors connected to buoys with long range wireless communication. It records wave properties around an offshore wind farm and uses intelligent sensors capable of dynamic self-configuration (Britton and Sacks, 2004).
Floodnet (De Roure, 2005) also uses a wireless sensor network but is designed to generate flood warnings. The CORIE project (Zhang et al., 2004) integrates a real-time sensor network, a data manage-ment system and advanced numerical models to understand on the spatial and temporal variability of the Lower Columbia River, USA. This project combines environmental observation with forecasting. On a larger scale from this is the US Geological Survey (USGS) NWIS web water data which has 1.5 million stations across the USA providing real-time and sampled data on line (http://waterdata.usgs.gov/nwis). This system addi-tionally provides flood warnings.
The Volcán Tungurahua project (Werner-Allen et al., 2005) used a wireless ESN to monitor volcanic activity by specially-constructed microphones to monitor infra-sonic (low-frequency acoustic) signals emanating from the volcanic vent during eruptions. They gathered over 54 h of continuous infrasound data, transmitting signals over a 9 km wireless link back to a base station at the volcano observatory. Similar to this is the GlacsWeb project (Martinez et al., 2004) which uses a wireless sensor network to understand subglacial processes using sensor nodes embedded in the glacier and subglacial sediment. From August 2004 to August 2005 they collected the equivalent of 859 days of probe data (36,078 sensor readings) on subglacial water pressure, case stress, temperature, tilt angle and resistivity. From this they were able to reconstruct how subglacial processes operated over the year in order to understand the relationship between glacier dynamics and climate change.
5.3. Biosensor Networks
This is an emerging set of systems which are distinguished mainly by their use of biotechnology. A
biosensor comprises a biological sensing element attached to a physical transducer, which can be electro-chemical, optical electronic, optical or acoustic. This type of ESN generally requires new sensor technology to test air, water and soil. Many pollutants are currently not monitored in situ but samples collected on site and later analysed in a laboratory. The development of ESNs will encourage the development of instruments that have had little technological development for years ( Bour-geois et al., 2003b), new small sensors for in situ mea-suring (Sugimoto et al., 1999), as well as the deve-lopment of sensors to measure environmental proxies.
Rogers and Gerlach (1996)describe the history of in situ chemical analysis from portable gas chromato-graphs in the 1970s (Budde and Eichelberger, 1979) to immunochemical techniques in the 1980s (Van Emon
and Lopez-Avila, 1992). Since then, researchers have
investigated biosensors (Rogers, 1995; Rogers and Williams, 1995) and ancillary technologies for environ-mental applications, especially those that require continuous monitoring. This is a device that detects, records, and transmits information regarding a physio-logical change or the presence of various chemical or biological materials in the environment (Burlage et al., 1997). Biosensors are currently available for monitoring biochemical oxygen demand (BOD) (Kim et al., 2003a) and bacteria (Li et al., 2000). In addition, genetically engineered bacteria can used to produce a detectable signal, such as light, in the presence of a specific pollutant, e.g. toluene, in water (Zhou et al., 1997).
Oak Ridge National laboratory USA has developed a 1.5 cm2infrared microspectrometer which uses a light source to excite certain types of compounds in gases, liquids, and solids which emit infrared light of various wavelengths (Rajic and Datskos, 2000). The US Naval Research Laboratory has developed a fiber-optic biosensor to measure explosives in the environment
(Shriver-Lake and Ligler, 1995) and photosynthetic
membranes are being used by researchers at the University of Karlruhe, Germany to detect herbicides (Barcello et al., 1995).
Sensor networks using biosensors are in their infancy, but many test sensors being developed, one of these is a wireless, remote query ammonia sensor (Cai et al., 2001). Larger projects include an investigation of air quality on the MIR space station (Persaud, 1999), air pollution monitoring in Ferrera (Carotta et al., 2001) and the Cranfield University Sewage Works (Bourgeois et
al., 2003a). As an intermediate step between large
collection of river contaminants using manual ‘ dip-stick’ analysis where data are transmitted back to the SNS using hand held PDAs (Nick Holden, pers.com.).
Detailed research is being carried out by UCLA on contaminant transport modeling (Bendikov et al., 2003), where research is being carried out on developing sensors on the millimeter scale as well as sampling surrogate properties for variables difficult to directly sense (Kim et al., 2003b). In addition, they are also producing a network to monitor marine microorgan-isms. Similarly, the Automated Water Analyser Com-puter Supported System (AWACSS) project uses an optical sensor to detect river pollution (http://barolo.ipc. uni-tuebingen.de/awacss/). These projects address the problems of mobility, scale, sensing in water as well as the development of new sensors (Dhariwal et al., 2004).
5.4. Heterogeneous Sensor Network
This type of network would include the data sources from the different types of ESN described above to monitor the environment at different scales. This is how we envision the future for Environmental Sensor Networks. One fledgling example is the UK Climate Change Network (http://www.ecn.ac.uk) which is long term integrated environmental monitoring and research programme (Lane, 1997, Scott and Anderson, 2003). There are 12 terrestrial and 43 freshwater sites monitored in the UK, measuring 4 types of automatic measurements (automatic weather station, land and lake surface water discharge, camera) and 15 types of manual measurements (daily manual weather measurements, NO2, precipitation chemistry, ground and surface water chemistry, soil solution chemistry, and surveys of soil, vegetation, vertebrates, invertebrates, macro-inverte-brates, aquatic macrophytes, zooplankton, phytoplank-ton and epilithic). At present most of the nodes measure a single function, but they could potentially be linked together as an intelligent sensor network. Many of the parameters measured manually could be measured automatically or by an appropriate proxy as sensor technology is developed (e.g. for vegetation cover, animal tracking, etc). A sensor network can also detect larger scale measurements which are not visible to one node, for example the overall direction and trend of a reading across the whole area. This can help the nodes adapt their sampling strategy for example or detect the boundary of an event.
On a larger scale is the US Environmental Protection Agency supported“National Environmental Monitoring Initiative” (http://www.epa.gov/cludygxb/html/choices. htm). Currently, this is an inventory of different
monitoring schemes at different scales. This includes the different types of ESN described above, as well as logging sites. It represents the first step in trying to produce a US wide heterogeneous Environmental Sensor Network. A similar project is the US NEON (National Ecological Observatory Network) system (http://www.neoninc.org/).
The Global Earth Observation System (GEOSS) plans to combine data from satellites, ocean buoys, weather stations and other instrumented data to understand environmental processes (http://www.noaa.
gov/eos.html). Similarly, the ORION project aims to
integrate data from a range of ocean sensors using Grid technologies (Foster, 2004), which are also used to develop models and run experiments. The initial project will monitor US waters and it is planned to expand this to global coverage (http://orion.lookingtosea.ucsd.edu/). Another example could be an adaptation of the UN Global Environmental Monitoring System (GEMS) (Barker et al., 2003). This has over 100 stations recor-ding data about different water quality parameters since 1977. These collect water samples, which are sent to a laboratory and then analysed. The data are also not freely available on the Internet because of political objections. However, if sensor nodes could be devel-oped, then this could be integrated into a world wide water quality sensor network which would be an essen-tial tool to understand hydrological processes, and respond and react to water supply and quality problems.
6. Communications
hopping extends the range (sometimes called “mesh networks”) or using intermediate base stations/gateways (shown inFig. 1as inter-node communications).
There have been various approaches to networking and control. One approach to power management is configuring the nodes to“wake-up”for short periods for communications and take sensor readings and relay their data once a day (Martinez et al., 2004). Passive nodes which are interrogated sequentially by a base station are common as they reduce complexity while avoiding competition for access to the (usually single channel) radio. Active nodes which send data out via“gateway” base stations require more sophisticated network proto-cols to avoid wasteful“collisions”where more than one node tries to send. The application and node character-istics determine the best technique to use. For example nodes which are“always on”to produce alerts can use a different protocol from nodes which“sleep”most of the time. For example it is possible to use a time-slot protocol which allows nodes to “simultaneously” communicate without wasteful collisions using good time synchronisation. The Jet Propulsion Lab's Sensor Webs (Delin et al., 2005) use this type of technique but also make every node store all the data from the other nodes. This not only gives them the ability to modify their behaviour based on the local data but secures a path for all the data to be retrieved.
7. Cyberinfrastructure
Just as the evolution from logging to ESN brought improvements in data access and management, the current activity in high-level data integration will bring about another major change. Environmental Sensor Networks produce data on a scale that has rarely been generated before in some parts of the geosciences, and this requires its own data handling, storing and visualization. Most systems are not designed to allow automatic data gathering by users and search engines but typically involve manual data exports from an Internet site. GRID and Semantic Web (Berners-Lee et
al., 2001) technology will allow automatic data
gathering in the future. The term “cyberinfrastructure” was coined by the US National Science Foundation (NSF) committee to describe the new research environ-ments in which advanced computational, collaborative, data acquisition and management services are available to users through high-performance networks (http://
www.cise.nsf.gov/sci/reports/ExecSum.pdf). Staudigel
et al. (2003) have evaluated the challenges and
requirements of cyberinfrastructure on geochemical data, whilst Arzberger et al. (2004) have outlined
similar ideas for the Life Sciences community. GRID technology can be used to provide not only the large scale compute resources needed for large models but an infrastructure for data and software management. For example Web Services can provide distributed storage, retrieval and processing capabilities.
Over the years a considerable amount of data has been acquired and stored in databases, which are increasingly becoming available over the Internet. However to gather data from a variety of sources a researcher would have to manually visit each site in turn as well as converting each data set into a useful format. The challenge is to set standards in terms of the data publication as well as the software interfaces to the repositories so that seamless data gathering is possible in the future. There are analogies with systems such as the Open Archives Initiative (http://www.openarchives.org/) where users can locate an item in any conformant repository because the standards allow structured indexes to be made across the collections. Sensor networks themselves may one day fetch data independently from various external sources. For example an avalanche prediction network might automatically gather data from weather services in adjacent countries and automatically make use of new data and sites.
The markup language XML has provided a more flexible way to encapsulate and describe metadata, nevertheless it is still possible that every project defines a completely different schema and the data integration problems continue. The Geography Markup Language (GML) (http://www.opengis.net/gml) describes generic information including geospatial, temporal and units. This kind of metadata standard is a building block for cyberinfrastructure. However, it is important that one standard is used worldwide for the messages systems may send or receive, particularly for emergencies, and so the Common Alerting Protocol (CAP)( http://www.oasis-
open.org/committees/download.php/14759/emergency-CAPv1.1.pdf) is an emerging XML format for these
messages. CAP and GML are used in the SensorNet project (http://www.sensornet.gov/), a comprehensive incident management system for the near-real-time detection, identification, and assessment of chemical, biological, radiological, nuclear, and explosive threats.
The GEOsciences Network (GEON) project (http://
www.geongrid.org) aims to prototype interpretive
Geochemical Earth Reference Model (GERM) concen-trating on producing a Cyberinfrastructure in Geochem-istry and the UK GODIVA project which generates online (immediate) global climate data from meteoro-logical data. In addition, Google Earth (http://www.
earth.google.com) is a widely used tool which may
become a de facto standard for visualising the location of sensor networks and their data.
Systems using semantic web technologies describe the information using ontologies rather than metadata standards. The main advance over plain XML schema is that ontology-based information describes the relation-ships between the items of information or concepts. This allows software to reason more about the data and carry out inferences. For example two weather systems may describe rainfall with different XML schema but if these have been related those to a common ontology's concept defining rainfall, software can automatically use both data sources. All these approaches are improving data integration and harvesting.
8. Challenges for Environmental Sensor Networks
Just as developments in computer science in the 1960–80s allowed the development of spatial data to be analysed by geoscientists within a GIS (Tomlinson, 1987), it is vital that those with an understanding of the environment actively engage in the development in user friendly Environmental Sensor Networks.
Particular challenges for the development of ESN include:
(1) Power management — In order for an ESN to
work unattended, without continuous battery changes the systems have to use sophisticated power management techniques which are coupled to their communications design as that is usually the dominant factor in power use.
(2) Management and usability—Most systems today
have been produced as research platforms and required considerable technical expertise to de-ploy and manage. There are ongoing efforts in user-driven deployments to evolve the systems towards the usability usually found in commodity items such as data loggers.
(3) Standardisation—This is missing at many levels today. The hardware platform and operating software varies so much that interoperability is difficult. In the future it should be possible to deploy nodes from a variety of vendors and visualise the data in a unified way. Metadata and ontology standards are just as important as they
will allow the global data information systems of the future.
(4) Data quality—Sensor calibration is vital for high quality data collection. In addition, defining the exact source of sensor data is important when they are analysed. This provenance and experimental setup information will need to be preserved without placing too much burden on the users.
(5) Security—Some ESNs require security systems
in order to prevent tampering, both at the hardware level as well as data and management levels. Although conventional network security protocols can be used these are often too“heavy” for the low-power devices used.
(6) Data mining and harvesting—Continued efforts
on standardization and semantic markup will eventually lead to a data availability unseen before, which will require concerted efforts to make data mining simple for users as well as software agents.
(7) Development of new sensors (particularly)
bio-sensors, sensor proxies and envinodes—Off the
shelf sensors have progressed enormously in terms of size, power use and stability. However miniaturization, cost reduction and low-power design are still needed for the latest bio-sensors for example. The computer systems used in nodes today tend to be simple in order to save power but it is expected that higher integration into smaller packages, for example“system on chip”designs will improve the node's capabilities.
9. The future of environmental monitoring within Earth system science
We envision a future where ESNs are a standard part of earth system and environmental science, and a scientist will be able to observe the environment from their office. But this does not mean there will be less field work as it is still needed to design, install and maintain the systems. The ability to be in daily contact with the data source (via the Internet) allows a researcher to have a better ‘connection’ with the environment they study. Also the development of sensors allows a new approach to study the environ-ment, new field methods to be conceptualised, and new solutions to scientific problems advanced.
nodes, cyberinfrastructure) need to be environment driven (not just technologically). The sensors and sensor nodes need to be tailored specifically to the environment being sensed, and at the scale of the environmental processes. At the same time this allows a significant opportunity for earth scientists to work alongside engineers in the development of user-friendly and domain knowledge oriented ESNs.
AlthoughThorn (2003)argues against the indiscrim-inate collection of data, we would argue that ESNs allow a new focused approach to data collection related to the environment being sensed, and the appropriate use of a dedicated cyberinfrastructure allows the required data to be extracted later by users. However, it must be remembered that for many environments, large data sets of generic parameters have never been sensed, and we suggest that at this stage we are still‘mapping out’ the basic conditions of many environments. This basic monitoring is vital if we are to respond as a society to rapid climate change (e.g. the Built Urban environment,
Shepherd and Jin, 2004; or mountainous environments,
Bradley et al., 2004).
Environmental Sensor Networks represent a new way to sense and understand the environment, which have a huge potential in many areas of the environmental sciences. Although it is the development of technology that has enabled this new style of monitoring, it is Earth system and environmental scientists with their under-standing of environmental processes that need to play a vital role in guiding this exciting revolution.
Acknowledgements
The authors would like to thank Tim Aspden and his colleagues from the Cartographic Unit, School of Geography, for figure production, and all the members of the GlacsWeb project.
References
Argrow, B., Lawrence, D., Rasmussen, E., 2005. UAV systems for sensor dispersal, telemetry, and visualization in hazardous environments. Proc. of the 43rd AIAA Aerospace Sciences Meeting and Exhibit, Reno, NV, AIAA-2005-1237.
Arzberger, P.W., Farazdel, A., Konagaya, A., Ang, L., Shimojo, S., Stevens, R.L., 2004. Life sciences and cyberinfrastructure: dual and interacting revolutions that will drive future science. New Generation Computing 22 (2), 97–110.
Barcello, D., Lacorte, S., Marty, J.L., 1995. Validation of an enzymatic biosensor with liquid chromatography for pesticide monitoring. Trends in Analytical Chemistry 14, 334–340.
Barker, S., Adriaanse, M., Chilton, J., Diop, S., Ipsen, N.H., Igarashi, S., Jimbow, T., Kariya, S., Lonergan, S., Maurer, T., Meybeck, M., Robarts, R., Yamashiki, Y., 2003. Improving Global Water Quality
Monitoring: UNEP GEMS/Water Technical Advisory Paper, vol. 1, pp. 1–18.
Bernard, E.N., 2004. The national tsunami hazard mitigation program. EOS 85 (7), F1025.
Berners-Lee, T., Hendler, J., Lassila, O., 2001. The Semantic Web— a new form of Web content that is meaningful to computers will unleash a revolution of new possibilities. Scientific American 284 (5), 34–42.
Bernhard, G., Booth, C.R., Ehramjian, J.C., 2003. Real-time UV and column ozone from multi-channel UV radiometers deployed in the National Science Foundation's UV monitoring network. In: Slusser, J.R., Herman, J.R., Gao, W. (Eds.), Ultraviolet Ground—and Space-Based Measurements, Models, and Effects III: Proceedings of SPIE, vol. 5156, pp. 167–178.
Bendikov, T.A., Kim, J., Harmon, T.C., 2003. Development and environmental applications of a nitrate selective microsensor based on doped polypyrrole films. 204th Meeting of the Electrochemical Society, October 12–16, 2003.
Bourgeois, W., Hogben, P., Pike, A., Stuetz, R.M., 2003a. Develop-ment of a sensor array based measureDevelop-ment system for continuous monitoring of water and wastewater. Sensors and Actuators B 88, 312–319.
Bourgeois, W., Romain, A.-C., Nicolas, J., Stuetz, R.M., 2003b. The use of sensor arrays for environmental monitoring: interests and limitations. Environmental Monitoring 5 (6), 852–860. Bradley, R.S., Keimig, F.T., Diaz, H.F., 2004. Projected temperature
changes along the American cordillera and the planned GCOS network. Geophysical Research Letters 31 (16) (art. no L16210). Britton, M., Sacks, L., 2004. The SECOAS Project: development of a self-organising, wireless sensor network for environmental monitoring. Second International Workshop on Sensor and Actor Network Protocols and Applications, Boston, SANPA-2004, pp. 1–7.
Brooks, C.F., 1940. An automatic weather station. Bulletin of the American Meteorological Society 21, 76–77.
Budde, W.L., Eichelberger, J.W., 1979. Organics in the environment. Analytical Chemistry 51, 567A–574A.
Burlage, R.S., Strong-Gunderson, J., Steward, C., Matrubutham, U., 1997. Bioreporters and biosensors for environmental analysis. In: Sayler, S., Sanseverino, J., Davis, L. (Eds.), Biotechnology in the Sustainable Environment. Plenum Press, New York, pp. 261–268. Butcher, G.C., Thornes, J.B., 1978. Spatial variability in run-off
processes in an ephemeral channel. Zeitschrift für Geomorphologie NF 29, 83–92.
Butler, R., Lay, T., Creager, K., Earl, P., Fischer, K., Gaherty, J., Gabi, L., Leith, B., Park, J., Ritzwoller, M., Tromp, J., Wen, L., 2004. The Global Seismographic Network surpasses its design goal. EOS 85 (23), 225–229.
Cai, Q.I., Jain, M.K., Grimes, C.A., 2001. A wireless, remote query ammonia sensor. Sensors and Actuators B 77, 593–692. Carotta, M.C., Martinelli, G., Crema, L., Malagu, C., Merli, M.,
Ghiotti, G., Traversa, E., 2001. Nanostructured thick-film gas sensors for atmospheric pollutant monitoring: quantitative analysis on field tests. Sensors and Actuators B 76, 336–342.
Chien, S., Sherwood, R., Tran, D., Cichy, B., Rabideau, G., Castano, R., Davies, A., Mandl, D., Frye, S., Trout, B., Shulman, S., Boyer, D., 2005. Using autonomy flight software to improve science return on Earth Observing One. Journal of Aerospace Computing, Information, and Communication 2, 196–216.
Codiga, D.L., Rice, J.A., Bogden, P.S., 2000. Real-time wireless delivery of subsurface coastal circulation measurements from distributed instruments using networked acoustic modems. Proceedings of the MTS/IEEE Oceans 1, 575–582.
Computer Science and Telecommunications Board, 2001. Embed-ded, Everywhere: A Research Agenda for Networked Systems of Embedded Computers. National Academy Press, Washington. 236 pp.
Day Jr., J.W., Yanez Arancibia, A., Mitsch, W.J., Lara-Dominguez, A.L., Day, J.N., Ko, J.-Y., Lane, R., Lindsey, J., 2003. Using ecotechnology to address water quality and wetland habitat loss problems in the Mississippi Basin: a hierarchical approach. Biotechnology Advances 22, 135–159.
Delin, K.A., 2002. The Sensor Web: a macro-instrument for coordinated sensing. Sensors 2, 270–285.
Delin, K.A., Jackson, S.P., Johnson, D.W., Burleigh, S.C., Woodrow, R.R.J., McAuley, M., Dohm, J.M., Ip, F., Ferré, T.PA., Rucker, D. F., Baker, V.R., 2005. Environmental studies with the Sensor Web: principles and practice. Sensors 5, 103–117.
De Roure, D., 2005. Floodnet: a new flood warning system. Royal Academy of Engineering Quarterly 23, 48–51 (2005).
Dhariwal, A., Sukhatme, G.S., Requicha, A.A.G., 2004. Bacterium-inspired robots for environmental monitoring. IEEE International Conference on Robotics and Automation (ICRA), April 25–30, 2004.
Fischer, U.H., Clark, G.K.C., 2001. Review of subglacial hydro-mechanical coupling: Trapridge Glacier, Yukon Territory, Canada. Quaternary International 86, 29–44.
Foster, I. (Ed.), 2004. The Grid: Blueprint for a New Computing Infrastructure, 2nd Edition. Morgan Kaufmann.
Ganesan, D., Cerpa, A., Ye, W., Yu, Y., Zhao, J., Estrin, D., 2004. Networking issues in wireless sensor networks. Journal of Parallel and Distributed Computing 64 (7), 799–814.
Glenn, S.M., Schofield, O.M., Chant, R., Kohut, J., McDonnell, J., McLean, S.D., 2006. The Leo-15 coastal cabled observatory-phase II for the next evolutionary decade of oceanography. SSC06-Scientific Submarine Cable 2006.
Gonzalez, F.I., Milburn, H.M., Bernard, E.N., Newman, J.C., 1998. Deep-Ocean Assessment and Reporting of Tsunamis (DART): brief overview and status report. Proceedings of the International Workshop on Tsunami Disaster Mitigation, 19–22 January 1998, Tokyo, Japan.
Grismer, M.E., 1992. Field sensor networks and automated monitoring of soil–water sensors. Soil Science 154 (6), 482–489.
Holman, R., Stanley, J., Ozkan-Haller, T., 2003. Applying video sensor networks to nearshore environment monitoring. IEEE Pervasive Computing 2 (4), 14–21.
Hoogenboom, G., 1993. The Georgia automated environmental monitoring network. Southeastern Climate Review 4 (1), 12–18. Kahn, J.M., Katz, R.H., Pister, K.S.J., 2000. Emerging challenges:
mobile networking for“Smart Dust”. Journal of Communications and Networks 2 (3), 188–196.
Kim, J., Bendikov, T.A., Park, Y., Harmon, T.C., 2003a. Networked sensing in support of real-time parameter estimation. European Geological Society–American Geophysical Union–European Union of Geosciences Joint Assembly, April 6–11.
Kim, M., Youn, S.M., Shin, S.H., Jang, J.G., Han, S.H., Hyun, M.S., Gadd, G.M., Kim, H., 2003b. Practical field application of a novel BOD monitoring system. Journal of Environmental Monitoring 5 (4), 640–643.
Lane, A.M.J., 1997. The U.K. Environmental change network database: an integrated information resource for long-term
monitoring and research. Journal of Environmental Management 51 (1), 87–105.
Li, J.C., Wang, S., VanDusen, W.J., Schultz, L.D., George, H.A., Herber, W.K., Chae, H.J., Bentley, W.E., Rao, G., 2000. Green fluorescent protein in Saccharomyces cerevisiae: Real- time studies of the GAL1 promoter. Biotechnology Bioengengineering 70, 187–196.
Li, B., McClendon, R.W., Hoogenboom, G., 2004. Spatial interpola-tion of weather variables for single locainterpola-tions using artificial neural networks. Transactions of the ASAE 47 (2), 629–637.
Martinez, K., Hart, J.K., Ong, R., 2004. Environmental sensor networks. Computer 37 (8), 50–56.
Matsuoka, N., Humlum, O., 2003. Monitoring periglacial processes: new methodology and technology. Permafrost and Periglacial Processes 14 (4), 299–303.
McPhaden, M.J., 2004. Evolution of the 2002–03 El Niño. Bulletin of the American Meteorological Society 85, 677–695.
Melodia, T., Pompili, D., Gungor, V.C., Akyildiz, I.F., 2005. A distributed coordination framework for wireless sensor and actor networks. Proceedings of ACM Mobihoc 2005, Urbana-Cham-paign, Il, USA, pp. 1–12.
Persaud, K.C., 1999. A smart gas sensor for monitoring environmental changes in closed systems: results from the MIR space station. Sensors and Actuators B 2–3 (55), 118–126.
Persaud, K.C., Pisanelli, A.M., Szyszko, S., Reichl, M., Horner, G., Rakow, W., Keding, H.J., Wessels, H., 1999. A smart gas sensor for monitoring environmental changes in closed systems: results from the MIR space station. Sensors and Actuators B: Chemical 55 (2), 118–126.
Phibbs, P., Lentz, S., 2006. Selection of the technical design of the world's first regional cabled observatory—NEPTUNE Stage 1 (NEPTUNE Canada). SSC06-Scientific Submarine Cable 2006. Rahimi, M., Pon, R., Kaiser, W.J., Sukhatme, G.S., Estrin, D.,
Srivastava, M., 2004. Adaptive sampling for environmental robotics. Proceedings of the 2004 IEEE International Conference on Robotics and Automation, pp. 3537–3544.
Rajic, S., Datskos, P.G., 2000. MEMS based calorimetric spectroscopy for chemical detection. NANOSPACE 2000. NASA-JSC, Hous-ton, TX, USA.
Rogers, K.R., 1995. Biosensors for environmental applications. Biosensors and bioelectronics 10, 533–541.
Rogers, K.R., Gerlach, C.L., 1996. Environmental Biosensors, Environmental Science and Technology. http://pubs.acs.org/ hotartcl/est/96/nov/envir.html1996.
Rogers, K.R., Williams, L.R., 1995. Biosensors for environmental monitoring: a regulatory perspective. Trends in Analytical Chemistry 14, 289–294.
Ryan, J.P., Chavez, F.P., Bellingham, J.G., Rienecker, E., Kudela, R., van der Woude, A., Maffione, R., Fischer, A., 2002. Environ-mental processes in the Monterey Bay National Marine Sanctuary: studies integrating AVIRIS and synoptic in situ sensing. Proceedings of the Eleventh JPL Airborne Earth Science Workshop, pp. 307–318.
Scott, WA., Anderson, R., 2003. Temporal and spatial variation in carabid assemblages from the United Kingdom Environmental Change network sites. Biological Conservation 110, 197–210. Shepherd, J.M., Jin, M., 2004. Linkages between the built urban
environment and earth's climate system. EOS 85 (23), 227–228. Shriver-Lake, L.C., Ligler, F.S., 1995. Field screening methods for
Staudigel, H., Helly, J., Koppers, A.A.P., Shaw, H.F., McDonough, W.F., Hofmann, A.W., Langmuir, C.H., Lehnert, K., Sarbas, B., Derry, L.A., Zindler, A., 2003. Electronic data publication in geochemistry. Geochemistry Geophysics Geosystems 4 (art. no. 8004).
Stone, G.W., Zhang, X.P., Li, J., Sheremet, A., 2003. Coastal observing systems: key to the future of coastal dynamics investigations. GCAGS/GCSSEPM Transactions 53, 783–799. Sugimoto, I., Seiyama, M., Nakamura, M., 1999. Detection of
petroleum hydrocarbons at low ppb levels using quartz resonator sensors and instrumentation of a smart environmental monitoring system. Journal of Environmental Monitoring 1 (2), 135–142. Szewczyk, R., Osterweil, E., Polastre, J., Hamilton, M., Mainwaring,
A., Estrin, D., 2004. Habitat monitoring with sensor networks. Communications of the ACM 47 (6), 34–40.
Thorn, C.E., 2003. Making the most of new instrumentation. Permafrost and Periglacial Processes 14 (4), 411–419.
Tomlinson, R.F., 1987. Current and potential uses of geographical information systems, The North American experience. Interna-tional Journal of Geographical Information Systems 1, 203–218. Van Emon, J.M., Lopez-Avila, V., 1992. Immunochemical methods for
environmental analysis. Analytical Chemistry 64, 79A–87A. Warneke, B.A., Pister, K.S.J., 2004. An ultra-low energy
microcon-troller for Smart Dust wireless sensor networks, Solid-State
Circuits Conference. Digest of Technical Papers. ISSCC: IEEE, vol. 1, pp. 316–317.
Werner-Allen, G., Johnson, J., Ruiz, M., Lees, J.M., Welsh, M., 2005. Monitoring volcanic eruptions with a wireless sensor network. Proc. European Workshop on Sensor Networks (EWSN'05), #1568945184.
Wood, L.E., 1946. Automatic weather stations. Journal of the Atmospheric Sciences 3 (4), 115–121.
Xu, N., Rangwala, S., Chintalapudi, K.K., Ganesan, D., Broad, A., Govindan, R., Estrin, D., 2004. A wireless sensor network For structural monitoring. Conference On Embedded Networked Sensor Systems archive Proceedings of the 2nd international conference on Embedded networked sensor systems. Baltimore, MD, USA, 13–24.
Zhang, Y.L., Baptista, A.M., Myers, E.P., 2004. A cross-scale model for 3D baroclinic circulation in estuary-plume-shelf systems: I. Formulation and skill assessment. Continental Shelf Research 24, 2187–2214.
Zhou, J.-Z., Palumbo, A.V., Tiedje, J.M., 1997. Sensitive detection of a novel class of toluene-degrading denitrifiers.Azoarcus tolulyticus