Statistics
in focus
AGRICULTURE AND
FISHERIES
7/2007
Agriculture
Authors
György BENOIST
Pol MARQUER
[image:1.595.4.199.3.497.2]C o n t e n t s
Table 1 – Labour force by size
of the farms………3
Table 2 – Agricultural holdings
by size……….4
Table 3 – Land use by size of
the farms………5
Table 4 – Livestock by size of
the farms………6
Table 5 – Subsistence farming.7
Fa r m s t r u c t u r e i n Sl o v a k i a –
2 0 0 5
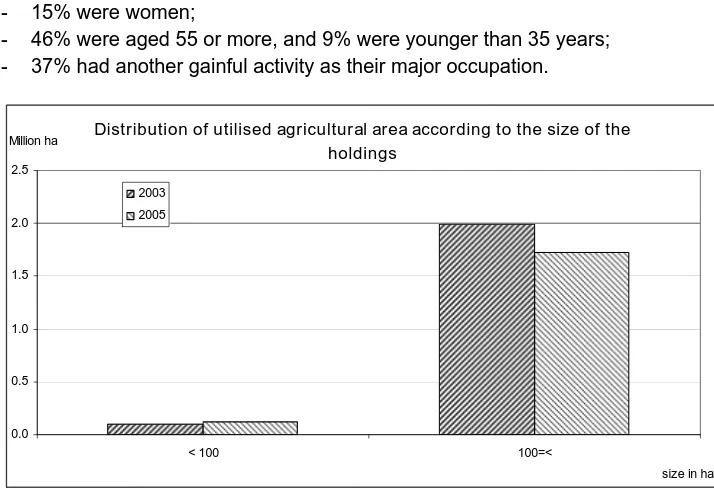
94 % of the utilised agricultural area is
in farms of 100 ha or more
This Statistics in Focus is part of a series of country-specific publications on
the results of the Farm Structure Survey (FSS) 2005. It provides a brief but
nevertheless comprehensive insight into the farm structure in Slovakia. A
similar publication was issued in March 2005 presenting the results of the
FSS 2003 in Slovakia.
* * *
In December 2005 in Slovakia, about 12.9 thousand* agricultural holdings
had an economic size of at least 1 European Size Unit (ESU).
- These holdings employed 66.7 thousand AWUs (annual work units), the
equivalent of 66.7 thousand persons working full time;
- they made use of about 1.8 million ha of agricultural area, which is on
average 143 ha per holding (compared to 172.1 ha in 2003).
Among these 12.9 thousand agricultural holdings
- 50% made use of less than one AWU, while 20% made use of 2 or more
AWUs;
- 50% used less than 5 ha agricultural area, while 16% used 100 ha or
more;
- 24% were holdings of the type specialist cereals, oil seed and protein
crops, 20% were engaged in combined field cropping and grazing
livestock, 14% were specialist general field cropping, 11% were specialist
dairy farming and 7% were mixed cropping;
- 67% of their agricultural area was situated in less favoured or mountain
areas;
- 1% were organic farms;
- 65% were producing mainly for their own consumption;
- 4% benefited from direct investment aid.
Among the 11.2 thousand
sole holders
- 15% were women;
- 46% were aged 55 or more, and 9% were younger than 35 years;
- 37% had another gainful activity as their major occupation.
Distribution of utilised agricultural area according to the size of the
holdings
0.0 0.5 1.0 1.5 2.0 2.5
< 100 100=<
size in ha Million ha
2003 2005
(
#
Manuscript completed on: 21.12.2006 Data extracted on: 04.10.2006 ISSN 1977-0316
Catalogue number: KS-SF-07-007-EN-C © European Communities, 2007
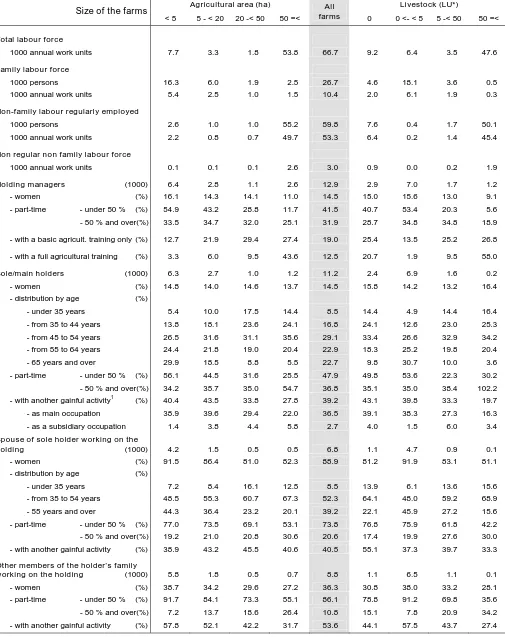
[image:1.595.215.572.510.754.2]Slovakia 2005 – Holdings of at least 1 ESU
Non Family labour force 56300 AWUs
Agricultural labour force
Family labour force 26720 persons of which 40% women
10370 AWUs
Working full time 2220 persons
Working part time 8930 persons
Not working on farm 0 persons
Working full time 280 persons
Working part time 8530 persons
Working full time 36600 persons
Working part time 23160 persons Working full time
380 persons
Working part time 6380 persons
Other family members 8810 persons of which 36% women 2060 AWUs
… regular
59760 persons of which 29% women 53320 AWUs
Holders
11150 persons of which 14% women 5990 AWUs14
Spouses of the sole holders 6760 persons of which 89% women 2320 AWUs
… non regular 2980 AWUs
1 2 3 4
1000 persons
>= 65
55 - 64
45 - 54
35 - 44
< 35
1 2 3
1000 persons
men women
Family labour force
Age (years)
holders spouses other family members
Tractor use by utilised agricultural area categories
0% 20% 40% 60% 80% 100%
<5 5-<20 20-<50 >=50 ha ha
no tracto r
no t-o wned
———————————————————————— 7/2007 — Agriculture and fisheries — St a t i s t i c s i n f o c u s 3
#"
Slovakia – 2005
Table 1 – Labour force by size of the farms
Agricultural area (ha) Livestock (LU*)
Size of the farms
< 5 5 - < 20 20 -< 50 50 =<
All
farms 0 0 <- < 5 5 -< 50 50 =<
Total labour force
1000 annual work units 7.7 3.3 1.8 53.8 66.7 9.2 6.4 3.5 47.6
Family labour force
1000 persons 16.3 6.0 1.9 2.5 26.7 4.6 18.1 3.6 0.5
1000 annual work units 5.4 2.5 1.0 1.5 10.4 2.0 6.1 1.9 0.3
Non-family labour regularly employed
1000 persons 2.6 1.0 1.0 55.2 59.8 7.6 0.4 1.7 50.1
1000 annual work units 2.2 0.8 0.7 49.7 53.3 6.4 0.2 1.4 45.4
Non regular non family labour force
1000 annual work units 0.1 0.1 0.1 2.6 3.0 0.9 0.0 0.2 1.9
Holding managers (1000) 6.4 2.8 1.1 2.6 12.9 2.9 7.0 1.7 1.2
- women (%) 16.1 14.3 14.1 11.0 14.5 15.0 15.6 13.0 9.1
- part-time - under 50 % (%) 54.9 43.2 28.8 11.7 41.5 40.7 53.4 20.3 5.6
- 50 % and over(%) 33.5 34.7 32.0 25.1 31.9 28.7 34.8 34.8 18.9
- with a basic agricult. training only (%) 12.7 21.9 29.4 27.4 19.0 25.4 13.5 25.2 26.8
- with a full agricultural training (%) 3.3 6.0 9.5 43.6 12.5 20.7 1.9 9.5 58.0
Sole/main holders (1000) 6.3 2.7 1.0 1.2 11.2 2.4 6.9 1.6 0.2
- women (%) 14.8 14.0 14.6 13.7 14.5 15.8 14.2 13.2 16.4
- distribution by age (%)
- under 35 years 5.4 10.0 17.5 14.4 8.5 14.4 4.9 14.4 16.4
- from 35 to 44 years 13.8 18.1 23.6 24.1 16.8 24.1 12.6 23.0 25.3
- from 45 to 54 years 26.5 31.6 31.1 35.6 29.1 33.4 26.6 32.9 34.2
- from 55 to 64 years 24.4 21.8 19.0 20.4 22.9 18.3 25.2 19.8 20.4
- 65 years and over 29.9 18.5 8.8 5.5 22.7 9.8 30.7 10.0 3.6
- part-time - under 50 % (%) 56.1 44.5 31.6 25.5 47.9 49.8 53.6 22.3 30.2
- 50 % and over(%) 34.2 35.7 35.0 54.7 36.8 35.1 35.0 38.4 102.2
- with another gainful activity1 (%) 40.4 43.5 33.8 27.8 39.2 43.1 39.8 33.3 19.7
- as main occupation 38.9 39.6 29.4 22.0 36.5 39.1 38.3 27.3 16.3
- as a subsidiary occupation 1.4 3.8 4.4 5.8 2.7 4.0 1.5 6.0 3.4
Spouse of sole holder working on the
holding (1000) 4.2 1.5 0.5 0.5 6.8 1.1 4.7 0.9 0.1
- women (%) 91.5 86.4 81.0 82.3 88.9 81.2 91.9 83.1 81.1
- distribution by age (%)
- under 35 years 7.2 8.4 16.1 12.5 8.5 13.9 6.1 13.6 15.6
- from 35 to 54 years 48.5 55.3 60.7 67.3 52.3 64.1 48.0 59.2 68.9
- 55 years and over 44.3 36.4 23.2 20.1 39.2 22.1 45.9 27.2 15.6
- part-time - under 50 % (%) 77.0 73.5 69.1 53.1 73.8 76.8 75.9 61.8 42.2
- 50 % and over(%) 19.2 21.0 20.8 30.6 20.6 17.4 19.9 27.6 30.0
- with another gainful activity (%) 38.9 43.2 45.5 40.6 40.5 55.1 37.3 39.7 33.3
Other members of the holder’s family
working on the holding (1000) 5.8 1.8 0.5 0.7 8.8 1.1 6.5 1.1 0.1
- women (%) 38.7 34.2 29.6 27.2 36.3 30.8 38.0 33.2 28.1
- part-time - under 50 % (%) 91.7 84.1 73.3 55.1 86.1 78.8 91.2 69.8 35.6
- 50 % and over(%) 7.2 13.7 18.6 26.4 10.8 15.1 7.8 20.9 34.2
- with another gainful activity (%) 57.8 52.1 42.2 31.7 53.6 44.1 57.5 43.7 27.4
Symbols : not available 0 less than half of the unit or nil * LU = Livestock Unit
1
[image:3.595.47.552.103.740.2]4 St a t i s t i c s i n f o c u s — Agriculture and fisheries — 7/2007 —————————————————————————
#
Slovakia – 2005
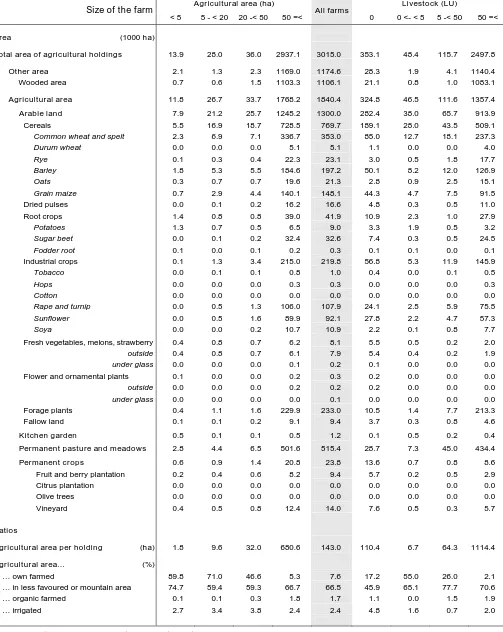
Table 2 – Agricultural holdings by size
Agricultural area (ha) Livestock (LU)
Size of the farms
< 5 5 - < 20 20 -< 50 50 =<
All
farms 0 0 <- < 5 5 -< 50 50 =<
Holdings
- total number (1000) 6.4 2.8 1.1 2.6 12.9 2.9 7.0 1.7 1.2
- by legal personality of the holder (%)
- sole holder 97.9 97.1 91.3 45.8 86.7 81.7 99.6 90.7 18.5
- legal person 2.1 2.9 8.7 54.2 13.3 18.3 0.4 9.3 81.5
- group holders 0.0 0.0 0.0 0.0 0.0 0.0 0.0 0.0 0.0
- by employed labour force (%)
- under 1 AWU 63.1 55.2 40.4 14.0 49.6 50.8 62.2 29.6 3.5
- from 1 to less than 2 AWU 29.7 35.7 42.0 19.4 30.0 26.1 31.9 46.2 5.3
- from 2 to less than 3 AWU 5.1 6.6 10.8 9.3 6.7 7.2 5.4 13.0 4.3
- 3 AWU and over 2.1 2.5 6.7 57.2 13.7 15.9 0.6 11.2 86.9
- by economic size (%)
- from 1 to less than 8 ESU 97.8 93.0 56.0 7.0 75.0 56.3 97.2 68.6 2.2
- from 8 to less than 16 ESU 0.7 5.8 31.0 10.9 6.3 13.0 1.4 16.4 4.3
- from 16 to less than 40 ESU 0.5 1.0 11.3 24.1 6.2 13.4 1.0 10.3 13.2
- from 40 to less than 100 ESU 0.4 0.1 1.2 21.2 4.6 10.1 0.3 3.0 18.6
- 100 ESU and over 0.6 0.1 0.5 36.7 7.8 7.3 0.1 1.7 61.7
- by farm type (%)
- specialist cereals, oil seed and protein
crops 5.2 42.1 53.5 39.9 24.1 47.1 16.4 23.0 14.3
- field crops – grazing livestock combined 24.3 14.3 7.3 18.0 19.5 0.9 26.2 15.9 31.0
- general field cropping 12.9 17.7 16.9 10.7 13.8 21.8 13.7 7.3 4.5
- specialist dairy farming 16.8 3.7 2.6 5.7 10.6 0.0 15.3 8.6 11.8
- mixed cropping 7.8 8.2 3.6 4.8 6.9 4.1 8.4 6.0 6.5
- other types of farming 33.1 14.0 16.1 21.1 25.1 26.1 20.0 39.1 31.9
- by farming methods (%)
- organic farming 0.0 0.1 0.4 2.2 0.5 0.7 0.0 0.4 3.1
- irrigating 7.3 9.6 8.2 11.5 8.7 17.9 5.9 4.3 9.2
- with fixed irrigation equipment 1.5 2.7 1.9 5.9 2.7 5.1 1.2 0.7 8.0
- with crops under glass 4.2 2.4 1.2 1.1 2.9 6.3 2.4 1.1 0.5
- benefiting of direct investment aids 0.1 0.3 1.7 16.9 3.7 2.3 0.1 4.8 25.9
- using a tractor (%) 46.2 73.8 84.5 90.5 64.3 64.3 56.4 77.8 90.0
- with their own tractor 44.3 68.6 78.2 87.1 61.0 59.0 54.0 73.6 87.6
- using a combine harvester (%) 3.9 17.0 32.6 55.0 19.4 22.7 8.6 26.3 63.5
- with another gainful activity than agricultural
production (%) 2.7 10.1 16.7 27.1 10.4 15.9 3.0 15.4 32.2
- tourism 0.2 0.6 1.5 2.5 0.8 0.7 0.2 2.2 3.0
- handicraft 0.1 0.9 0.8 1.2 0.6 0.6 0.2 0.9 1.7
- processing of farm products 0.6 1.2 2.4 6.6 2.1 2.9 0.3 2.1 10.0
- wood processing 0.2 0.7 1.0 1.2 0.6 0.6 0.2 1.4 0.9
- aquaculture 0.0 0.1 0.1 0.2 0.1 0.1 0.0 0.1 0.3
- renewable energy production 0.0 0.1 0.1 0.2 0.1 0.1 0.0 0.1 0.2
- contractual work 0.4 2.6 5.4 12.7 3.8 5.1 0.8 4.8 16.1
- other gainful activities n.a.e. 1.8 5.7 8.3 13.9 5.6 8.6 1.7 7.4 18.1
[image:4.595.45.551.103.743.2]———————————————————————— 7/2007 — Agriculture and fisheries — St a t i s t i c s i n f o c u s 5
#"
Slovakia – 2005
Table 3 – Land use by size of the farms
Agricultural area (ha) Livestock (LU)
Size of the farm
< 5 5 - < 20 20 -< 50 50 =< All farms 0 0 <- < 5 5 -< 50 50 =<
Area (1000 ha)
Total area of agricultural holdings 13.9 28.0 36.0 2937.1 3015.0 353.1 48.4 115.7 2497.8
Other area 2.1 1.3 2.3 1169.0 1174.6 28.3 1.9 4.1 1140.4
Wooded area 0.7 0.6 1.5 1103.3 1106.1 21.1 0.8 1.0 1083.1
Agricultural area 11.8 26.7 33.7 1768.2 1840.4 324.8 46.5 111.6 1357.4
Arable land 7.9 21.2 25.7 1245.2 1300.0 282.4 38.0 65.7 913.9
Cereals 5.5 16.9 18.7 728.5 769.7 189.1 28.0 43.5 509.1
Common wheat and spelt 2.3 6.9 7.1 336.7 353.0 85.0 12.7 18.1 237.3
Durum wheat 0.0 0.0 0.0 5.1 5.1 1.1 0.0 0.0 4.0
Rye 0.1 0.3 0.4 22.3 23.1 3.0 0.5 1.8 17.7
Barley 1.8 5.3 5.5 184.6 197.2 50.1 8.2 12.0 126.9
Oats 0.3 0.7 0.7 19.6 21.3 2.8 0.9 2.5 15.1
Grain maize 0.7 2.9 4.4 140.1 148.1 44.3 4.7 7.5 91.5
Dried pulses 0.0 0.1 0.2 16.2 16.6 4.8 0.3 0.5 11.0
Root crops 1.4 0.8 0.8 39.0 41.9 10.9 2.3 1.0 27.9
Potatoes 1.3 0.7 0.5 6.5 9.0 3.3 1.9 0.5 3.2
Sugar beet 0.0 0.1 0.2 32.4 32.6 7.4 0.3 0.5 24.5
Fodder root 0.1 0.0 0.1 0.2 0.3 0.1 0.1 0.0 0.1
Industrial crops 0.1 1.3 3.4 215.0 219.8 56.8 5.3 11.9 145.9
Tobacco 0.0 0.1 0.1 0.8 1.0 0.4 0.0 0.1 0.5
Hops 0.0 0.0 0.0 0.3 0.3 0.0 0.0 0.0 0.3
Cotton 0.0 0.0 0.0 0.0 0.0 0.0 0.0 0.0 0.0
Rape and turnip 0.0 0.5 1.3 106.0 107.9 24.1 2.5 5.9 75.5
Sunflower 0.0 0.5 1.6 89.9 92.1 27.8 2.2 4.7 57.3
Soya 0.0 0.0 0.2 10.7 10.9 2.2 0.1 0.8 7.7
Fresh vegetables, melons, strawberry 0.4 0.8 0.7 6.2 8.1 5.5 0.5 0.2 2.0
outside 0.4 0.8 0.7 6.1 7.9 5.4 0.4 0.2 1.9
under glass 0.0 0.0 0.0 0.1 0.2 0.1 0.0 0.0 0.0
Flower and ornamental plants 0.1 0.0 0.0 0.2 0.3 0.2 0.0 0.0 0.0
outside 0.0 0.0 0.0 0.2 0.2 0.2 0.0 0.0 0.0
under glass 0.0 0.0 0.0 0.0 0.1 0.0 0.0 0.0 0.0
Forage plants 0.4 1.1 1.6 229.9 233.0 10.5 1.4 7.7 213.3
Fallow land 0.1 0.1 0.2 9.1 9.4 3.7 0.3 0.8 4.6
Kitchen garden 0.5 0.1 0.1 0.5 1.2 0.1 0.5 0.2 0.4
Permanent pasture and meadows 2.8 4.4 6.5 501.6 515.4 28.7 7.3 45.0 434.4
Permanent crops 0.6 0.9 1.4 20.8 23.8 13.6 0.7 0.8 8.6
Fruit and berry plantation 0.2 0.4 0.6 8.2 9.4 5.7 0.2 0.5 2.9
Citrus plantation 0.0 0.0 0.0 0.0 0.0 0.0 0.0 0.0 0.0
Olive trees 0.0 0.0 0.0 0.0 0.0 0.0 0.0 0.0 0.0
Vineyard 0.4 0.5 0.8 12.4 14.0 7.6 0.5 0.3 5.7
Ratios
Agricultural area per holding (ha) 1.8 9.6 32.0 680.6 143.0 110.4 6.7 64.3 1114.4
Agricultural area… (%)
… own farmed 89.8 71.0 46.6 5.3 7.6 17.2 55.0 26.0 2.1
… in less favoured or mountain area 74.7 59.4 59.3 66.7 66.5 45.9 65.1 77.7 70.6
… organic farmed 0.1 0.1 0.3 1.8 1.7 1.1 0.0 1.5 1.9
… irrigated 2.7 3.4 3.8 2.4 2.4 4.8 1.6 0.7 2.0
[image:5.595.49.552.104.736.2]6 St a t i s t i c s i n f o c u s — Agriculture and fisheries — 7/2007 —————————————————————————
#
Slovakia – 2005
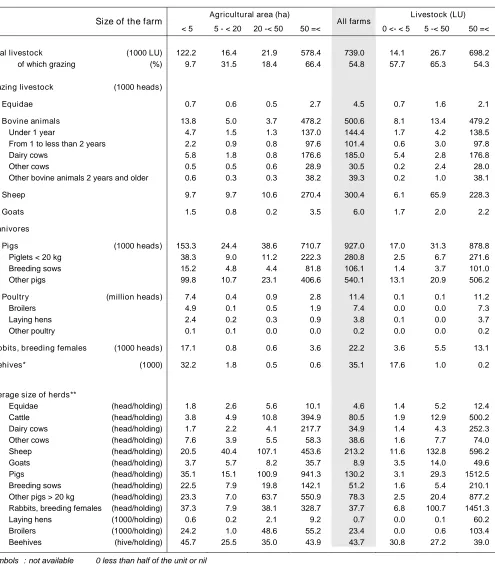
Table 4 – Livestock by size of the farms
Agricultural area (ha) Livestock (LU)
Size of the farm
< 5 5 - < 20 20 -< 50 50 =< All farms 0 <- < 5 5 -< 50 50 =<
Total livestock (1000 LU) 122.2 16.4 21.9 578.4 739.0 14.1 26.7 698.2
of which grazing (%) 9.7 31.5 18.4 66.4 54.8 57.7 65.3 54.3
Grazing livestock (1000 heads)
Equidae 0.7 0.6 0.5 2.7 4.5 0.7 1.6 2.1
Bovine animals 13.8 5.0 3.7 478.2 500.6 8.1 13.4 479.2
Under 1 year 4.7 1.5 1.3 137.0 144.4 1.7 4.2 138.5
From 1 to less than 2 years 2.2 0.9 0.8 97.6 101.4 0.6 3.0 97.8
Dairy cows 5.8 1.8 0.8 176.6 185.0 5.4 2.8 176.8
Other cows 0.5 0.5 0.6 28.9 30.5 0.2 2.4 28.0
Other bovine animals 2 years and older 0.6 0.3 0.3 38.2 39.3 0.2 1.0 38.1
Sheep 9.7 9.7 10.6 270.4 300.4 6.1 65.9 228.3
Goats 1.5 0.8 0.2 3.5 6.0 1.7 2.0 2.2
Granivores
Pigs (1000 heads) 153.3 24.4 38.6 710.7 927.0 17.0 31.3 878.8
Piglets < 20 kg 38.3 9.0 11.2 222.3 280.8 2.5 6.7 271.6
Breeding sows 15.2 4.8 4.4 81.8 106.1 1.4 3.7 101.0
Other pigs 99.8 10.7 23.1 406.6 540.1 13.1 20.9 506.2
Poultry (million heads) 7.4 0.4 0.9 2.8 11.4 0.1 0.1 11.2
Broilers 4.9 0.1 0.5 1.9 7.4 0.0 0.0 7.3
Laying hens 2.4 0.2 0.3 0.9 3.8 0.1 0.0 3.7
Other poultry 0.1 0.1 0.0 0.0 0.2 0.0 0.0 0.2
Rabbits, breeding females (1000 heads) 17.1 0.8 0.6 3.6 22.2 3.6 5.5 13.1
Beehives* (1000) 32.2 1.8 0.5 0.6 35.1 17.6 1.0 0.2
Average size of herds**
Equidae (head/holding) 1.8 2.6 5.6 10.1 4.6 1.4 5.2 12.4
Cattle (head/holding) 3.8 4.9 10.8 394.9 80.5 1.9 12.9 500.2
Dairy cows (head/holding) 1.7 2.2 4.1 217.7 34.9 1.4 4.3 252.3
Other cows (head/holding) 7.6 3.9 5.5 58.3 38.6 1.6 7.7 74.0
Sheep (head/holding) 20.5 40.4 107.1 453.6 213.2 11.6 132.8 596.2
Goats (head/holding) 3.7 5.7 8.2 35.7 8.9 3.5 14.0 49.6
Pigs (head/holding) 35.1 15.1 100.9 941.3 130.2 3.1 29.3 1512.5
Breeding sows (head/holding) 22.5 7.9 19.8 142.1 51.2 1.6 5.4 210.1
Other pigs > 20 kg (head/holding) 23.3 7.0 63.7 550.9 78.3 2.5 20.4 877.2
Rabbits, breeding females (head/holding) 37.3 7.9 38.1 328.7 37.7 6.8 100.7 1451.3
Laying hens (1000/holding) 0.6 0.2 2.1 9.2 0.7 0.0 0.1 60.2
Broilers (1000/holding) 24.2 1.0 48.6 55.2 23.4 0.0 0.6 103.4
Beehives (hive/holding) 45.7 25.5 35.0 43.9 43.7 30.8 27.2 39.0
Symbols : not available 0 less than half of the unit or nil
[image:6.595.55.550.93.658.2]Slovakia – 2005
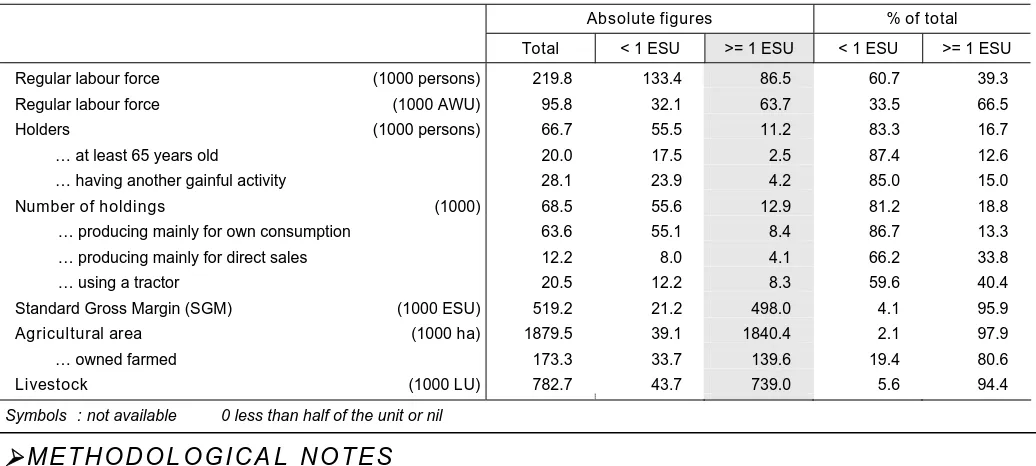
Table 5 – Subsistence farming
Absolute figures % of total
Total < 1 ESU >= 1 ESU < 1 ESU >= 1 ESU
Regular labour force (1000 persons) 219.8 133.4 86.5 60.7 39.3
Regular labour force (1000 AWU) 95.8 32.1 63.7 33.5 66.5
Holders (1000 persons) 66.7 55.5 11.2 83.3 16.7
… at least 65 years old 20.0 17.5 2.5 87.4 12.6
… having another gainful activity 28.1 23.9 4.2 85.0 15.0
Number of holdings (1000) 68.5 55.6 12.9 81.2 18.8
… producing mainly for own consumption 63.6 55.1 8.4 86.7 13.3
… producing mainly for direct sales 12.2 8.0 4.1 66.2 33.8
… using a tractor 20.5 12.2 8.3 59.6 40.4
Standard Gross Margin (SGM) (1000 ESU) 519.2 21.2 498.0 4.1 95.9
Agricultural area (1000 ha) 1879.5 39.1 1840.4 2.1 97.9
… owned farmed 173.3 33.7 139.6 19.4 80.6
Livestock (1000 LU) 782.7 43.7 739.0 5.6 94.4
Symbols : not available 0 less than half of the unit or nil
ME T H O D O L O G I C A L N O T E S
"
The survey on the structure of agricultural holdings in Slovakia was
carried out in December 2005 using a combined method (exhaustive
and sample). The previous full-scale agricultural census was
conducted in 2001. The reference period of the FSS 2005 was the
calendar year 2005; however in case of livestock and land area the
reference time was 31 December 2005.
A holding is defined as a technically and economically independent
unit under independent management, which produces agricultural
products. However it can provide services or can produce other
non-agricultural products as well. The target population was all registered
and non-registered units reaching certain thresholds (e.g. 0.5 ha
UAA, 0.15 ha intensive crops, 1 cattle, 2 pigs, etc). All registered
units (about 18 600) and non-registered units over 1 ha utilised
agricultural area (about 14 500) were observed. From the remaining,
non-registered units, a random sample, stratified by regions was
drawn (about 9300 units). The sampling fraction was about 19%.
For each activity (`enterprise`) on a farm (for instance wheat, dairy
cow or vineyard), a standard gross margin (SGM) is estimated,
based on the area (or the number of heads) and a regional
coefficient. The sum of such margins in a farm is its economic size,
expressed in European Size Units (ESU). 1 ESU is equal to 1200
euros.
Each farm is classified in the community typology by its economic
size and its type of farming, depending on the share of each
enterprise in its economic size. For instance, a farm where breeding
sows account for more than 2/3 of the economic size, is classified as
specialist pig rearing
(type 5011). Depending on the level of
aggregation, farms are grouped into 8 to 70 types.
Annual work unit (AWU) is equivalent to a worker employed on a
full time basis for one year. In Slovakia it is 1800 hours (225 working
days of 8 working hours per day).
Livestock Unit (LU) is equivalent to a dairy cow. The number of
animals (number of heads) is converted into LU using a set of
coefficients reflecting the feed requirements of the different animal
categories.
Subsistence farming refers here to all farms below 1 ESU
economic size. Note that the number of farms cannot be compared
between countries due to the differences in coverage of FSS.
R E F E R E N C E P U B L I C A T I O N S
Komplexné výsledky - I. (Complete results - I.), Statistical Office of
the Slovak Republic, Bratislava, November 2006.
Komplexné výsledky - II. (Complete results - II-), Statistical Office of
the Slovak Republic, Bratislava, November 2006
Typológia fariem (Typology of farms), Statistical Office of the Slovak
Republic, Bratislava, November 2006
Website of the Statistical Office of the Slovak Republic (
Š
tatistický
úrad Slovenskej Republiky)
www.statistics.sk
National Methodological Report – FSS 2005 (available on request)
———————————————————————— 7/2007 — Agriculture and fisheries — St a t i s t i c s i n f o c u s 7
[image:7.595.40.558.98.331.2]