Statistics
in focus
AGRICULTURE AND
FISHERIES
18/2006
Agriculture
Authors
György
BENOIST
Pol MARQUER
[image:1.595.4.199.3.496.2]C o n t e n t s
Table 1 – Labour force by size
of the farms………3
Table 2 – Agricultural holdings
by size……….4
Table 3 – Land use by size of
the farms………5
[image:1.595.215.568.479.678.2]Table 4 – Livestock by size of
the farms………6
Table 5 – Subsistence farming..7
Fa r m s t r u c t u r e i n De n m a r k – 2 0 0 5
53% of the agricultural land and 58% of the
livestock are in farms of 100 ha or more
This Statistics in Focus is part of a series of country-specific publications on
the results of the Farm Structure Survey (FSS) 2005. It provides a brief but
nevertheless comprehensive insight into the farm structure in Denmark. A
similar publication was issued in November 2004 presenting the results of the
FSS 2003 in Denmark.
* * *
In June 2005 in Denmark, about 48.1 thousand* agricultural holdings had
an economic size of at least 1 European Size Unit (ESU).
- These holdings employed 58.4 thousand AWUs (annual work units), the
equivalent of 58.4 thousand persons working full time;
- they made use of about 2.6 million ha of agricultural area, which is on
average 53.8 ha per holding (compared to 54.7 ha in 2003).
Among these 48.1 thousand agricultural holdings
- 54% made use of less than one AWU, while 20% made use of 2 or more
AWUs;
- 9% used less than 5 ha agricultural area, while 15% used 100 ha or more;
- 39% were holdings of the type specialist cereals, oil seed and protein
crops, 18% general field cropping, 11% were specialist dairy farms,
8% engaged in combined field cropping and grazing livestock and 7% had
various crops and livestock combined;
- 5% were organic farms;
- 31% benefited from direct investment aid.
Among the 47.7 thousand
sole holders
- 11% were women;
- 42% were aged 55 or more, and only 7% were younger than 35 years;
- 39% had another gainful activity as their major occupation.
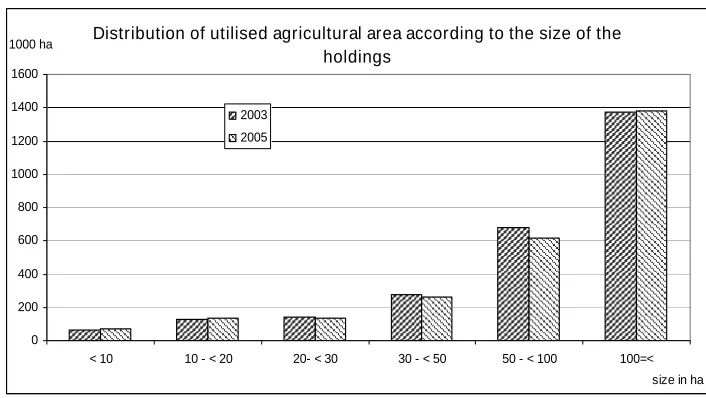
Distribution of utilised agricultural area according to the size of the
holdings
0 200 400 600 800 1000 1200 1400 1600
< 10 10 - < 20 20- < 30 30 - < 50 50 - < 100 100=< size in ha 1000 ha
2003 2005
Due to differences in the threshold across Member States, the total number of farms is
not comparable between countries. This is why the present analysis, including Tables
1-4 and the graphs focus on holdings of at least one ESU. See methodological notes
for more information on the concept of the ESU.
(
#
Manuscript completed on: 18.09.2006 Data extracted on: 19.06.2006 ISSN 1562-1340
3 6 9 12
1000 persons
>= 65 55 - 64 45 - 54 35 - 44 < 35
3 6 9
1000 persons
men women
Family labour force
Age (years)
holders spouses other family members
Tractor use by utilised agricultural area categories
0% 20% 40% 60% 80% 100%
< 20 20 - < 50 50 - < 100 >= 100 ha no tracto r
no t-o wned o wn
Non Family labour force 22030 AWUs
Agricultural labour force
Family labour force 69200 persons of which 28% women
36370 AWUs
Working full time 18830 persons
Working part time 28350 persons
Not working on farm 560 persons
Working full time 1310 persons
Working part time 5610 persons
Working full time 17320 persons
Working part time 6000 persons Working full time
3040 persons
Working part time 11500 persons
Other family members 6920 persons of which 22% women 2580 AWUs
… regular
23320 persons of which 24% women 19960 AWUs
Holders
47730 persons of which 11% women 27540 AWUs11
Spouses of the sole holders 14540 persons of which 86% women 6250 AWUs
… non regular 2080 AWUs
———————————————————————— 18/2006 — Agriculture and fisheries — St a t i s t i c s i n f o c u s 3
#"
Denmark – 2005
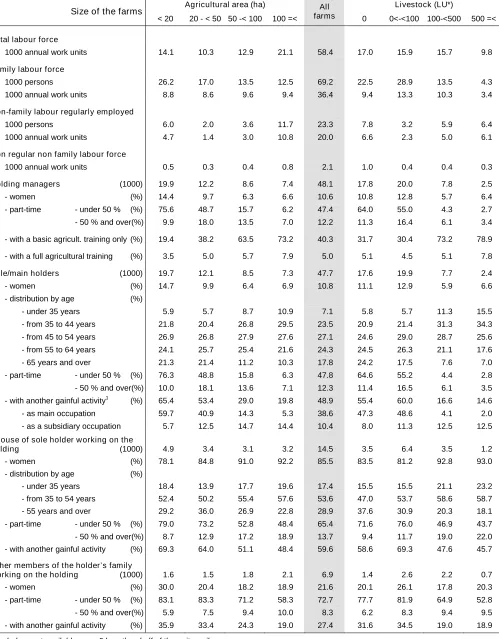
Table 1 – Labour force by size of the farms
Agricultural area (ha) Livestock (LU*)
Size of the farms
< 20 20 - < 50 50 -< 100 100 =<
All
farms 0 0<-<100 100-<500 500 =<
Total labour force
1000 annual work units 14.1 10.3 12.9 21.1 58.4 17.0 15.9 15.7 9.8
Family labour force
1000 persons 26.2 17.0 13.5 12.5 69.2 22.5 28.9 13.5 4.3
1000 annual work units 8.8 8.6 9.6 9.4 36.4 9.4 13.3 10.3 3.4
Non-family labour regularly employed
1000 persons 6.0 2.0 3.6 11.7 23.3 7.8 3.2 5.9 6.4
1000 annual work units 4.7 1.4 3.0 10.8 20.0 6.6 2.3 5.0 6.1
Non regular non family labour force
1000 annual work units 0.5 0.3 0.4 0.8 2.1 1.0 0.4 0.4 0.3
Holding managers (1000) 19.9 12.2 8.6 7.4 48.1 17.8 20.0 7.8 2.5
- women (%) 14.4 9.7 6.3 6.6 10.6 10.8 12.8 5.7 6.4
- part-time - under 50 % (%) 75.6 48.7 15.7 6.2 47.4 64.0 55.0 4.3 2.7
- 50 % and over(%) 9.9 18.0 13.5 7.0 12.2 11.3 16.4 6.1 3.4
- with a basic agricult. training only (%) 19.4 38.2 63.5 73.2 40.3 31.7 30.4 73.2 78.9
- with a full agricultural training (%) 3.5 5.0 5.7 7.9 5.0 5.1 4.5 5.1 7.8
Sole/main holders (1000) 19.7 12.1 8.5 7.3 47.7 17.6 19.9 7.7 2.4
- women (%) 14.7 9.9 6.4 6.9 10.8 11.1 12.9 5.9 6.6
- distribution by age (%)
- under 35 years 5.9 5.7 8.7 10.9 7.1 5.8 5.7 11.3 15.5
- from 35 to 44 years 21.8 20.4 26.8 29.5 23.5 20.9 21.4 31.3 34.3
- from 45 to 54 years 26.9 26.8 27.9 27.6 27.1 24.6 29.0 28.7 25.6
- from 55 to 64 years 24.1 25.7 25.4 21.6 24.3 24.5 26.3 21.1 17.6
- 65 years and over 21.3 21.4 11.2 10.3 17.8 24.2 17.5 7.6 7.0
- part-time - under 50 % (%) 76.3 48.8 15.8 6.3 47.8 64.6 55.2 4.4 2.8
- 50 % and over(%) 10.0 18.1 13.6 7.1 12.3 11.4 16.5 6.1 3.5
- with another gainful activity1 (%) 65.4 53.4 29.0 19.8 48.9 55.4 60.0 16.6 14.6
- as main occupation 59.7 40.9 14.3 5.3 38.6 47.3 48.6 4.1 2.0
- as a subsidiary occupation 5.7 12.5 14.7 14.4 10.4 8.0 11.3 12.5 12.5
Spouse of sole holder working on the
holding (1000) 4.9 3.4 3.1 3.2 14.5 3.5 6.4 3.5 1.2
- women (%) 78.1 84.8 91.0 92.2 85.5 83.5 81.2 92.8 93.0
- distribution by age (%)
- under 35 years 18.4 13.9 17.7 19.6 17.4 15.5 15.5 21.1 23.2
- from 35 to 54 years 52.4 50.2 55.4 57.6 53.6 47.0 53.7 58.6 58.7
- 55 years and over 29.2 36.0 26.9 22.8 28.9 37.6 30.9 20.3 18.1
- part-time - under 50 % (%) 79.0 73.2 52.8 48.4 65.4 71.6 76.0 46.9 43.7
- 50 % and over(%) 8.7 12.9 17.2 18.9 13.7 9.4 11.7 19.0 22.0
- with another gainful activity (%) 69.3 64.0 51.1 48.4 59.6 58.6 69.3 47.6 45.7
Other members of the holder’s family
working on the holding (1000) 1.6 1.5 1.8 2.1 6.9 1.4 2.6 2.2 0.7
- women (%) 30.0 20.4 18.2 18.9 21.6 20.1 26.1 17.8 20.3
- part-time - under 50 % (%) 83.1 83.3 71.2 58.3 72.7 77.7 81.9 64.9 52.8
- 50 % and over(%) 5.9 7.5 9.4 10.0 8.3 6.2 8.3 9.4 9.5
- with another gainful activity (%) 35.9 33.4 24.3 19.0 27.4 31.6 34.5 19.0 18.9
Symbols : not available 0 less than half of the unit or nil * LU = Livestock Unit
1
[image:3.595.52.551.103.742.2]4 St a t i s t i c s i n f o c u s — Agriculture and fisheries — 18/2006 —————————————————————————
#
Denmark – 2005
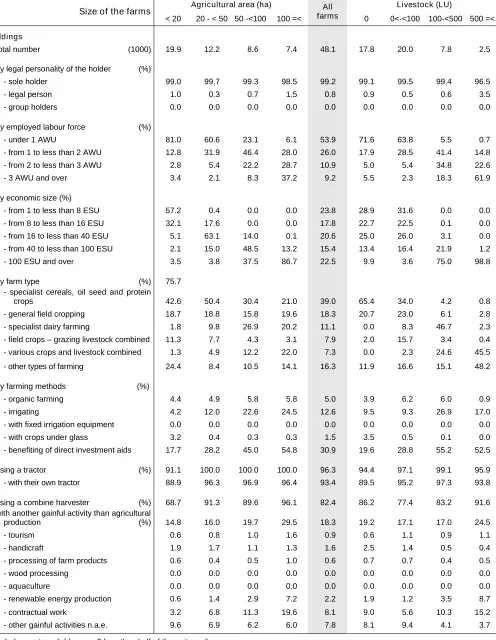
Table 2 – Agricultural holdings by size
Agricultural area (ha) Livestock (LU)
Size of the farms
< 20 20 - < 50 50 -<100 100 =<
All
farms 0 0<-<100 100-<500 500 =<
Holdings
- total number (1000) 19.9 12.2 8.6 7.4 48.1 17.8 20.0 7.8 2.5
- by legal personality of the holder (%)
- sole holder 99.0 99.7 99.3 98.5 99.2 99.1 99.5 99.4 96.5
- legal person 1.0 0.3 0.7 1.5 0.8 0.9 0.5 0.6 3.5
- group holders 0.0 0.0 0.0 0.0 0.0 0.0 0.0 0.0 0.0
- by employed labour force (%)
- under 1 AWU 81.0 60.6 23.1 6.1 53.9 71.6 63.8 5.5 0.7
- from 1 to less than 2 AWU 12.8 31.9 46.4 28.0 26.0 17.9 28.5 41.4 14.8
- from 2 to less than 3 AWU 2.8 5.4 22.2 28.7 10.9 5.0 5.4 34.8 22.6
- 3 AWU and over 3.4 2.1 8.3 37.2 9.2 5.5 2.3 18.3 61.9
- by economic size (%)
- from 1 to less than 8 ESU 57.2 0.4 0.0 0.0 23.8 28.9 31.6 0.0 0.0
- from 8 to less than 16 ESU 32.1 17.6 0.0 0.0 17.8 22.7 22.5 0.1 0.0
- from 16 to less than 40 ESU 5.1 63.1 14.0 0.1 20.6 25.0 26.0 3.1 0.0
- from 40 to less than 100 ESU 2.1 15.0 48.5 13.2 15.4 13.4 16.4 21.9 1.2
- 100 ESU and over 3.5 3.8 37.5 86.7 22.5 9.9 3.6 75.0 98.8
- by farm type (%) 75.7
- specialist cereals, oil seed and protein
crops 42.6 50.4 30.4 21.0 39.0 65.4 34.0 4.2 0.8
- general field cropping 18.7 18.8 15.8 19.6 18.3 20.7 23.0 6.1 2.8
- specialist dairy farming 1.8 9.8 26.9 20.2 11.1 0.0 8.3 46.7 2.3
- field crops – grazing livestock combined 11.3 7.7 4.3 3.1 7.9 2.0 15.7 3.4 0.4
- various crops and livestock combined 1.3 4.9 12.2 22.0 7.3 0.0 2.3 24.6 45.5
- other types of farming 24.4 8.4 10.5 14.1 16.3 11.9 16.6 15.1 48.2
- by farming methods (%)
- organic farming 4.4 4.9 5.8 5.8 5.0 3.9 6.2 6.0 0.9
- irrigating 4.2 12.0 22.6 24.5 12.6 9.5 9.3 26.9 17.0
- with fixed irrigation equipment 0.0 0.0 0.0 0.0 0.0 0.0 0.0 0.0 0.0
- with crops under glass 3.2 0.4 0.3 0.3 1.5 3.5 0.5 0.1 0.0
- benefiting of direct investment aids 17.7 28.2 45.0 54.8 30.9 19.6 28.8 55.2 52.5
- using a tractor (%) 91.1 100.0 100.0 100.0 96.3 94.4 97.1 99.1 95.9
- with their own tractor 88.9 96.3 96.9 96.4 93.4 89.5 95.2 97.3 93.8
- using a combine harvester (%) 68.7 91.3 89.6 96.1 82.4 86.2 77.4 83.2 91.6
- with another gainful activity than agricultural
production (%) 14.8 16.0 19.7 29.5 18.3 19.2 17.1 17.0 24.5
- tourism 0.6 0.8 1.0 1.6 0.9 0.6 1.1 0.9 1.1
- handicraft 1.9 1.7 1.1 1.3 1.6 2.5 1.4 0.5 0.4
- processing of farm products 0.6 0.4 0.5 1.0 0.6 0.7 0.7 0.4 0.5
- wood processing 0.0 0.0 0.0 0.0 0.0 0.0 0.0 0.0 0.0
- aquaculture 0.0 0.0 0.0 0.0 0.0 0.0 0.0 0.0 0.0
- renewable energy production 0.6 1.4 2.9 7.2 2.2 1.9 1.2 3.5 8.7
- contractual work 3.2 6.8 11.3 19.6 8.1 9.0 5.6 10.3 15.2
- other gainful activities n.a.e. 9.6 6.9 6.2 6.0 7.8 8.1 9.4 4.1 3.7
[image:4.595.54.550.103.743.2]———————————————————————— 18/2006 — Agriculture and fisheries — St a t i s t i c s i n f o c u s 5
#"
Denmark – 2005
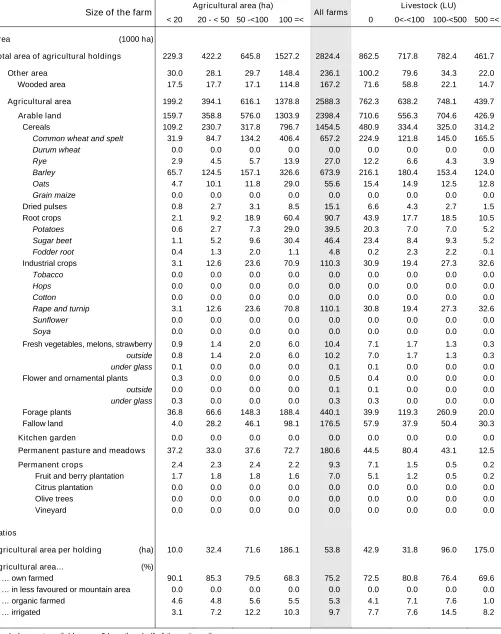
Table 3 – Land use by size of the farms
Agricultural area (ha) Livestock (LU)
Size of the farm
< 20 20 - < 50 50 -<100 100 =< All farms 0 0<-<100 100-<500 500 =<
Area (1000 ha)
Total area of agricultural holdings 229.3 422.2 645.8 1527.2 2824.4 862.5 717.8 782.4 461.7
Other area 30.0 28.1 29.7 148.4 236.1 100.2 79.6 34.3 22.0
Wooded area 17.5 17.7 17.1 114.8 167.2 71.6 58.8 22.1 14.7
Agricultural area 199.2 394.1 616.1 1378.8 2588.3 762.3 638.2 748.1 439.7
Arable land 159.7 358.8 576.0 1303.9 2398.4 710.6 556.3 704.6 426.9
Cereals 109.2 230.7 317.8 796.7 1454.5 480.9 334.4 325.0 314.2
Common wheat and spelt 31.9 84.7 134.2 406.4 657.2 224.9 121.8 145.0 165.5
Durum wheat 0.0 0.0 0.0 0.0 0.0 0.0 0.0 0.0 0.0
Rye 2.9 4.5 5.7 13.9 27.0 12.2 6.6 4.3 3.9
Barley 65.7 124.5 157.1 326.6 673.9 216.1 180.4 153.4 124.0
Oats 4.7 10.1 11.8 29.0 55.6 15.4 14.9 12.5 12.8
Grain maize 0.0 0.0 0.0 0.0 0.0 0.0 0.0 0.0 0.0
Dried pulses 0.8 2.7 3.1 8.5 15.1 6.6 4.3 2.7 1.5
Root crops 2.1 9.2 18.9 60.4 90.7 43.9 17.7 18.5 10.5
Potatoes 0.6 2.7 7.3 29.0 39.5 20.3 7.0 7.0 5.2
Sugar beet 1.1 5.2 9.6 30.4 46.4 23.4 8.4 9.3 5.2
Fodder root 0.4 1.3 2.0 1.1 4.8 0.2 2.3 2.2 0.1
Industrial crops 3.1 12.6 23.6 70.9 110.3 30.9 19.4 27.3 32.6
Tobacco 0.0 0.0 0.0 0.0 0.0 0.0 0.0 0.0 0.0
Hops 0.0 0.0 0.0 0.0 0.0 0.0 0.0 0.0 0.0
Cotton 0.0 0.0 0.0 0.0 0.0 0.0 0.0 0.0 0.0
Rape and turnip 3.1 12.6 23.6 70.8 110.1 30.8 19.4 27.3 32.6
Sunflower 0.0 0.0 0.0 0.0 0.0 0.0 0.0 0.0 0.0
Soya 0.0 0.0 0.0 0.0 0.0 0.0 0.0 0.0 0.0
Fresh vegetables, melons, strawberry 0.9 1.4 2.0 6.0 10.4 7.1 1.7 1.3 0.3
outside 0.8 1.4 2.0 6.0 10.2 7.0 1.7 1.3 0.3
under glass 0.1 0.0 0.0 0.0 0.1 0.1 0.0 0.0 0.0
Flower and ornamental plants 0.3 0.0 0.0 0.0 0.5 0.4 0.0 0.0 0.0
outside 0.0 0.0 0.0 0.0 0.1 0.1 0.0 0.0 0.0
under glass 0.3 0.0 0.0 0.0 0.3 0.3 0.0 0.0 0.0
Forage plants 36.8 66.6 148.3 188.4 440.1 39.9 119.3 260.9 20.0
Fallow land 4.0 28.2 46.1 98.1 176.5 57.9 37.9 50.4 30.3
Kitchen garden 0.0 0.0 0.0 0.0 0.0 0.0 0.0 0.0 0.0
Permanent pasture and meadows 37.2 33.0 37.6 72.7 180.6 44.5 80.4 43.1 12.5
Permanent crops 2.4 2.3 2.4 2.2 9.3 7.1 1.5 0.5 0.2
Fruit and berry plantation 1.7 1.8 1.8 1.6 7.0 5.1 1.2 0.5 0.2
Citrus plantation 0.0 0.0 0.0 0.0 0.0 0.0 0.0 0.0 0.0
Olive trees 0.0 0.0 0.0 0.0 0.0 0.0 0.0 0.0 0.0
Vineyard 0.0 0.0 0.0 0.0 0.0 0.0 0.0 0.0 0.0
Ratios
Agricultural area per holding (ha) 10.0 32.4 71.6 186.1 53.8 42.9 31.8 96.0 175.0
Agricultural area… (%)
… own farmed 90.1 85.3 79.5 68.3 75.2 72.5 80.8 76.4 69.6
… in less favoured or mountain area 0.0 0.0 0.0 0.0 0.0 0.0 0.0 0.0 0.0
… organic farmed 4.6 4.8 5.6 5.5 5.3 4.1 7.1 7.6 1.0
… irrigated 3.1 7.2 12.2 10.3 9.7 7.7 7.6 14.5 8.2
[image:5.595.50.551.102.736.2]6 St a t i s t i c s i n f o c u s — Agriculture and fisheries — 18/2006 —————————————————————————
#
Denmark – 2005
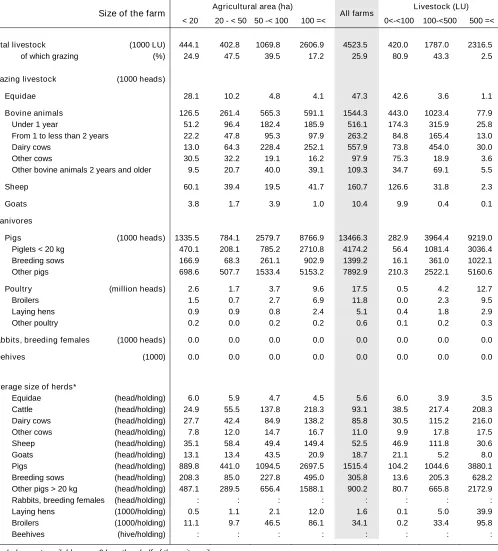
Table 4 – Livestock by size of the farms
Agricultural area (ha) Livestock (LU)
Size of the farm
< 20 20 - < 50 50 -< 100 100 =< All farms 0<-<100 100-<500 500 =<
Total livestock (1000 LU) 444.1 402.8 1069.8 2606.9 4523.5 420.0 1787.0 2316.5
of which grazing (%) 24.9 47.5 39.5 17.2 25.9 80.9 43.3 2.5
Grazing livestock (1000 heads)
Equidae 28.1 10.2 4.8 4.1 47.3 42.6 3.6 1.1
Bovine animals 126.5 261.4 565.3 591.1 1544.3 443.0 1023.4 77.9
Under 1 year 51.2 96.4 182.4 185.9 516.1 174.3 315.9 25.8
From 1 to less than 2 years 22.2 47.8 95.3 97.9 263.2 84.8 165.4 13.0
Dairy cows 13.0 64.3 228.4 252.1 557.9 73.8 454.0 30.0
Other cows 30.5 32.2 19.1 16.2 97.9 75.3 18.9 3.6
Other bovine animals 2 years and older 9.5 20.7 40.0 39.1 109.3 34.7 69.1 5.5
Sheep 60.1 39.4 19.5 41.7 160.7 126.6 31.8 2.3
Goats 3.8 1.7 3.9 1.0 10.4 9.9 0.4 0.1
Granivores
Pigs (1000 heads) 1335.5 784.1 2579.7 8766.9 13466.3 282.9 3964.4 9219.0
Piglets < 20 kg 470.1 208.1 785.2 2710.8 4174.2 56.4 1081.4 3036.4
Breeding sows 166.9 68.3 261.1 902.9 1399.2 16.1 361.0 1022.1
Other pigs 698.6 507.7 1533.4 5153.2 7892.9 210.3 2522.1 5160.6
Poultry (million heads) 2.6 1.7 3.7 9.6 17.5 0.5 4.2 12.7
Broilers 1.5 0.7 2.7 6.9 11.8 0.0 2.3 9.5
Laying hens 0.9 0.9 0.8 2.4 5.1 0.4 1.8 2.9
Other poultry 0.2 0.0 0.2 0.2 0.6 0.1 0.2 0.3
Rabbits, breeding females (1000 heads) 0.0 0.0 0.0 0.0 0.0 0.0 0.0 0.0
Beehives (1000) 0.0 0.0 0.0 0.0 0.0 0.0 0.0 0.0
Average size of herds*
Equidae (head/holding) 6.0 5.9 4.7 4.5 5.6 6.0 3.9 3.5
Cattle (head/holding) 24.9 55.5 137.8 218.3 93.1 38.5 217.4 208.3
Dairy cows (head/holding) 27.7 42.4 84.9 138.2 85.8 30.5 115.2 216.0
Other cows (head/holding) 7.8 12.0 14.7 16.7 11.0 9.9 17.8 17.5
Sheep (head/holding) 35.1 58.4 49.4 149.4 52.5 46.9 111.8 30.6
Goats (head/holding) 13.1 13.4 43.5 20.9 18.7 21.1 5.2 8.0
Pigs (head/holding) 889.8 441.0 1094.5 2697.5 1515.4 104.2 1044.6 3880.1
Breeding sows (head/holding) 208.3 85.0 227.8 495.0 305.8 13.6 205.3 628.2
Other pigs > 20 kg (head/holding) 487.1 289.5 656.4 1588.1 900.2 80.7 665.8 2172.9
Rabbits, breeding females (head/holding) : : : : : : : :
Laying hens (1000/holding) 0.5 1.1 2.1 12.0 1.6 0.1 5.0 39.9
Broilers (1000/holding) 11.1 9.7 46.5 86.1 34.1 0.2 33.4 95.8
Beehives (hive/holding) : : : : : : : :
Symbols : not available 0 less than half of the unit or nil
[image:6.595.52.550.101.652.2]———————————————————————— 18/2006 — Agriculture and fisheries — St a t i s t i c s i n f o c u s 7
#"
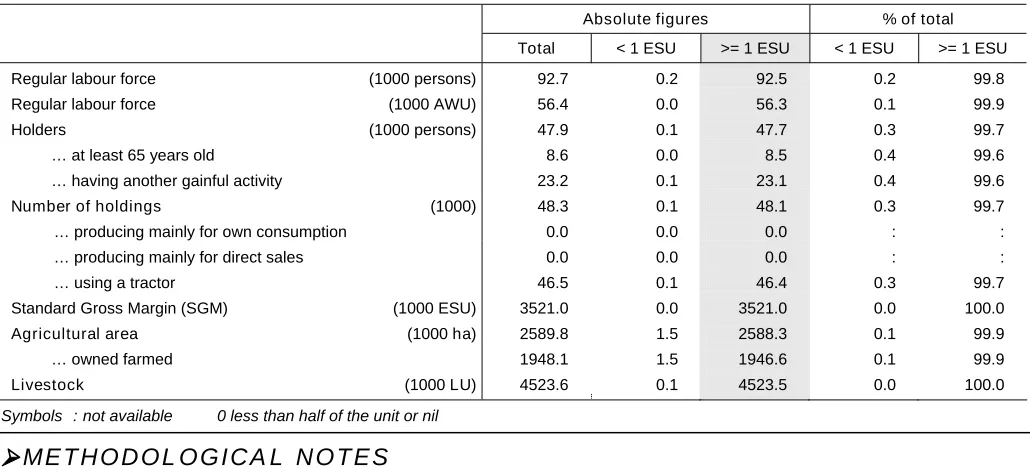
Denmark – 2005
Table 5 – Subsistence farming
Absolute figures % of total
Total < 1 ESU >= 1 ESU < 1 ESU >= 1 ESU
Regular labour force (1000 persons) 92.7 0.2 92.5 0.2 99.8
Regular labour force (1000 AWU) 56.4 0.0 56.3 0.1 99.9
Holders (1000 persons) 47.9 0.1 47.7 0.3 99.7
… at least 65 years old 8.6 0.0 8.5 0.4 99.6
… having another gainful activity 23.2 0.1 23.1 0.4 99.6
Number of holdings (1000) 48.3 0.1 48.1 0.3 99.7
… producing mainly for own consumption 0.0 0.0 0.0 : :
… producing mainly for direct sales 0.0 0.0 0.0 : :
… using a tractor 46.5 0.1 46.4 0.3 99.7
Standard Gross Margin (SGM) (1000 ESU) 3521.0 0.0 3521.0 0.0 100.0
Agricultural area (1000 ha) 2589.8 1.5 2588.3 0.1 99.9
… owned farmed 1948.1 1.5 1946.6 0.1 99.9
Livestock (1000 LU) 4523.6 0.1 4523.5 0.0 100.0
Symbols : not available 0 less than half of the unit or nil
ME T H O D O L O G I C A L N O T E S
"